-
Paper Information
- Next Paper
- Previous Paper
- Paper Submission
-
Journal Information
- About This Journal
- Editorial Board
- Current Issue
- Archive
- Author Guidelines
- Contact Us
American Journal of Bioinformatics Research
p-ISSN: 2167-6992 e-ISSN: 2167-6976
2011; 1(1): 6-17
doi: 10.5923/j.bioinformatics.20110101.02
On Predicting Conformational B-cell Epitopes: a Comparative Study and a New Model
 Abstract
 Reference
 Full-Text PDF
 Full-Text HTML
Khaled A Hassan 1, Amr Badr 2, Abdel-Fatah Hegazy 3
1Department of Computer Science, Arab Academy for Science, Technology and Maritime Transport, Cairo, Egypt
2Department of Computer Science, Faculty of Computers and Information, Cairo University, Cairo, Egypt
3Department of Information Systems, Arab Academy for Science, Technology and Maritime Transport, Cairo, Egypt
Correspondence to: Khaled A Hassan , Department of Computer Science, Arab Academy for Science, Technology and Maritime Transport, Cairo, Egypt.
| Email: |  |
Copyright © 2012 Scientific & Academic Publishing. All Rights Reserved.
Identification of conformational B-cell epitopes is considered the crucial step in designing effective peptide vaccines against pathogens. Computer based methods play an important role in this process as the actual experimental determination of epitopes is very expensive in terms of cost and time. In this paper, we have carried out a comparative study and discussions for different methods based on the two major computational approaches for predicting conformational B-cell epitopes: sequence- based and structure- based approaches. As a result of this study, we developed a novel computational method “CBCPRED” to predict conformational B-cell epitope residues from the target antigen structure by combining support vector machine model with protein structural features and the propensity scores of amino acid physico – chemical properties. Using fivefold cross validation and leave-one-out cross validation techniques on the 75 antigen structures of the Discotope dataset, CBCPRED achieves an area under receiver operator characteristics curve (AUC) of 0.818 and 0.859, respectively. We benchmark “CBCPRED” on a more recent benchmark (Ponomarenko et al. 2007) dataset after removing antigens sequence redundancy where no two antigen sequences have more than 40% sequence identity, achieving AUC of 0.747. CBCPRED is available at http://www.fci.cu.edu.eg:8080/CBCPRED/predict.html.
Keywords: Conformational B-Cell Epitopes, Temperature Factor; Relative Solvent Accessibility; Propensity Score, Amino Acid Physic – Chemical Properties, PSSM Profiles, Graph Centrality, Support Vector Machine Model
Cite this paper: Khaled A Hassan , Amr Badr , Abdel-Fatah Hegazy , "On Predicting Conformational B-cell Epitopes: a Comparative Study and a New Model", American Journal of Bioinformatics Research, Vol. 1 No. 1, 2011, pp. 6-17. doi: 10.5923/j.bioinformatics.20110101.02.
Article Outline
1. Introduction
- B-cell epitopes are segments of the antigen molecules recognized by the binding sites of the immunoglobulin molecules or B-cells[1]. Identification of B-cell epitopes in the target antigens plays an important role in epitope based vaccine design. Experimental determination of epitopes is very expensive and has a lot of limitations. Consequently, it is highly desirable to develop computational methods for reliable identification of B-cell epitopes. B-cell epitopes can be classified into two groups: linear (continuous) epitopes and conformational (discontinuous) epitopes. Linear B-cell epitope is a short peptide fragment which is specified by the primary amino acid sequence of the protein[2], while conformational B-cell epitope consists of residues that are distantly separated in the primary sequence of the antigen, and are specified by the close proximity within the folded 3-dimensional protein structure[3]. Most of B-cell epitopes (~90%) appear to be conformational epitopes[4]. In the past, several computational methods had been focusing on linear epitopes prediction. Most of these methods were based on amino acid propensity scales, such as Parker et al.[5], Karplus et al.[6], Emini et al.[7], PREDITOP[8], PEOPLE[9], BEPITOPE[10] and BcePred[11] and so on. Unfortunately, the prediction performance of these methods was far from ideal. Hence, machine learning methods had been explored for predicting linear B-cell epitopes using amino acid sequence information, such as BepiPred[12], ABCPred[13], Söllner and Mayer[14], Chen et al.[15], Söllner et al.[16], BCPred[17], FBCPred[18], El-Manzalawy et al. [19] and COBEpro [20]. A competitive performance over all linear epitope prediction methods had been achieved by COBEpro[21]. On the other hand, a limited number of computation methods have been proposed for conformational B-cell epitope prediction. However, compared with linear epitopes prediction, the conformational B-cell epitope prediction is more challenging. There are two major approaches for predicting conformational B-cell epitopes: Sequence-based and Structure-based prediction methods. Sequence-based prediction methods have the advantage that there is no need for the structure of the target antigen to be known. CBTOPE[22] is a computational method for predicting conformational B-cell epitopes in an antigen from its primary structure. It developed a support vector machine model using composition of a binary profile of amino acid patterns represented by a feature vector of 21 attributes and a profile of physico – chemical attributes. However, structure-based prediction methods try to predict the conformational B-cell epitopes with the information of the antigen 3D structure. The first conformational epitope prediction method is the conformational epitope predictor CEP[23]. It utilizes the accessibility of residues to predict linear and conformational B-cell epitopes. Subsequently, Discotope[3] is a method for predicting conformational B-cell epitopes by combining the residue propensity scale of log-odds ratios and contact number. PEPITO[24] is a method for predicting conformational B-cell epitopes using the combination of amino acid propensity scores and half sphere exposure values[25] achieving improved performance over Discotope method. Ellipro[26] is a conformational B-cell epitope predictor server had been developed based on a modified version of a method was originally introduced by Thornton et al.[27] for predicting linear B-cell epitopes. It combines the residue protrusion index and a residue clustering algorithm to predict conformational B-cell epitopes. EPCES[28] uses six different scoring functions: residue epitope propensity[29], conservation score[29], side chain energy score[29], contact number[3], surface planarity score[30], and secondary structure composition[31] to identify antigenic epitopes based on unbound antigen structures. EPSVR[32] is a support vector regression model that used the six consensus scoring functions used in EPCES. EPMeta[32] combines EPSVR with 5 other existing classifiers to predict conformational B-cell epitopes. Liu R et al.[33] developed a logistic regression based model using two structural features temperature factor and relative accessible surface area (RASA).In this paper, we are evaluating the sequence-based prediction approach for predicting conformational B-cell epitope from the antigen primary sequence. We explore the utility of evolutionary profiles in predicting conformational B-cell epitopes using different representations: amino acid identities, position specific scoring matrix (PSSM) profiles, and propensity scale of amino acid physico-chemical properties using Epit[34]. Additionally, we propose a new method for predicting conformational B-cell epitopes from the primary sequence using the structural information predicted by a protein structure prediction server SABLE[35].We conduct a comparative study of the two major approaches sequence-based and structure-based approaches by trying several experiments based on the windows of the two different types.Finally, we present a novel prediction method to identify conformation B-cell epitope residues from the input 3-dimensional structure. Our prediction model chooses the structural features: relative solvent accessibility (RSA) and temperature factors combined with the residue propensity scores of three physico-chemical properties: hydrophilicity, antigenic and flexibility. The prediction algorithm is based on support vector machine model to predict the conformational epitope residues from the target antigen structure. Comparison with existing approaches shows that our method achieves better performance in terms of average AUC value. A web server CBCPRED has been developed for predicting conformational B-cell epitope residues: http://www.fci.cu.edu.eg:8080/CBCPRED/predict.html
2. Methods
2.1. Datasets
- Datasets used in our experiments are relevant to the goals and scope of this study. We used a sequence based dataset to evaluate the sequence-based prediction approach for predicting conformational B-cell epitopes from the antigen primary sequence. We used a structure based dataset to compare sequence-based and structure-based prediction methods; additionally, it is used as the training set for the new prediction model “CBCPRED”. Another different structure based dataset is used as independent test set to evaluate the proposed prediction method “CBCPRED”.
2.1.1. Raghava et al. 2010 – Antigen Sequence Dataset
- The representative dataset of 187 antigenic sequences prepared by Raghava et al. 2010[22] is used (http://www.imtech.res.in/raghava/cbtope/data/dataD3_lower.fasta) in this study. The dataset were obtained from 526 antigenic sequences combined from IEDB[36] and benchmark[37] datasets after removing the antigenic sequence redundancy using program CDHIT[38] at 40% cutoff. We randomly divided the 187 antigen sequences into 5 groups for cross validation and testing. This dataset is used to evaluate sequence based approach for predicting conformational B-cell epitope.
2.1.2. Discotope– Antigen Structure Dataset
- The representative dataset of 75 antigen-antibody (Ag-Ab) complexes prepared by Pernille et al.[3] was used (http://www.cbs.dtu.dk/suppl/immunology/DiscoTope.php) in this study. These complexes were selected using X-ray crystallography with resolution less than 3 Å. The corresponding antigen PDB file is obtained from Protein Data Bank[44]. Pernille et al.[3] had divided the 75 antigens into 25 heterogeneous groups. The 25 heterogeneous groups of antigens were divided into five data sets for cross validation and testing. In this dataset, the antigen residue is determined as epitope residue if the distance between any of its atoms and any atom of the antibodies is less than 4Å. The number of epitope and non-epitope residues in this dataset are 1202 and 13242 respectively. We generated the antigen sequences of the 75 antigen chains to be used for the comparison of the sequence and structure based approaches.
2.1.3. Ponomarenko et al. 2007– Independent Test Set
- The Benchmark dataset consists of 161 antigen chains obtained from 144 antigen-antibody (Ag-Ab) complex structures. The epitope residues were specified in this dataset as the distance between antigens amino acid atoms and antibody atoms is less than 4 Å[37]. We removed sequence redundancy from the 161 antigen chain sequences using CDHIT[38] at 40% cutoff, obtaining only 50 antigen chains where no two antigen sequences have more than 40% sequence identity. In order ensure the low sequence identity between training and testing datasets, we removed the chains that are already existing in the Discotope dataset obtaining only 31 antigen chains (1BGX:T, 1DEE:H, 1E6J:P, 1IGC:A, 1KEN:A, 1NL0:G, 1NSN:S, 1ORQ:C, 1PKQ:E, 1S78:B, 1SY6:A, 1TZI:V, 1WEJ:F, 1YJD:C, 1YNT:F, 1ZA3:R, 1ZTX:E, 2ADF:A, 1NMB:N, 2B4C:G, 1T03:B, 1R3K:C, 1V7M:V, 1Z3G:A, 1IAI:I, 1IAI:M, 1KB5:A, 1KB5:B, 1QFW:A, 1QFW:B, 1OB1:C). The 31 antigen chains are used as independent test case for our method. The number of epitope and non-epitope residues in the independent test set is 467 and 6171, respectively.
2.2. Feature Representation
- In both sequence and structure base antigens, the residue function is not only determined by itself but also affected by its neighbours[22]. Hence, sequence based and structured based feature windows of different sizes from 5 to 23 residues are generated in this study. In the sequence based feature window, the target residue is located at the center of the window and the neighbouring residues are determined according to the order of residues in the antigen sequence. In the structured based sequence window, the target residue is the first residue of the window followed by its neighbours; the neighbours are determined by the Euclidean distance[40] from the neighbouring residues and the target residue. For each window instance, a label is assigned according to the label of its center. 1 label indicates that the center residue is epitope residue and 0 label indicates that the center residue is non-epitope residue. The following representations are explored for different window sizes:
2.2.1. Amino Acid Identity Representation
- Each structure and sequence based window is represented by an ordered n-tuple of amino acids from the 20-letter amino acid alphabet.
2.2.2. Position Specific Scoring Matrix (PSSM) Profiles
- Each antigenic sequence in the structure and sequence based datasets is aligned against a non-redundant protein sequence database generated from GenPept[41], Swissprot[42], PIR[43], PDB[44], and NCBI RefSeq[45] using PSI-BLAST[46] (number of iterations = 3 and cut-off at 0.001). Each residue in the N-residues sequence and structure based window is then encoded using the (PSSM) matrix for that residue in the resulting PSSM profile. Hence, each N-residues window is represented by (N x 20) feature vector.
2.2.3. Graph Representation
- For the structure based dataset (Discotope), each 3D structure window is represented by an undirected graph. Graph nodes represent the sequence number of each residue in the protein PDB. Edges represent the actual linkage along the spatial neighbours in the structure. Two residues (graph nodes) are connected by an edge if the Euclidean distance between them doesn’t exceed a threshold. We choose 7 Å to be a distance threshold between residues (nodes). The resulting window graphs are represented as a file for each window containing the connecting edges between nodes as well as the isolated nodes.
2.2.4. Graph Centrality Features
- For each graph representation of the structure based window of size N in the structure based dataset (Discotope), the network centrality parameters are computed using Cytoscape plug-in CentiScaPe[46]. Figure-1 shows a sample structure window represented as a graph in the cytoscape program. These parameters are radiality, betweenness, degree, stress and centroid. The network centrality parameters are computed for each node in the graph. Hence, each structure based window is represented by N-feature vector for each network centrality parameter. A composition profile of (5xN) feature vector is also generated for all network centrality parameters of the each residue.
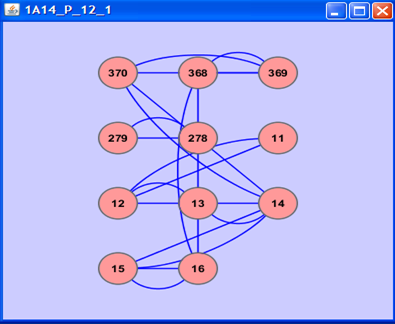 | Figure 1. Sample structure window of size 11 residues represented in the cytoscape program. |
 | (1) |
 is the centrality degree value of residue r, min(Degree) and max(Degree) are the minimum and maximum degree value of all residues in the antigen chain, respectively.
 2.2.5. Physico – Chemical Properties
- Amino acids' physico-chemical properties contribute in predicting linear B-Cell epitope from the antigen sequenc. In our study, 8 physico-chemical properties are chosen as features representation from predicting conformational B-cell epitopes from the antigen primary sequence. These properties are hydrophobicity[48], hydrophilicity[5], flexibility[6], accessibility[7], exposed, Chou & Fasman Beta- Turn[49], antigenic[50], and polarity[51]. Each sequence window is represented by N feature vector for each physico – chemical property.
2.2.6. Propensity Score of Physico – Chemical Properties
- In this study, we calculated the propensity score of each amino acid physico-chemical properties for each residue. The propensity score is calculated by sequentially averaging amino acid physico-chemical attribute value within a window of 9 residues, then the scores are summed up for all residues within 10Å from the target residue. The same equation is used before by Pernille et al.[3] for calculating the propensity score of amino acid epitope log-odds ratios to be used in the Discotope score[3]. The propensity score of amino acid physico-chemical property (hydrophilicity for example) of residue r is calculated by the following equation:Where r is the target residue in the antigen structure, ‘Hydrophilicity’ a physico – chemical property, nr is the number of neighbor residues within 10Å from the target residue (r), rn: is a neighbour residue, and SAPS is the sequential averaging propensity score function calculated by the following equation:
 | (3) |
2.2.7. Relative Solvent Accessibility – NACCESS RSA
- Many studies have evaluated the effectiveness of using the residue accessible surface area to predict conformational epitopes. In this study, the residue relative solvent accessibility in unbound antigens is calculated using program NACCESS[52] and normalized using the following equation:
 | (4) |
2.2.8. Predicted Relative Solvent Accessibility of Amino Acid Residues of the Protein Sequences – SABLE RSA
- SABLE is a sequence-based prediction server to predict relative solvent accessibilities, secondary structures and transmembrane domains for proteins of unknown structure[53]. In this study, we used SABLE to predict the RSA of each amino acid residue of the antigenic sequence dataset. For each antigen sequence, the predicted relative solvent accessibility is normalized using the following equation:
 | (5) |
2.2.9. Temperature Factor
- Temperature factor reflects the flexibility of residues in the protein structure resulting from protein crystallography[54]. The Temperature factor is a distinguished feature to characterize the binding residues of proteins in their holo structures. For each protein structure in the Discotope dataset, the temperature factor is extracted for each residue and normalized using the following equation:
 | (6) |
 is the temperature factor of residue r, <
 > and
> and  are the mean value and the standard deviation of the temperature factor values of all residues in the antigen chain, respectively.
 2.2.10.Amino Acid Composition
- For each structure and sequence window, the number of occurrences of each amino acid code is computed and averaged by the window size. Thus structured and sequence window is represented by 1 x 20 feature vector.
2.3. Machine Learning Models
- In this study, we used different classifiers to differentiate whether a residue in the structure or sequence based antigens belongs to conformational epitope regions or not. For each machine learning model, several predictors were constructed using different types of feature representation. Each predictor was input a structural or sequence window. Each residue was represented by N input vector if a single feature was used and by m x N input vector if combined m-features were used.
2.3.1. Naïve Bayesian
- Naïve Bayesian classifier is a well-established probabilistic classifier based on Bayes rule.
2.3.2. Logistic Regression
- Logistic Regression classifier is a statistical predictive model that can be used when the target variable is a categorical variable of two categories. Hence, the Logistic regression is suitable for binary classification. Given a set of labelled training patterns (xi, yi), where xi ∈ Rp, yi ∈ {+1, −1}, the logistic regression predictors assigned a probability θi = P{ yi = 1|xi } to the target residue using the logit function:
 | (7) |
 are the classifier parameters.
2.3.3. Support Vector Machines and Kernel Methods
- Support vector machine is a classification algorithm aims to find a deterministic mapping function between the input features. Given a set of labeled training patterns (xi, yi), where xi∈Rp, yi∈ {+1, −1}, training a SVM classifiers involves finding a maximum-margin hyperplane that divides positive and negative training data samples. In case of the training data are not linearly separable, a kernel function is used to map the non-linearly separable data into a higher-dimensional space and thus the data are assumed to be linearly separable. Given any two sample observation in the input space (xi, xj), the kernel function can be written as a dot product of two feature vectors into high dimensional feature space K(xi, xj) = Φ(xi)T Φ(xj). In this study, we used two types of vector kernels: polynomial and Gaussian RBF kernelsPolynomial kernel:
 | (8) |
 | (9) |
2.3.4. Balanced Classifier
- In order to develop a prediction method, we created overlapping patterns for each antigen, one pattern for each residue. There are two types of patterns positive and negative patterns. Positive pattern indicates that the target residue is an epitope residue while a negative pattern indicates that the target residue is not epitope residue. During our study in different antigen dataset, we found that there are only few residues in an antigen are classified as epitope residue. This means that the number of negative patterns will be much higher than positive patterns in our training dataset. This creates poor performance and CPU time consuming problems. Hence, we used the balanced classifier for training our base classifier on unbalanced data. The training instances are randomized and only subset of them are used for training the classifier. The Balanced classifier is already implemented in the Weka [56]; the machine learning workbench.
2.3.5. Implementation
- In this study, we have developed the Naïve Bayesian, Logistic Regression, and support vector machine classifiers using WEKA[56]: the machine learning workbench.
2.4. Performance Evaluation
- Cross validation is a method for evaluating the performance of models. In this study, we used the two famous types of cross validation techniques, K-fold cross-validation and Leave-one-out cross-validation. 5 fold cross validation technique is used in evaluating the sequence based and structured based prediction methods. For each run, one subset of the five groups was left out for testing, while the remaining four subsets were used for training. Leave-one-out cross-validation technique is used for evaluating the new model CBCPRED. For each run, one protein antigen in the Discotope dataset[3] was left for testing, while the remaining 74 protein antigens were used for training. We used the area under a receiver operator characteristics curve (AUC)[55] as a performance measure. In the fivefold cross validation technique, the final performance is obtained by averaging the AUC value of the five subsets; while in leave-one-out cross validation technique, it is obtained by averaging the AUC value of all the 75 antigens.
3. Results
3.1. Predicting Conformational B-Cell Epitopes from the Antigen Primary Sequence
- The first attempt for predicting conformational B-cell epitopes in an antigen from its amino acid sequence is CBTOPE[22]. It developed a support vector machine model using composition of a binary profile of amino acid patterns represented by a feature vector of 21 attributes and a profile of physico – chemical attributes. Although CBTOPE[22] showed improvement over the structure based methods, we see that the results are limited to unrealistic settings: 1) The authors balance the test data; 2) The authors perform cross validation on window level not in sequence level; and 3) The authors used the test data to determine the optimal support vector machine parameters. In this section, we conduct several experiments on the sequence based data set: Raghava et al. 2010[23] dataset to predict conformational B-cell epitopes from the antigen sequences. The fivefold cross validation technique is performed in the antigen sequences level not in the window instances level.
3.1.1. The effect of Sequence Identity, PSSM Profiles, SABLE-RSA, and Amino Acid Composition Features
- Naïve Bayesian and Logistic Regression models have been developed using the sequence identity, PSSM profiles, SABLE-RSA, and amino acid composition features represented by vectors of dimension Nx1, Nx20, Nx1 and 20, respectively (N is the window size). In order to optimize the performance of the models, we developed the Naïve Bayesian and logistic regression models using patterns of window sizes from 5 to 23. Five-fold cross-validation technique is conducted on the five groups of antigen sequences generated from Raghava et al. 2010[22] dataset; for each model the average area under receiver operator characteristics curve (AUC) of the five groups is computed. It was observed that the PSSM profiles feature achieved the best performance with both classifiers. The average AUC value is 0.643 at window size 13. Additionally, we developed the same models using the composition profile of features: (sequence identity and PSSM profiles), (sequence identity and SABLE-RSA) and (SABLE-RSA and PSSM profiles) represented by vectors of dimension Nx21, Nx2 and Nx21, respectively (N is the window size). In order to save time and resources we choose window size of 13 for this experiment. Fivefold cross validation is conducted in the five groups of sequences and it was observed that the Naïve Bayesian classifier with the combination of PSSM profiles and SABLE-RSA features achieve best performance with average AUC of 0.656. Figure 2, shows the average AUC results generated in our experiments. Figure 3, shows the ROC curves generated from cross validating the best model (Naïve Bayesian classifier with the composition of PSSM profiles and SABLE-RSA) on the 5 antigen groups.
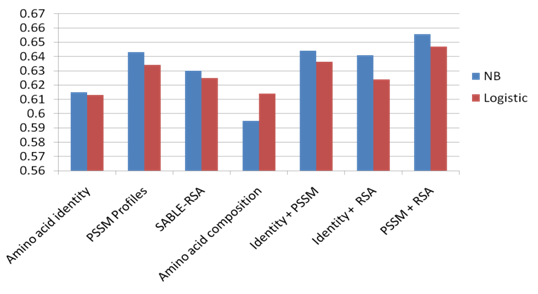 | Figure 2. The performance results of fivefold cross validation on Raghava et al.’s dataset. |
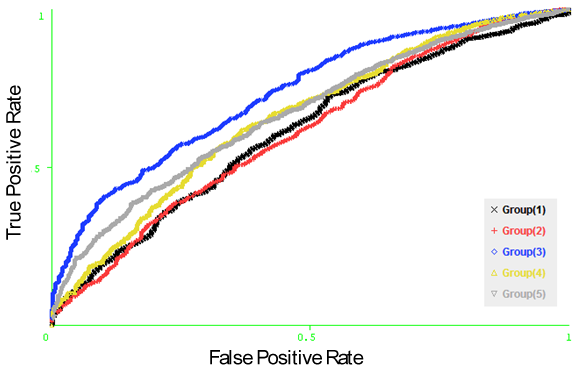 | Figure 3. The ROC curves generated from fivefold cross validation on Raghava et al.’s dataset on the model (Naïve Bayesian classifier with the composition of PSSM profiles and SABLE-RSA features). |
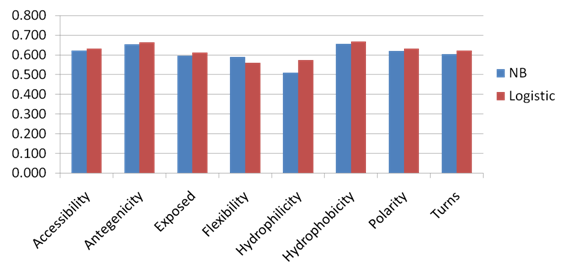
3.1.2. The Effect of Amino Acid Physico-Chemical Properties of Antigen Sequence Residues
- Naïve Bayesian and Logistic Regression models have been developed using the amino acid physico – chemical properties (hydrophobicity, hydrophilicity, flexibility, accessibility, exposed, Chou & Fasman Beta-Turn, antigenic, and polarity) of each residue in the antigen sequence, represented by vectors of size N x 1 for each property and N x 8 for the composition profile of all physico – chemical properties (N is the window size). In order to optimize the performance of the models, we developed the Naïve Bayesian and logistic regression models using patterns of window sizes from 5 to 23. Five-fold cross-validation technique is conducted on the five groups of antigen sequences generated from Raghava et al. 2010[22] dataset; for each model the average area under receiver operator characteristics curve (AUC) of the five groups is computed. It was observed that the Logistic Regression model using the composition of all physico – chemical attributes of window size 19 achieved the best performance with average AUC of 0.614. Figure 4 shows the performance results of cross validation using amino acid physico – chemical properties. Figure 5, shows the ROC curves generated from fivefold cross validation of the best model on the 5 antigen groups.
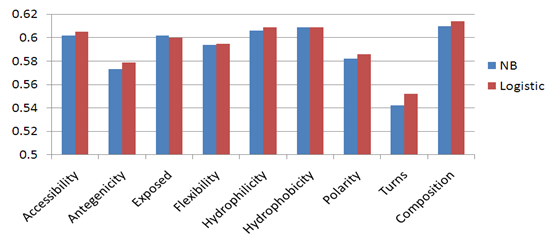 | Figure 4. The performance results of fivefold cross validation on Raghava et al.’s dataset using amino acid physico – chemical properties. |
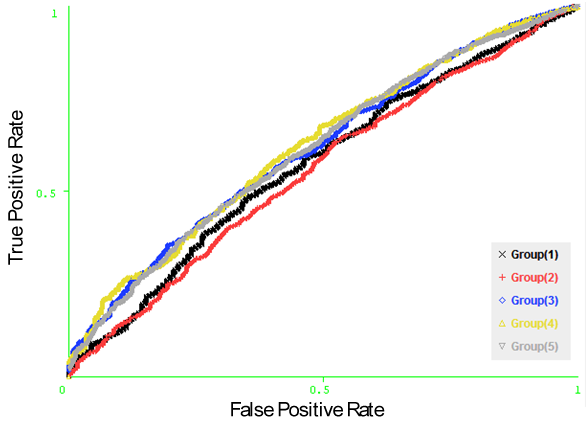 | Figure 5. The ROC curves generated from fivefold cross validation on Raghava et al.’s dataset on the model (Logistic Regression with the composition of all amino acid physico – chemical properties). |
3.1.3. The Effect of Propensity Scale of Amino Acid Physico-Chemical Properties
- We used the propensity scale classifier in the Epit[34] tool to evaluate the performance of each single property of the 8 amino acid physico – chemical properties. The input to the classifier is the amino acid sequences of different window sizes from 5 to 23, where the target residue is located in the middle of the window. The Propensity Scale classifier is configured with the scale of the 20 amino acids of each amino acid physico – chemical parameter. Using fivefold cross validation technique and computing the average AUC of the five groups, we achieved the results in Figure 6 for each amino acid physico – chemical property. It was observed that the propensity scale of the hydrophilicity physico – chemical property of the input sequences of size 11 achieved the best performance with average AUC of 0.602. Figure 7, shows the ROC curves generated from fivefold cross validation of the hydrophilicity propensity scale on the 5 antigen groups.
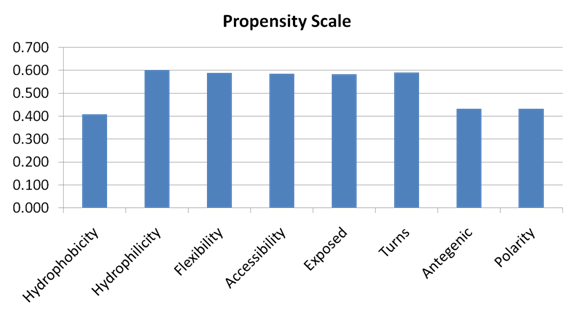 | Figure 6. The performance results of fivefold cross validation on Raghava et al.’s dataset using the propensity scale of amino acid physico – chemical properties. |
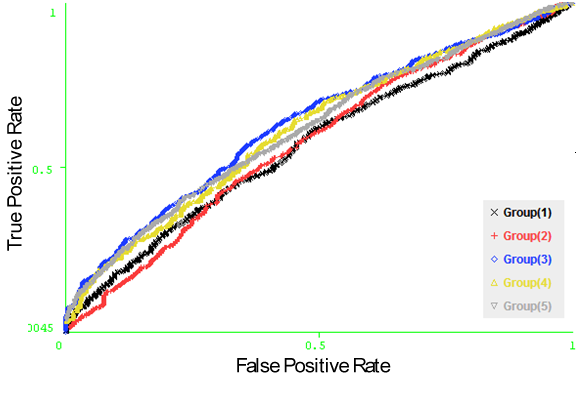 | Figure 7. The ROC curves generated from fivefold cross validation on Raghava et al.’s dataset on the hydrophilicity propensity scale. |
3.2. Graph Centrality Features for Predicting Conformational B-Cell Epitopes from Antigen Structure
- In the physical process of protein folding in the antigen, the amino acids interact with each other to produce a well-defined three-dimensional structure. Each residue in the antigen has a defined dimension. Our idea in this study is to represent each structure window as graphs and then extract features from the generated graphs. We used Cytoscape plug-in CentiScaPe[46] to extract the graph centrality features (Betweenness, Centroid, Degree, Radiality, and Stress) from each graph window on the DiscoTope dataset. Naïve Bayesian and Logistic regression classifiers have been developed using the graph centrality features. In order to save time and resources we fixed the number of nodes in each graph to 9. Five-fold cross-validation technique is conducted on the five groups of antigen structures generated from DiscoTope; for each model the average area under receiver operator characteristics curve (AUC) of the five groups is computed. Unfortunately, the centrality graph features were not sufficient to predict conformational B-cell epitope from the antigen structure as the AUC result doesn’t exceed 0.6. Figure 8 shows the average AUC results generated in our experiments.
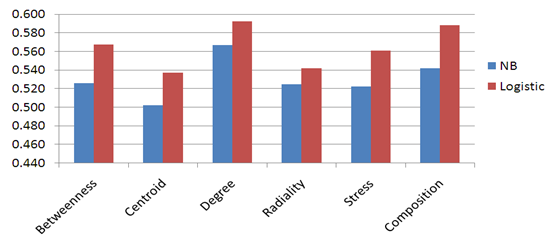 | Figure 8. The performance results of fivefold cross validation on DiscoTope dataset using Graph centrality features. |
 | Figure 9. The performance results of fivefold cross validation on DiscoTope dataset using propensity score of amino acid physico – chemical properties. |
3.3. Propensity Score of Amino Acid Physico – Chemical Properties for Predicting Conformational B-Cell Epitope fromthe Antigen Structure
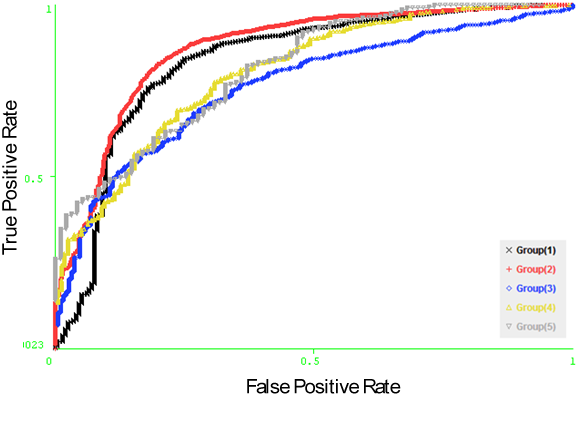
- Naïve Bayesian and Logistic regression classifiers have been developed with the structure based window of size from (5 to 23) of the propensity score of each amino acid physico – chemical property. Five-fold cross-validation technique is conducted on the five groups of antigen structures generated from DiscoTope; for each model the average area under receiver operator characteristics curve (AUC) of the five groups is computed. It was observed that the Logistic Regression model using the propensity score of hydrophobicity physico – chemical attribute of window size 5 achieves the best performance with average AUC of 0.669. Figure 9, shows the performance results of fivefold cross validation on DiscoTope dataset using propensity score of amino acid physico – chemical properties. Figure 10, shows the ROC curves generated from fivefold cross validation of the best model on the 5 antigen groups. This result showed that the propensity score of amino acid physico – chemical properties can be used to predict conformational B-cell epitopes from the antigen structure.
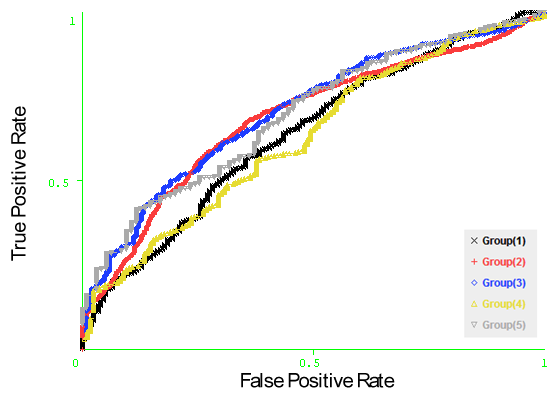 | Figure 10. The ROC curves generated from fivefold cross validation on DiscoTope dataset on the model (Logistic Regression classifier with the propensity score of hydrophobicity physico – chemical attribute). |
 | Figure 11. Comparing Structure and sequence based window for predicting conformation B-cell epitope. |
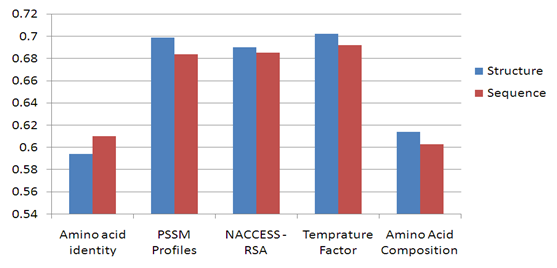
3.4. Comparing Sequence and Structure Based Approaches for Predicting Conformation B-Cell Epitope
- We compare the performance of using the structure based and sequence based approaches for predicting conformational B-cell epitopes. The comparative study is performed in the structure based dataset Discotope as we can easily extract the antigen sequences from the antigen structure whereas the opposite is difficult. The features of each residue are extracted from the antigen and windows of type sequence based and structure based are generated. Naïve Bayesian and Logistic Regression models have been developed using the sequence identity, PSSM profiles, RSA, temperature factor, and amino acid composition features represented by vectors of dimension Nx1, Nx20, Nx1, Nx1 and 20, respectively (N is the window size). The models are developed using structure and sequence windows of size 5 to 23 residues. Five-fold cross-validation technique is conducted on the five groups of antigen structures in the Discotope dataset; for each model the average area under receiver operator characteristics curve (AUC) of the five groups is computed. From Figure 11, it was observed that four feature representations achieve better performance in case of structure based windows were used. The best performance of average AUC value 0.702 is achieved using both classifiers with temperature factor feature of window size 7. Figure 12 shows the ROC curves generated from fivefold cross validation of the Naïve Bayesian classifier with temperature factor feature on the 5 antigen groups.
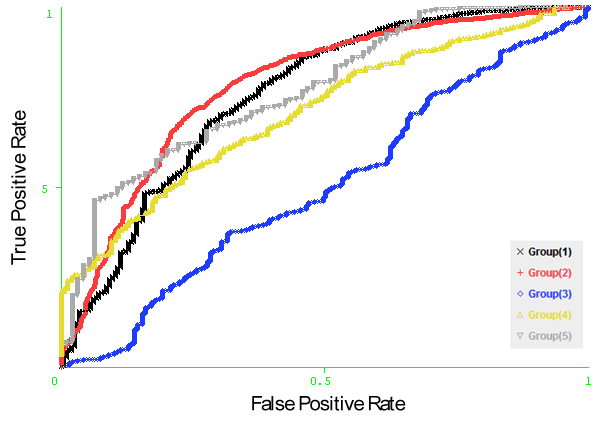 | Figure 12. The ROC curves generated from fivefold cross validation on DiscoTope dataset on the model (Naïve Bayesian classifier with temperature factor feature). |
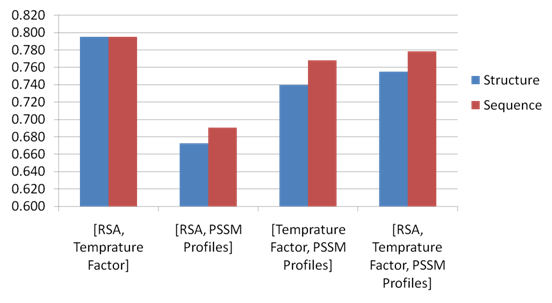 | Figure 13. Comparing the structure and sequence based approach using the composition of features. |
3.5. Determination of Optimal Model (CBCPRED) for Predicting Conformational B-Cell Epitope
- From this study, it is showed that the two structural features temperature factor and relative solvent accessibility can be used to identify conformational B-cell epitopes. Especially, the composition of these two features can significantly improve the prediction performance. Additionally, the propensity score of amino acid physico – chemical properties features achieved accepted performance in predicting conformational B-cell epitopes. In this section, we present experiments by combining the structural features and propensity score features as input to the machine learning models.
 | Figure 14. The ROC curves generated from fivefold cross validation on DiscoTope dataset on the model (Support vector machine based on RBF kernel with the structural features and propensity score of physico – chemical properties). |
3.6. Determination of Optimal Window Size
- In order to optimize the prediction performance of our new model CBCPRED, the optimal window size is determined by testing different structural window sizes (from 5 to 23) for the RBF kernel based support vector machine model based on the combined features. From Table 2, we can observe that that the best prediction performance was achieved at window size of 15.
|
3.7. Comparison with Existing Methods
- We compared our model with existing methods DiscoTope[3], PEPITO[24], and Liu R et al.[33] for predicting conformational B-cell epitope. We realized that these methods use Discotope dataset to evaluate their performance. We calculated the average AUC values for 75 antigens of our new model CBCPRED and compared it with the results of the three methods reported by R et al.[33]. The average AUC of our model, DiscoTope[3], PEPTO[24], and R et al.[33] are 0.859, 0.726, 0.754, and 0.818, respectively.
3.8. Independent Testing on Benchmark Database
- The Benchmark dataset prepared by Ponomarenko et al. 2007[37] is used as independent test set to evaluate “CBCPRED” conformational B-cell epitope prediction model. After removing the sequence redundancy, only 31 antigen structures are used in our test. The 75 antigen structures of the Discotope dataset are used to train our model. We predict the conformational B-cell epitope of the 31 antigen structures of the Benchmark dataset. We obtained an area under receiver operator characteristics curve (AUC) of 0.747. Figure 15 illustrates the ROC curve of CBCPRED model on benchmark dataset. Additionally, we used leave-one-out cross validation technique to evaluate CBCPRED performance on the 31 antigens of the independent test. We calculate the average AUC values of all 31 antigens structure obtaining 0.761.
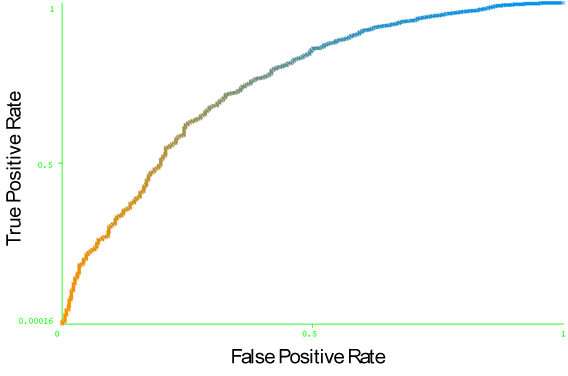 | Figure 15. The ROC curve of CBCPRED model tested on the 31 antigen structure of the Benchmark dataset. |
3.9. Prediction of Conformational B-Cell Epitope Residues in Antigen 1ORQ (PDB ID)
- We choose a complex with chain Id (C) in the antigen 1ORQ (PDB Id) from the benchmark dataset as an example to visualize the prediction results of epitope residues using CBCPRED model and compare it with the actual epitope residues determined in the benchmark epitope dataset as shown in Figure 16. The true positive, false positive and false negative values at specificity 95% are 7, 34, and 7, respectively.
 | Figure 16. Visualization of the prediction results for complex 1ORQ (PDB ID) chain Id: C; (a) shows the original epitope residues in the antigen chain; (b) shows the predicted epitope residues in the antigen chain. |
3.10. CBCPRED Implementation
- CBCPRED is a user friendly web server developed for predicting conformation B-cell epitope from a given antigen structure. The server is developed using Java Servlet and HTML. The user may submit the antigen structure by entering PDB antigen Id or uploading antigen structure file in a PDB format, also the user may enter the chain id and determine the specificity threshold score for epitope identification. In case of the user enters the PDB antigen id, the server downloads the PDB file from the protein data bank[44]. The server generates relative solvent accessibility using NACCESS[52], extracts the temperature factor from the given PDB file, and calculates the propensity scale of hydrophilicity, flexibility, and antigenicity for all residues in the requested chain. Then for each residue in the antigen chain, a structure window of 14 neighbouring residues is generated and a feature vector of dimension 5x15 is formulated and passed to the classifier. The epitope residue is identified if the prediction score is greater than the input specificity value. The prediction output is in a table view with all residues in the antigen chain (green rows are epitope residues) and 3D view using Jmol[57] an open-source Java viewer for chemical structures in 3D where the given structure is represented and the epitope residues are marked in green color. The web-server is freely available at http://www.fci.cu.edu.eg:8080/CBCPRED/predict.html.
4. Conclusions
- In this study, we showed several experiments for predicting conformational B-cell epitopes using different approaches. We evaluated the performance of predicting conformational epitope residues from the antigen sequences on sequence based dataset. Consequently, we proposed new methods for predicting the conformation B-cell epitopes from the antigen structure using graph centrality features. Finally, we conducted a comparative study between the sequence based and structure based approaches for predicting conformational B-cell epitopes.Additionally, we proposed a new model for predicting conformational B-cell epitopes based on support vector machine model and the composition of structural features and amino acid physico – chemical information. We showed that our model outperform other popular prediction methods in terms of average AUC value.
ACKNOWLEDGEMENTS
- It is a pleasure to thank Dr: Yasser EL-Manzalawy for his great support and help. He provided encouragement, sound advice, and lots of good ideas during the long useful discussions which made this work possible.Additionally, we thank the faculty of computers and information, Cairo University for publishing CBCPRED web server in its domain.
References
| [1] | Flower D. Bioinformatics for vaccinology. Wiley Black-well; 2009. |
| [2] | Ole Lund, Morten Nielsen, Claus Lundegaard, Can Kesmir and Søren Brunak. Immunological Bioinformatics. ISBN-10: 0-262-12280-4 ISBN-13: 978-0-262-12280-1, September 2005 |
| [3] | Andersen PH, Nielsen M, Lund O: Prediction of residues in discontinuous B-cell epitopes using protein 3D structures. Protein Science 2006, 15:2558-2567 |
| [4] | Van Regenmortel MH. Mapping epitope structure and activity: from one- dimensional prediction to four-dimensional description of antigenic specificity. Methods 1996;9:465-472 |
| [5] | Parker JM, Guo D, Hodges RS. New hydrophilicity scale derived from high-performance liquid chromatography peptide retention data: correlation of predicted surface residues with antigenicity and X-ray-derived accessible sites. Biochemistry. 1986 Sep 23; 25 |
| [6] | Karplus PA, Schulz GE. Prediction of Chain Flexibility in Proteins - A tool for the Selection of Peptide Antigens. Naturwissenschafren 1985; 72:212-3 |
| [7] | Emini EA, Hughes JV, Perlow DS, Boger J. Induction of hepatitis A virus-neutralizing antibody by a virus-specific synthetic peptide. J Virol. 1985 Sep;55(3):836-9 |
| [8] | J. Pellequer and E. Westhof. PREDITOP: a program for antigenicity prediction. J Mol Graph, 11:204–210, 1993 |
| [9] | A. Alix. Predictive estimation of protein linear epitopes by using the program PEOPLE. Vaccine, 18:311–4, 1999 |
| [10] | M. Odorico and J. Pellequer. BEPITOPE: predicting the location of continuous epitopes and patterns in proteins. J Mol Recognit, 16:20–22, 2003 |
| [11] | S. Saha and G. Raghava. BcePred: Prediction of continuous B-cell epitopes in antigenic sequences using physicochemical properties. Artificial Immune Systems, Third International Conference (ICARIS 2004), LNCS, 3239:197–204, 2004 |
| [12] | Jens Erik Pontoppidan Larsen, Ole Lund and Morten Nielsen. Improved method for predicting linear B-cell epitopes. Immunome Research 2006, 2:2doi:10.1186/1745-7580-2-2 |
| [13] | Saha S, Raghava G. Prediction of continuous B-cell epitopes in an antigen using recurrent neural network. Proteins. 2006;65:40–48. doi: 10.1002/prot.21078 |
| [14] | Söllner J, Mayer B. Machine learning approaches for prediction of linear B-cell epitopes on proteins. J. 2006;19:200–208. doi: 10.1002/jmr.771 |
| [15] | Chen J, Liu H, Yang J, Chou K. Prediction of linear B-cell epitopes using amino acid pair antigenicity scale. Amino Acids. 2007; 33:423–428. doi: 10.1007/s00726-006-0485-9 |
| [16] | Söllner J, Grohmann R, Rapberger R, Perco P, Lukas A, Mayer B, Blythe M. Analysis and prediction of protective continuous B-cell epitopes on pathogen proteins. Immunome Res. 2008;7:4 |
| [17] | EL-Manzalawy Y, Dobbs D, Honavar V. Predicting linear B-cell epitopes using string kernels. J. 2008;21:243–255. doi: 10.1002/jmr.893 |
| [18] | EL-Manzalawy Y, Dobbs D, Honavar V. Predicting flexible length linear B-cell epitopes. 7th International Conference on Computational Systems Bioinformatics. 2008. pp. 121–131 |
| [19] | EL-Manzalawy Y, Dobbs D, Honavar V. Predicting linear B-cell epitopes using evolutionary information. IEEE International, Conference on Bioinformatics and Biomedicine. 2008 |
| [20] | Sweredoski M, Baldi P. COBEpro: a novel system for predicting continuous B-cell epitopes. Protein Eng Des Sel. 2009;22(3):113–120. doi: 10.1093/protein/gzn075 |
| [21] | EL-Manzalawy, Yasser and Honavar, Vasant. Recent advances in B-cell epitope prediction methods. Immunome Research 2010, 6(Suppl2):S2doi:10.1186/1745-7580-6-S2-S2 |
| [22] | Hifzur Rahman Ansari and Gajendra PS Raghava: Identification of conformational B-cell Epitopes in an antigen from its primary sequence. Immunome Research 2010, 6:6doi:10.1186/1745-7580-6-6 |
| [23] | Kulkarni-Kale U, Bhosle S, Kolaskar A. CEP: a conformational epitope prediction server. Nucleic Acids Res. 2005;33:W168. doi: 10.1093/nar/gki460 |
| [24] | Sweredoski M, Baldi P. PEPITO: improved discontinuous B-cell epitope prediction using multiple distance thresholds and half sphere exposure. Bioinformatics. 2008; 24(12):1459–1460.doi: 10.1093/bioinformatics/btn199 |
| [25] | Hamelryck T. An amino acid has two sides: a new 2D measure provides a different view of solvent exposure. Proteins. 2005; 59:38–48. doi: 10.1002/prot.20379 |
| [26] | Ponomarenko J, Bui H, Li W, Fusseder N, Bourne P, Sette A, Peters B. ElliPro: a new structure-based tool for the prediction of antibody epitopes. BMC bioinformatics. 2008; 9:514. doi: 10.1186/1471-2105-9-514 |
| [27] | Thornton J, Edwards M, Taylor W, Barlow D. Location of ’continuous’ antigenic determinants in the protruding regions of proteins. The EMBO Journal. 1986;5(2):409–413 |
| [28] | Liang S, Zheng D, Zhang C, Zacharias M. Prediction of antigenic epitopes on protein surfaces by consensus scoring. BMC Bioinformatics. 2009;10: 302 |
| [29] | Liang S, Zhang C, Liu S, Zhou Y: Protein binding site prediction using an empirical scoring function. Nucleic Acids Res 2006, 34:3698-3707 |
| [30] | Jones S, Thornton JM: Prediction of protein-protein interaction sites using patch analysis. Journal of Molecular Biology 1997, 272:133-143 |
| [31] | Pellequer JL, Westhof E, Van Regenmortel MH: Correlation between the location of antigenic sites and the prediction of turns in proteins. ImmunolLett 1993, 36:83-99 |
| [32] | Liang S, Zheng D, Standley D, Yao B, Zacharias M, and Zhang, C. EPSVR and EPMeta: prediction of antigenic epitopes using support vector regression and multiple server results. BMC Bioinformatics 2010, 11:381. doi: 10.1186/1471-2105-11-381 |
| [33] | Liu R, Hu J (2011) Prediction of Discontinuous B-Cell Epitopes Using Logistic Regression and Structural Information. J Proteomics Bioinform 4: 010-015. doi:10.4172/jpb.1000161 |
| [34] | EL-Manzalawy Y, Honavar V. Epitopes Toolkit. 2009. http://ailab.cs.iastate.edu/epit/index.html |
| [35] | Adamczak, R., Porollo, A., Meller, J. Combining prediction of secondary structure and solvent accessibility in proteins. Proteins. 2005;59:467–475 |
| [36] | Vita R, Zarebski L, Greenbaum JA, Emami H, Hoof I, Salimi N, Damle R, Sette A, Peters B: The immune epitope database 2.0.Nucleic Acids Res 2010, 38:D854-862 |
| [37] | Ponomarenko JV, Bourne PE: Antibody-protein interactions: benchmark datasets and prediction tools evaluation. BMC Struct Biol 2007, 7:64 |
| [38] | Li W, Godzik A: Cd-hit: a fast program for clustering and comparing large sets of protein or nucleotide sequences. Bioinformatics 2006, 22:1658-1659 |
| [39] | Rubinstein ND, Mayrose I, Martz E, Pupko T: Epitopia: a web-server for predicting B-cell epitopes. BMC Bioinformatics 2009, 10:287 |
| [40] | http://en.wikipedia.org/wiki/Euclidean_distance |
| [41] | http://www.renabi.fr/article202.html |
| [42] | http://expasy.org/sprot/ |
| [43] | http://pir.georgetown.edu/ |
| [44] | Berman HM, Westbrook J, Feng Z, Gilliland G, Bhat TN, et al. (2000) The protein data bank. Nucleic Acids Res 28: 235-242 |
| [45] | http://www.ncbi.nlm.nih.gov/RefSeq/ |
| [46] | S. Altschul, T. Madden, A. Sch¨affer, J. Zhang, Z. Zhang, W. Miller, and D. Lipman. Gapped BLAST and PSIBLAST: a new generation of protein database search programs. Nucleic Acids Res, 25:3390–3402, 1997 |
| [47] | Giovanni Scardoni, Michele Petterlini, and Carlo Laudanna. Analyzing biological network parameters with CentiScaPe Bioinformatics (2009) 25(21): 2857-2859 first published online September 2, 2009 doi:10.1093/bioinformatics/btp517 |
| [48] | Fauchere, J.L. and Pliska, V. (1983). Hydrophobic parameters p of amino-acid side chains from the partitioning of N-acetyl-amino-acid amides European Journal of Medicinal Chemistry (Chim. Ther.), 18: 369-375 |
| [49] | Chou, P. Y. and Fasman, G. D. (2006) Prediction of the Secondary Structure of Proteins from their Amino Acid Sequence, in Advances in Enzymology and Related Areas of Molecular Biology, Volume 47 (ed A. Meister), John Wiley & Sons, Inc., Hoboken, NJ, USA. doi: 10.1002/9780470122921.ch2 |
| [50] | Kolaskar AS, Tongaonkar PC. A semi-empirical method for prediction of antigenic determinants on protein antigens. FEBS Lett. 1990 Dec 10;276(1-2):172-4 |
| [51] | Grantham R. Amino acid difference formula to help explain protein evolution. Science. 1974;185:862–864. doi: 10.1126/science.185.4154.862 |
| [52] | Hubbard, S.J. and Thornton, J.M. 1993. NACCESS computer program. Department of Biochemistry and Molecular Biology, University College of London, UK |
| [53] | Adamczak, R., Porollo, A., Meller, J. Combining prediction of secondary structure and solvent accessibility in proteins. Proteins. 2005;59:467–475 |
| [54] | Proteins: Structures and molecular properties: By T E Creighton. pp 515. W H Freeman, New York. 1983. £33.75 ISBN 0-7167-1566-X |
| [55] | Swets, J.A. 1988. Measuring the accuracy of diagnostic systems. Science 240: 1285–1293 |
| [56] | Mark Hall, Eibe Frank, Geoffrey Holmes, Bernhard Pfahringer, Peter Reutemann, Ian H. Witten (2009); The WEKA Data Mining Software: An Update; SIGKDD Explorations, Volume 11, Issue 1 |
| [57] | http://jmol.sourceforge.net/ |