-
Paper Information
- Next Paper
- Paper Submission
-
Journal Information
- About This Journal
- Editorial Board
- Current Issue
- Archive
- Author Guidelines
- Contact Us
American Journal of Bioinformatics Research
p-ISSN: 2167-6992 e-ISSN: 2167-6976
2011; 1(1): 1-5
doi: 10.5923/j.bioinformatics.20110101.01
Estimating Protein Functions Correlation Based on Overlapping Proteins and Cluster Interactions
 Abstract
 Reference
 Full-Text PDF
 Full-Text HTML
Khaled S. Ahmed
Biomedical Department, Modern University for Technology and Information, Cairo, Egypt
Correspondence to: Khaled S. Ahmed , Biomedical Department, Modern University for Technology and Information, Cairo, Egypt.
| Email: |  |
Copyright © 2012 Scientific & Academic Publishing. All Rights Reserved.
Usually, the relations between the protein functions do not be considered into protein function/interaction prediction processes. In this paper, we present a new technique for determining the relation between the protein functions. The strategy is based on the overlapping number of proteins furthermore interactions over protein clusters to determine the correlation between the sub-function categories as well as improve the protein function prediction process. The proposed method was applied to yeast proteome and the results revealed great improvement in increasing the degree of certainty and accuracy for protein function prediction.
Keywords: Protein Function, Correlation, Cluster Interaction
Cite this paper: Khaled S. Ahmed , "Estimating Protein Functions Correlation Based on Overlapping Proteins and Cluster Interactions", American Journal of Bioinformatics Research, Vol. 1 No. 1, 2011, pp. 1-5. doi: 10.5923/j.bioinformatics.20110101.01.
1. Introduction
- Protein is a fundamental component of all living cells, it consists of sequences of Amino Acids (AAs) and performs a variety of biological tasks as Control physicochemical conditions inside the cell or transmit biological signals. Usually proteins can bind to each other and interact so they work in complex system. Protein complex isolation and mapping protein-protein interactions is considered one of the most important problems in proteomics. The target of these processes is to understand the cell functions and to have basic idea about the relations between the proteins functions. A lot of methods have been developed to predict protein functions based on different information sources as protein sequences[1,2], protein structure[3,4], protein-protein interactions[5,6,7], protein domain [8], genetic interactions and gene expression analysis[9,10]. The accuracy of prediction can be enhanced by integrating multiple sources of information[11,12] or collecting relations between the known functions[13]. Also a new technique is used to enhance the protein function prediction process depending on the weights of interactions[14]. Recently, the researchers introduced different methods to determine the probability of protein function prediction using the information extracted from PPI. Although these techniques are promising, they lack the addressing of effective problems such as determining the relations between the protein functions. In this paper, we introduce an integrated algorithm based on the overlapping proteins[12,15] and interactions among different protein clusters. The interactions are regarding to the fact, the interacted proteins have common function (major function) (Brown et al. 2000; Eisen et al. 1998; Pavlidis et al. 2001). As known, protein may have more than one function (up to 8 functions in Yeast Saccharomyces cerevisiae ). Some of these functions may be correlated, anti correlated or independent. In this paper, an integrated technique will be introduced to determine the relations between protein functions. The technique is applied to the three function categories of yeast and integrated with protein function prediction method; neighborhood counting method and the results were better than without integration and the accuracy is increased compared to absolute techniques. The paper is organized as follows. The proposed algorithm is explained in section II. Section III presents the results of this work together with their discussion. Finally, the paper ends with a conclusion and future work.
2. Methodology
- Protein may be seed (self dependent) or participate in certain function or in-complex (temporary or permanent). If protein has certain function F1 and it has another function as F2 but it should not have function F3, so it can be said that functions (F1, F2) has specific relations and functions (F1, F3) are anti correlated. The proposed technique is to explore the relation between the protein functions based on the overlapping proteins and interactions over the protein clusters.A. Function Categories And Overlapping ProteinsAs mentioned before, protein may have one function or more. Regarding the yeast (Saccharomyces cerevisiae) studied species, it has three function categories: Cell location functions (C.L) (contains 29 sub-function category), Cellular role functions (C.R) (contains 43 sub-function category), and Bio-chemical functions (Bio-ch) (contains 57 sub-function category) as shown in Table-1. Yeast proteins defined in the Yeast Proteome Database. Each function category has certain number of proteins. And some of those proteins are involved in more than one sub-function category. Herein the overlapping number of proteins is calculated for each two different sub-function categories. And certain score is recorded related to the smaller number of proteins for the two categories. As shown in Table-1, the function category cellular role contains some sub-functions (up to 43 sub-functions) as: Amino-acid metabolism contains 218 proteins that means there are 218 proteins among yeast proteins have this function. As similar Carbohydrate metabolism function, there are 254 proteins having this function. Also the other function categories, cell location “Bud neck” contains 61 proteins and Biochemical “ATPase” contains 247 proteins. The target is to calculate the overlapping proteins between each two sub-function categories. The overlapping proteins mean that these proteins have the two sub-function categories. As mentioned in[12], the relations between the sub-functions are divided into direct and indirect relations depending on the suggested threshold value. The proposed technique tries to determine certain score for each sub-function pair. And integrate these scores with the extracted values of protein clusters interactions.
|
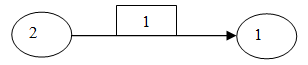 | Figure 1. The direct relations between the Biochemical sub-function category_2 towards the sub-function category_1. |
|
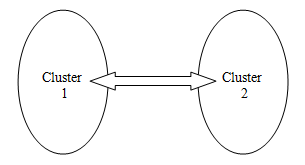 | Figure 2. Shows two interacted clusters |
|
|
3. Results
- The function relation technique has integrated with the traditional method of protein function prediction (neighbor counting method). Improved results have been gained than previous. As known in neighborhood method, it finds the neighbor proteins and gets their assigned functions and the frequencies of occurrence of these functions. Then, these functions are arranged in descending order according to their frequencies. The first k functions are considered and assigned to the un-annotated protein. The authors in[18] used this technique with k equals to 3. By applying the proposed technique on the yeast function categories, the results are as shown in Table-5 and Table-6. The algorithm shows the increasing number of true positive (TP) and decreasing the true negative (TN) and false positive (FP). Table-5 shows each yeast Biochemical function category and its results. Function category_1 has 247 proteins, 47 of them identified as TP and the rest (200) identified as TN and there are 141 proteins identified as FP. On the other hand function category_2 has 2 proteins as (TP), 29 proteins as (TN) and 15 proteins as (FP). Also function category_11 has 6 proteins as (TP), 17 proteins as (TN) and 10 proteins as (FP). It can be noted that the integrated algorithm enhanced (increased) the numbers of TP and decreased the numbers of TN and FP. As shown in Table-6 the integration between function_1 and Function_2 (positive overlapping and positive interactions) shows the same numbers of function_2 (least one). And integration between function_1 and function_11 has 6 proteins as (TP, the same number of function_11 true positive) and decreases the number of FP (141 & 10 à 7). The integration process has been divided into for cases regarding to the states of overlapping and interactions. The collected cases are 1)- Positive overlapping & positive interactions (the score of overlapping more than the threshold (0.85) and the number of interactions are more than 10% of the minimum number of proteins in one category), 2)- positive overlapping and negative interactions, 3)- negative overlapping and positive interactions, and 4)- negative overlapping and negative interactions. It can be noted that in case of (positive & positive), enhanced results has been gained specially in increasing the TP and decreasing the TN and FP. Although the number of TP is small relating to one function of them, it is very accurate and equal to the minimum number over the two functions. It is very clear that the numbers of TN and FP are decreased as in cases functions (1-21) which they have FP equal to 141 and 395 respectively and now it is 74.
| |||||||||||||||||||||||||||||||||||||||||||||||||||||||||||||||||||||||||||||||||||||||||||||||||||
4. Conclusions
- In this paper, an integrated technique is introduced to estimate the correlations or relations between yeast protein functions. The technique depended on the overlapping number of proteins as well as number of interactions over the protein clusters. By applying the proposed algorithm on the collected data, the results have been improved; reducing the number of true negative and false positive furthermore increasing the true positive results. The results were good when the two measures were positive. Although the number of interactions was important for enhancement the results but the overlapping number was more critical. In protein function prediction problem, the effect of the function correlations has been indicated and the results were better than the absolute method (neighbor counting method without function correlation). As future work, considering the relations between protein functions into the different statistical algorithms is very important step.
References
| [1] | D. Harrington, A. H. Singh, T. Doerks, I. Letunic, C. von Mering, and P. Bork, "Quantitative assessment of protein function prediction from metagenomics shotgun sequences," Proc Natl Acad Sci U S A, vol. 104, pp. 13913-8, Aug 28 2007 |
| [2] | R. V. Spriggs, Y. Murakami, and S. Jones, "Protein function annotation from sequence: prediction of residues interacting with RNA," Bioinformatics, vol. 25, pp. 1492-7, Jun 15 2009 |
| [3] | J. C. Whisstock and A. M. Lesk, "Prediction of protein function from protein sequence and structure," Q Rev Biophys, vol. 36, pp. 307-40, Aug 2003 |
| [4] | I. Friedberg, "Automated protein function prediction--the genomic challenge," Brief Bioinform, vol. 7, pp. 225-42, Sep 2006 |
| [5] | B. Schwikowski, and S. Fields, "A network of PPI in yeast," Nat Biotechnol, vol. 18, pp. 1257-61, Dec 2000 |
| [6] | H. Hishigaki, K. Nakai, T. Ono, and T. Takagi, "Assessment of prediction accuracy of protein function from protein--protein interaction data," Yeast, vol. 18, pp. 523-31, Apr 2001 |
| [7] | M. Deng, K. Zhang, S. Mehta, T. Chen, and F. Sun, "Prediction of protein function using protein-protein interaction data," J Comput Biol, vol. 10, pp. 947-60, 2003 |
| [8] | N. Nariai, E. D. Kolaczyk, and S. Kasif, "Probabilistic protein function prediction from heterogeneous genome-wide data," PLoS One, vol. 2, p. e337-344, 2007 |
| [9] | M. Zhao, and K. Aihara, "Gene function prediction using labeled and unlabeled data," BMC Bioinformatics, vol. 9, p. 57-71, 2008 |
| [10] | H. Zhao, Wu, B., " DNA-Protein Binding and gene expression patterns," Lecture Notes-Monograph Series, Statistics and Science: A Festschrift for Terry Speed, vol. 40, pp. 259-274, 2003 |
| [11] | Y. Liu, and H. Zhao, "Protein interaction predictions from diverse sources," Drug Discov Today, vol. 13, pp. 409-16, May 2008 |
| [12] | K. Sayed, N. Soloma, and Y. Kadah, "Estimation of the correlation between protein sub-function categories based on overlapping proteins," Proc. 27th NRSC, Menouf, Egypt, March 2010 |
| [13] | A. Wagner, " How the global structure of protein interaction networks evolves," Proc Biol Sci vol. 270, 2003 |
| [14] | K. Sayed, N. Soloma, and Y. Kadah "Improving the prediction of yeast protein function using weighted protein-protein interactions," Theoretical Biology and Medical Modelling, vol. 8, 2011. |
| [15] | K. Sayed, N. Soloma, and Y. Kadah "Determining The Relations Between Protein Sub-Function Categories Based On Overlapping Proteins," Journal of Communication and Computer, vol. 8, 2011 |