-
Paper Information
- Paper Submission
-
Journal Information
- About This Journal
- Editorial Board
- Current Issue
- Archive
- Author Guidelines
- Contact Us
International Journal of Astronomy
p-ISSN: 2169-8848 e-ISSN: 2169-8856
2021; 10(2): 23-42
doi:10.5923/j.astronomy.20211002.01
Received: Apr. 15, 2021; Accepted: May 12, 2021; Published: May 26, 2021

The Relationship Between Aerosol Optical Depth and Sunspots Count in Metro Manila
 Abstract
 Reference
 Full-Text PDF
 Full-text HTML
Miguel M. Artificio
Rizal Technological University, Graduate School, Mandaluyong City, Philippines
Correspondence to: Miguel M. Artificio, Rizal Technological University, Graduate School, Mandaluyong City, Philippines.
| Email: |  |
Copyright © 2021 The Author(s). Published by Scientific & Academic Publishing.
This work is licensed under the Creative Commons Attribution International License (CC BY).
http://creativecommons.org/licenses/by/4.0/

The researcher wants to determine if there is a relationship between the aerosol optical depth over the Philippines and the sunspots count over an 8-year period. The purpose of this study is to determine if there is a correlation between sunspots count and aerosol optical depth. The research is limited to cover an 8-year period because the availability of data from the AERONET starts only from 2009 to 2016. The researcher used three wavelengths of AOD for this study which are 320nm, 500nm and 1020nm, to see if there is an effect on each wavelength of aerosol to the sunspot number. Based on the result of the statistical treatment for AOD 1020, 500 and 340, and sunspots count, there is an inverse relationship or negative relationship between the sunspots count and aerosol optical depth.
Keywords: Aerosols, Aerosol Optical Depth, Sunspots, Metro Manila
Cite this paper: Miguel M. Artificio, The Relationship Between Aerosol Optical Depth and Sunspots Count in Metro Manila, International Journal of Astronomy, Vol. 10 No. 2, 2021, pp. 23-42. doi: 10.5923/j.astronomy.20211002.01.
Article Outline
1. Introduction
- In 1848, Rudolf Wolf came up with the sunspot number (Wolf Number, or Zürich number) which is a method of quantifying number of sunspots and groups of sunspots present on the surface of the sun (Jackson, 2012, p. 57). This number has been collected and tabulated by researchers for over 150 years. Samuel Heinrich Schwabe a German astronomer, found that sunspot activity is cyclical and reaches its maximum around every 9.5 to 11 years, it was he who first noticed this cycle back in 1843 (Daniels, 2009, p. 56). Sunspot Index and Long-term Solar Observations (SILSO) is an international network of Solar Observers which is concentrated on Europe. They use visual observations to gather the observed sunspots count and they translate that count into the Wolf Number or the Sunspot Number and store it in their database which they offer free to download by anyone who wishes to use the data, as long as they will be cited in the research. For over a million of years the change in solar intensity is a critical factor influencing climate (e.g., ice ages). However, changes in the solar heating rate over the last century cannot account for the magnitude and distribution of the rise in global mean temperature during that time period and there is no convincing evidence for significant indirect influences on our climate due to twentieth century changes in solar output (Hameed & Lee, 2005). Aerosols are a suspension of fine solid particles or liquid droplets in a gas. Examples are clouds, and air pollution such as smog and smoke. By studying this, we can determine its effects on the climate of the region (Kaufman, Tanre, & Boucher. 2002). Aerosol Optical Depth (AOD) is the measure of aerosols (e.g., urban haze, smoke particles, desert dust, sea salt) distributed within a column of air from the instrument (earth's surface) to the top of the atmosphere.AERONET offers aerosol optical depth data using their Sun photometer which allows computation of the AOD that are computed for three data quality levels; Level 1.0 which is unscreened data or at its rawest form, Level 1.5 which is cloud-screened data, and Level 2.0 which is cloud-screened and quality-assured.The Sun photometer allows AERONET to retrieve AOD using appropriate filters at wavelengths 340, 380, 440, 500,675, 870, and 1020 (Tan, Lim, Abdullah, & Holben). The researcher used the level 2.0 data because it is cloud-screened which means that AERONET has ran the raw data through its algorithms by eliminating unnecessary variables that would otherwise render the raw data useless and quality assured by the data scientist to further clean up the cloud screened data (Smirnov, Holben, Eck, & Slutsker, 2000).The researcher wants to determine if there is a relationship between aerosol optical depth over the Philippines and the sunspots count over an 8-year period.
2. Conceptual Framework
- The inspiration for conceptualizing this research is the sun itself. Solar activity like sunspots are strong magnetic field planet sized anomalies located in the surface of the sun, this anomaly could have an effect of the aerosol optical depth over Manila.
2.1. Effects of Solar Activity to Aerosols
- For years, scientists believe that the sun’s influence poses dire effects here on earth. On February 16, 1984, there was a recorded increase in the stratospheric aerosol concentration the in-Kola Peninsula, Verhnetulomski observatory (68.6 N, 31.8 E). When they have recorded this, they noticed that at the same time, there was also a recorded SPE or Solar Proton Event. They have recorded that there was an increase of 50% to the stratospheric aerosols that day. The increase in aerosol cause Type-1 PSC or Polar Stratospheric Clouds during that time frame (Shumilov, Kasatkina, Henriksen & Vashenyuk 1996). We have to take note that more solar proton events occur during solar maximum because of the increased solar activity (Smart and Shea, 1989). In the Northern Hemisphere, in the years of 1430 to 1850, there was an event called “The Little Ice Age”. In order to explain this phenomenon, scientists have used data from the European Solar Data. Based on the data that they have seen, this little ice age was probably caused by the variations in the Solar Cycle (Robock, 1979).A study conducted in 2013 aimed to identify if the Sunspot number had any relationship with the land surface temperature in the Philippines. The researcher acquired his Sunspot number data from NOAA or National Oceanic and Atmospheric Administration and the LST from PAGASA from different weather stations here in the Philippines. The time frame of this study was from 1980 to 2010. Based on the findings of this research, during the driest seasons, there were stations like the NAIA weather station located in Pasay City where there was a low positive correlation of 0.31 as shown in the figure below, but other stations there were negligible positive correlations (Lequiron, 2013).
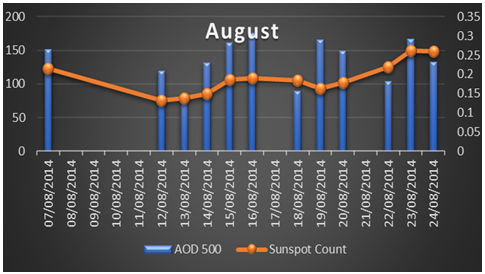 | Figure 1. August 2014, Aerosol Optical Thickness and Sunspot Number shows a low positive relation. This graph shows that the month of August. It has the best correlation value of all the Months that was observed. Its Correlation value was 0.3265 which indicates a weak uphill positive relationship (Artificio & Divinagracia 2015) |
2.2. Effects of Aerosol Optical Depth to Earth
- Aerosols are tiny particles in solid or liquid phase suspended in the atmosphere. They can be naturally occurring from volcanoes, windblown dust, dust storms, forest and grassland fires, living vegetation and sea spray or anthropogenic, generated from the burning of fossil fuels. These particles are called particulate matter. These can be categorized according to their shape, size, and composition; which can be classified as ultrafine particles PM0.1, fine particles PM2.5, or coarse particles PM10 (Guido & Artificio 2016).Aerosols affects the solar radiation budget in two ways; first is by directly scattering and absorbing solar radiation also known as the direct radiative forcing, and secondly by acting as cloud condensation nuclei thereby influencing the optical properties and lifetime of clouds (this is known as the indirect radiative forcing). Aerosols tend to cool the earth’s surface directly beneath them. As most aerosols reflect sunlight back into space, they have a “direct” cooling effect by reducing the amount of solar radiation reaching the earth’s surface (Nasurt, 2011).Natural sources include primary emissions of desert dust, sea-salt, and wildfire aerosol along with aerosol precursors such as sulfur- and carbon-containing gases from vegetation, ocean biology, and volcanoes that can subsequently form particles in the atmosphere (Rap, Scott, Spracklen, Bellouin, Forster, Carslaw, Schmidt & Mann, 2013). In 1991, the infamous Mount Pinatubo erupted and spewed over 17 megatons of sulfur dioxide into the atmosphere. The aerosol cloud spread rapidly around the earth in about 3 weeks and attained global coverage by about 1 year after the eruption. Peak local midvisible optical depths of up to 0.4 were measured in late 1992, and globally averaged values were about 0.1 to 0.15 for 2 years. This event showed the world that naturally occuring aerosols can infact severely affect the air quality of the earth (Self, Zhao, Holasek, King, & Torres, 1999).Aerosols play an important role in the earth’s radiative balance and in the global climate, since they influence the radiation balance through two key processes: directly, by scattering and absorbing solar radiation, and indirectly, by acting as CCN and thus dramatically affecting the optical properties of clouds (Guido & Artificio 2016). There is a direct radiative effect at the top of atmosphere shortwave aerosols, but it depends on aerosol properties and the underlying surface albed. The two effects are the: • positive (warming effects) where soot or black smoke warms the surface of the Earth by trapping the radiations of the Sun.• negative (cooling effect) where Cooling aerosols include dust, sulfate particles and sea spray by reflecting back the solar radiation.When incoming solar radiation becomes absorbed, the aerosols such as soot can both warm the atmosphere and cool the surface, whereas highly scattering type aerosols (e.g. sulfates) can cool the earth’s surface by reflecting more solar insolation and thereby increasing the planetary albedo (Eck, Holben, Slutsker, & Setzer, 1988).The effects of aerosol optical depth over the Metropolitan Cities of India varies, he said that “sometimes it influences the precipitation and sometimes it obstructs the precipitation”, which means that sometimes it causes rain, sometimes it prevents it. He said that the impacts of AOD over meteoroligical parameters must be studied in further detail since the effects of it over cities are very complex (Gunaseelan, 2014).A study about the relationship of AOD with Particulate Matter said that there is a significant relationship between the AOD and PM 2.5 over Singapore, they were able to get an r-value of .47 which is a low postive relationship value (Chew, Campbell, Hyer, & Liew, 2016). Particulate matter effects in the environment according to an article published at Princeton.edu are being changes in visibility, acid deposition or acid rain which is composed of sulfuric and nitric acid which are corrosive elements, and ozone emitted by the combustion of fossil fuels (Bhattacharjee, Hartlez, Moss, Ryder, & Taylor, 1998).A study in 2016 talked about the possible impacts of air quality in the Philippines. Air pollution has dire effects on the health of the population from short term effects like coughing and allergies to long term effects like cancer. It also affects the climate and atmospheric conditions for instance, particle pollutants affect climate directly by absorbing sunlight, thus heating the surface atmosphere. Examples of this are soot or black carbon. This particulate matter absorbs the heat coming from the sun and trapping it inside the earth. This in turn would contribute to rise of temperature in the earth’s surface. It also has bad effects on agriculture and water quality, bad air quality could decrease the yield of crops and even kill it, while water quality will worsen when the particulate matter encorporates with the water adding dangerous water contaminants (Palma, 2016).Roy (2007) studied the temperature dependence of Aerosol Optical Depth on seasonal temperatures in India. He concluded that “The AOD–temperature relationship was predominantly negative, meaning that higher AOD concentrations resulted in lower temperatures for both seasons over northeastern India and the west coast, in the vicinity of Mumbai.”. Also, a study in 2001 by Sheehan and Bowman in Nashville, Tenessee showed that higher temperatures in during the day reduced the aerosol concentrations by 16-24% in the atmosphere, while when it became cooler, the aerosol concentrations increased by 22-34%.This research determined there is correlation between the sunspots count and the aerosol optical depth. This was done by accessing the data from SILSO and NASA-AERONET. The researcher used the IBM-SPSS Version 23 software to perform the necessary computations to get the correlation value.
2.3. Objectives of the Study
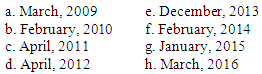
- The purpose of this study is to determine if there is a correlation between sunspots count and aerosol optical depth.Specifically, it sought to answer the following research questions:1. What months have the highest sunspots count and aerosol optical depth in Metro Manila?2. What is the correlation between Sunspots Count and aerosol optical depth in terms of the following.2.1. SSC and AOD 1020 nm2.2. SSC and AOD 500 nm2.3. SSC and AOD 340 nm3. What are the atmospheric and environmental effects of Sunspots Count and aerosol optical depth in Metro Manila?4. What are the implications that can be drawn based on the results of the study?
3. Research Methodology
- For this study, the correlational research design was used. Since the researcher utilized data from sources like NASA and SILSO, this design will be the most fitting for this study. The researcher has two main variables, the sunspots count and the aerosol optical depth. Under the AOD, the researcher used three (3) wavelengths to correlate it to the sunspots count. Once the data has been compiled, it will be tested with the proper statistical treatment in order for the researcher to answer the objective questions.
3.1. Research Instrument
- The researcher downloaded from the online data archives of SILSO for the sunspots count and the NASA AERONET for the aerosol optical depth.The researcher made use of the software Microsoft Excel. This was used to convert the LEV20 file of the aerosol optical depth in to an excel file and then it will be used to tabulate aerosol optical depth with the sunspots count to segregate each data into their corresponding days, months, years and the wavelength.The researcher made use of the IBM-SPSS version 23 statistics software to find out the relationship between sunspots count and AOD.
3.2. Data Gathering Procedures
- The data necessary for this research are readily available in the website of AERONET and SILSO. All they ask in return for free access to their data is proper citation. The researcher will gain access to the website of SILSO, and locate the sunspots count data archive. From there, the researcher can select the proper time frame necessary for the research and click download.To gain access to the aerosol optical depth data, the researcher went to the AERONET website. From there, the researcher selected the years on which AOD data is available. It must be noted that the AERONET program began in 2009, so there is no data available before 2009. The researcher selected the Level 2.0 (cloud-screened and quality checked) data to download.
3.3. Statistical Treatment of Data
- The researcher used Pearson R Correlation and the T-Test for this study. To compute for this, the researcher used the IBM SPSS version 23.a. Pearson Correlation
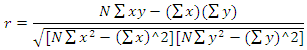 Where:
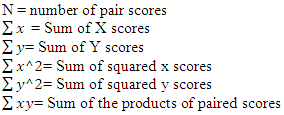 b. T-Test for test of significance
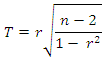 T = T-ValueR = Pearson R ValueN = Number of samples
4. Analysis
4.1. The Months with the Highest Sunspots Count and Aerosol Optical Depth in Metro Manila
- The researcher was able to download and tabulate sunspots count and AOD data. For this part of the study, the researcher determined the months with the highest sunspots count and AOD for each year by carefully examining and comparing all of the months with data available per year.
4.2. The Relationship Between Sunspots Count and Aerosol Optical Depth
- AOD data from AERONET database
4.2.1. Sunspots Count and AOD at All Wavelengths
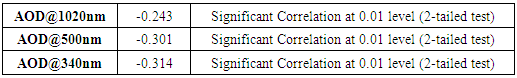
- Based on the result of the statistical treatment for AOD 1020 and sunspots count, there is a very weak relationship between the two variables with an r-value of -0.243. Test of significance at two tails was done and according to the results, p-value = 0.000 which is less than 0.01 level, which means that the test has significant results. This indicates that when the sunspot number detected on the sun’s surface rises, the AOD detected in the earth’s atmosphere falls and when the sunspots count falls, the AOD rises. This result tells us that the sunspot count and AOD 1020 are inversely proportional.Based on the result of the computation for AOD 500 and sunspots count, there is a low negative relationship value between the two variables with an r-value of -0.314. Test of significance at two tails was done and according to the results, p-value = 0.000 which is less than 0.01 level, which means that the test has significant results. This indicates that when the sunspot number detected on the sun’s surface rises, the AOD detected in the earth’s atmosphere falls and when the sunspots count falls, the AOD rises. This result tells us that the sunspots count and AOD 340 are inversely proportional.Based on the result of the computation for AOD 340 and sunspots count, there is a low negative relationship value between the two variables with an r-value of -0.314. Test of significance at two tails was done and according to the results, p-value = 0.000 which is less than 0.01 level, which means that the test has significant results. This indicates that when the sunspot number detected on the sun’s surface rises, the AOD detected in the earth’s atmosphere falls and when the sunspots count falls, the AOD rises. This result tells us that the sunspots count and AOD 340 are inversely proportional.Statistical Correlation Results
|
4.3. Effects of Sunspots Count and Aerosol Optical Depth in Metro Manila
- Based on the findings between the relationship of Sunspots Count and Aerosol Optical Depth (AOD), they are negatively correlated. According to the results, when the number of sunspots present on the sun’s surface goes up, the AOD goes down, and when the sunspots count goes down, the AOD goes up.Other studies related to this suggest that the effects of the aerosol optical depth over the metropolitan cities varies. Sometimes they influence the precipitation and sometimes they obstruct the precipitation (Gunaseelan, 2014), which means that AOD sometimes causes rain, sometimes it prevents it. Particulate matter effects in the environment according to an article by Princeton.edu are changes in visibility, acid deposition or acid rain which is composed of sulfuric and nitric acid which are corrosive elements, and ozone emitted by the combustion of fossil fuels (Bhattacharjee, Hartlez, Moss, Ryder, & Taylor, 1998). According to the world pollution index of 2016, the Philippines ranked number 7 in Asia with the highest pollution index with a value of 93.7 which rose from the observed 92.51 that was recorded at the start of the year, but a great improvement from the recorded 94.75 pollution index in 2015. This value signifies that the pollution level is in moderate level, concerns here being that people who are sensitive to air pollution will definitely be affected by this. From the data that the researcher was able to gather, 2016 has the highest values of AOD to be recorded with the highest value being 4.28 for the month of June. This time of month recorded a very low number of sunspots with only a total of 577 sunspots were detected. At this time, tropical typhoon “Ambo” was passing just above the NCR region from June 26 to June 28, this event could have left a lot of clouds over the AERONET instrument on June 30, 2016, it might have affected its observations. It is also possible that this is instrument error. For comparison, the Philippines was ranked 17 in Asia with the highest pollution index with a value of 92.5, and in the month of February 2016, the highest recorded AOD was only 1.68 and the total number of sunspots that were detected was relatively high at 1370.
4.4. Implications of the Results of This Study
- Based on the results of this study, it seems that the solar minimum has affected the number of AOD in Metro Manila. The figures below, shows that when the sunspots count rises, the AOD value falls and when the Sunspot number falls, the AOD value rises. Implications of the results here could mean that we will see a rise of AOD in the coming years as we are now in the sunspot solar minimum. A rise in particulate matter will definitely have an effect on the health sector, climate change, water quality and visibility here in Metro Manila.
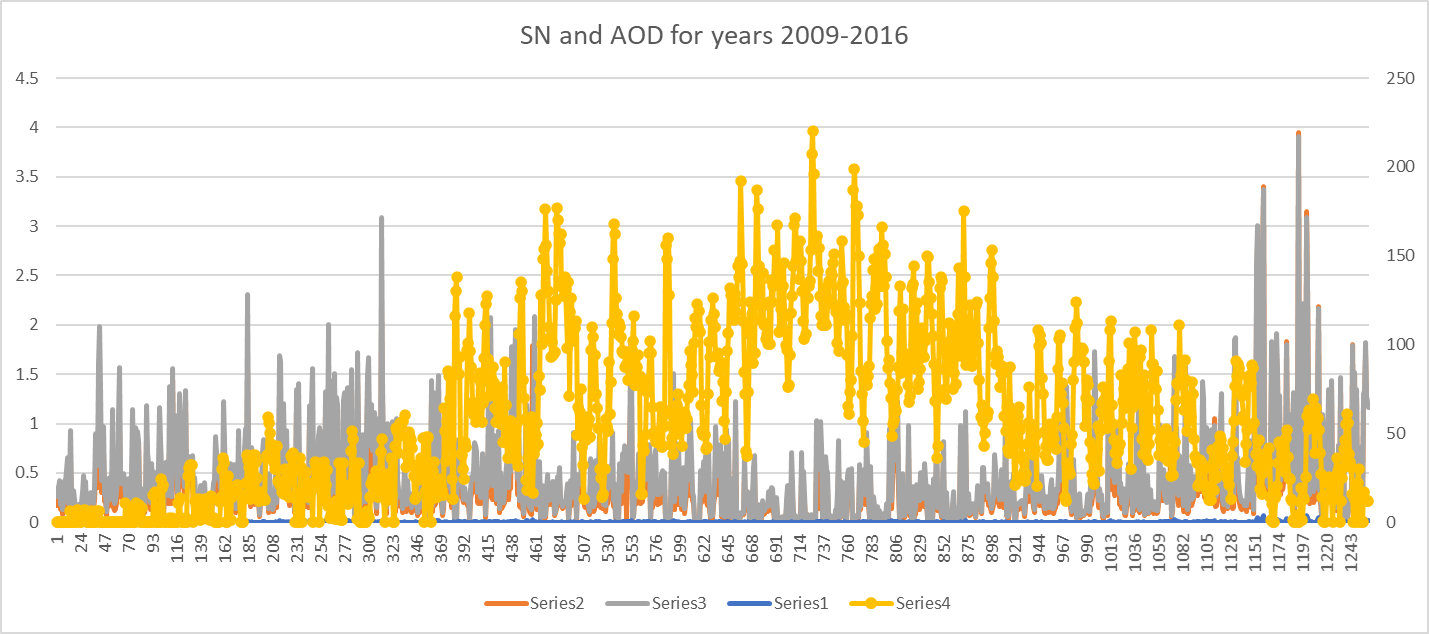 | Figure 2. Sunspots Count and AOD for the years 2009-2016. At the beginning of the graph, the sunspots count (represented by the yellow line) starts at low levels while the AOD (represented by grey, blue and orange line) is has high levels, but as the years go on, it rises, and when it does, the AOD levels drops |
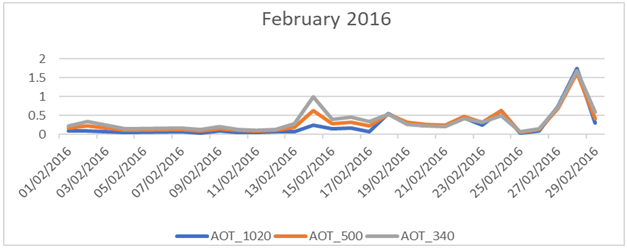 | Figure 3. AOD Levels for February 2016. With the low number of sunspots present during that time of month, a rise in AOD was observed. This could have caused Metro Manila to have a moderate pollution index for the mid-2016 |
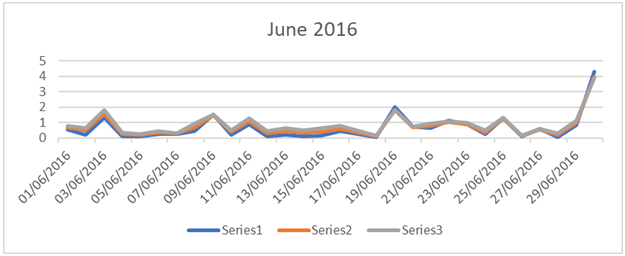 | Figure 4. AOD Levels for June 2016. With the high number of sunspots present during that time of month, the observed AOD was relatively low compared to the gathered data from the month of June 2016 |
5. Conclusions
- The conclusions of the researcher are based on the findings and results from the analysis of data.1. There is a significant inverse relationship between the sunspots count and the aerosol optical depth at 1020 nm, 500 nm, and 340 nm wavelength. This means that sunspots count and aerosol optical depth at 1020 nm, 500 nm, and 340 nm is inversely proportional with one another. 2. There are other factors that contributes to the increase and decrease of aerosol optical depth and must be studied further.3. If the aerosol optical depth that contribute to the decline of air quality rises, then it could severely affect the health sector, climate change, water quality, and visibility here in Metro Manila (Palma, 2016).4. The Philippines is still in the moderate level of air quality which is a lot better compared to other neighboring Asian countries. But as the results of the statistics suggest, AOD levels could rise as the sun is now in the solar minimum phase.
ACKNOWLEDGEMENTS
- The researcher would like to convey his profound gratitude and sincerest appreciation to the following persons who have contributed and extended their unselfish assistance and support in the completion of this research:The panel members of the Oral Défense Committee, Dr. Jesus Rodrigo F. Torres, Mr. Ryan Manuel D. Guido, Mr. Angelito D. Sing and Dr. Edna C. Aquino, for their constructive criticisms, viable suggestions and recommendations for the refinement of this work;Dr. Ruby-Ann B. Dela Cruz, adviser, for sharing her expertise and professional guidance, generosity, understanding, encouragement, assistance and unequalled support which greatly improved this study;Dr. Mylene Cayetano, for teaching the researcher her knowledge and expertise in Aerosol Science;The RTU-Graduate School staff, for lending incredible support to the researcher during the defense period;The Manila Observatory, Aerosol Robotic Network (AERONET) team, for providing for free the Aerosol Optical Depth data that were used for this research;The Sunspot Index and Long-term Solar Observations (SILSO-SIDC), for providing the Sunspots count data for free that was used for this research.
References
| [1] | A. Books Daniels, P. (2009). The New Solar System. Washington D.C.: National Geographic Society. |
| [2] | Jackson T. (2012). The Universe, An Illustrated History of Astronomy. United Kingdom: Word Press LtD. |
| [3] | Ridpath, I. (2012). Oxford Dictionary of Astronmomy. New York, Oxford University Press. |
| [4] | Seeds, M.A. (2005). Foundations of Astronomy Eight Edition. Canada, Thomson Brooks/Cole |
| [5] | Scheider, H. (2009). Backyard Guide to the Night Sky. Washington D.C., National Geographic Society. |
| [6] | Artificio, M., Cayetano, M., & Deocaris, C. (2012). Using data retrievals from CALIPSO and AERONET: Case study of aerosol optical thickness over the Philippines and the East Asian region. |
| [7] | Artificio, M., & Divinagracia, P. (2015). Correlation between Sunspot Number Count and Aerosol Optical Thickness in the Philippines for the Year 2014. |
| [8] | Guido, R.M., & Artificio, M. (2016). Aerosol Optical Thickness and Water Vapor in the Atmosphere of Metro Manila. |
| [9] | Gabuya, A. (2014). The Relationship of Smoothed Sunspot Number and Land Falling Tropical Cyclone. |
| [10] | Lequiron, J. (2013). The Relationship of Smoothed Sunspot Number and Land Surface Temperature in the Philippines. |
| [11] | Aerosol Robotic Network (AERONET). Retrieved from https://aeronet.gsfc.nasa.gov/ Air Pollution in Ghana. Retrieved from: http://tunza.eco-generation.org/ambassadorReportView.jsp?viewID=13204. |
| [12] | Bhattacharjee, H., Hartlez, Z., Moss, J., Ryder, S., & Taylor, C. (1998). Particulate Matter in New Jersey. doi: 0.1289/ehp.1103540 Biomass Burning Information. Retrieved from: http://www.tau.ac.il/~colin/research/Fires/biomass.html. |
| [13] | Chew, N., Campbell, J., Hyer, E., Liew, S. (2016). Relationship between Aerosol Optical Depth and Particulate Matter over Singapore: Effects of Aerosol Vertical Distributions. doi: 10.4209/aaqr.2015.07.0457. |
| [14] | Coal Burning Causes the Most Air Pollution Deaths in China. Retrieved from: https://www.nytimes.com/2016/08/18/world/asia/china-coal-health-smog-pollution.html. |
| [15] | Cornelis, D & Usoskin, I. (2006). On possible drivers of Sun-induced climate Changes. doi: 10.1016/j.jastp.2006.05.019. |
| [16] | Eck, T., Holben, B., Slutsker, L., & Setzer, A., (1988). Measurements of Irradiance Attenuation and Estimation of Aerosol Single Scattering Albedo for Biomass Burning Aerosols in Amazonia. Doi: 10.1029/98JD00399. |
| [17] | Factories in Lebanon. Retrieved from: https://www.yelleb.com/category/Factories. |
| [18] | Gunaseelan, I. (2014). The effect of aerosol optical depth on rainfall with reference to meteorology over metro cities in India. doi: 10.1007/s11356-014-2711-4. |
| [19] | Harrison, G, & Stephenson, D. (2006). Empirical evidence for a nonlinear effect of galactic cosmic rays on clouds. doi: 10.1098/rspa.2005.1628. |
| [20] | Kaufman, Y., Tanre, D., Boucher, O. (2002). A satellite view of aerosols in the climate system. Doi: 10.1038/nature01091. |
| [21] | Lean, J., Rind, D. (1998). Climate Forcing by Changing Solar Radiation. doi: 10.1175/1520-0442. |
| [22] | Liu, J. & Li, Z. (2014). Estimation of Cloud Condensation Nuclei Concentration from Aerosol Optical Quantities: Influential Factors and Uncertainties. Doi: 10.5194/acp-14-471-2014. |
| [23] | Hameed, S., Lee, J.N. (2005). A mechanism for sun-climate connection. doi:10.1029/2005GL024393. |
| [24] | Nasurt, T. (2011). Atmospheric Aerosol Optical Properties and Climate Change in Aridand Semi-Arid Regions. doi: 10.5772/24842. |
| [25] | Palma, R.A. (2016). Air Quality in the Philippines (2008-2015). Retrieved from https://www.slideshare.net/EnPRageneAndreaPalma/air-quality-in-the-philippines-20082015. |
| [26] | Pollution index of the World for the year 2015 table. Retrieved from: https://www.numbeo.com/pollution/rankings.jsp. |
| [27] | Pollution Index in Asia for the year of 2015 and 2016 table. Retrieved from: https://www.numbeo.com/pollution/region_rankings.jsp?title=2015®ion=14. |
| [28] | Pollution - The Greatest Disaster of Lebanon. Retrieved from: http://gobiidae.com/PN/pollutionprobinleb.htm. |
| [29] | Rap, A. Scott, C., Spracklen, D., Belloiun, N., Forster, P., Carslaw, K., Schmidt, A., Mann, G. (2013). Natural aerosol direct and indirect radiative effects. doi:10.1002/grl.50441. |
| [30] | Robock, A. (1979). The "Little Ice Age": Northern Hemisphere Average Observations and Model Calculations. doi: 10.1126/science.206.4425.1402. |
| [31] | Roy, S. (2007). Impact of aerosol optical depth on seasonal temperatures in India: aspatio-temporal analysis. doi: 10.1080/01431160701352121. |
| [32] | Smirnov, B. N. Holben,T. F. Eck, O. Dubovik, I. Slutsker (2000). Cloud-Screening and Quality Control Algorithms for the AERONET Database. doi: 10.1016/S0034-4257. |
| [33] | Self, S. Zhao, J., Holasek, R., Torres, R., King, A. (1999). The Atmospheric Impact of the 1991 Mount Pinatubo Eruption. Doi: 10.1029/2002. |
| [34] | Sheehan, P. Bowman, F. (2001). Estimated Effects of Temperature on Secondary Organic Aerosol Concentrations. doi: 10.1021/es001547g. |
| [35] | Shumilov I., Kasatkina, A., Henriksen, E, Vashenyuk, V. (1996). Enhancement of stratospheric aerosols after solar proton event. doi: 10.1007/s00585-996-1119-y. |
| [36] | Smart, F. & Shea, A. (1989). Solar Proton Events During the Past Three Solar Cycles. doi: 10.2514/3.26086. |
| [37] | Sunspot Index and Long-Term Observations (SILSO). Retrieved from: http://www.sidc.be/silso/. |
| [38] | Oklahoma State University Module R13, Experimental Research Design: Retrieved from http://www.okstate.edu/ag/agedcm4h/academic/aged5980a/5980/newpage2.htm. |
| [39] | Tan, F. Lim, H.S. Abdullah1, K. Holben, B. (2015), Estimation of aerosol optical depth at different wavelengths by multiple regression method. DOI 10.1007/s11356-015-5506-3. |