-
Paper Information
- Paper Submission
-
Journal Information
- About This Journal
- Editorial Board
- Current Issue
- Archive
- Author Guidelines
- Contact Us
International Journal of Astronomy
p-ISSN: 2169-8848 e-ISSN: 2169-8856
2019; 8(1): 1-7
doi:10.5923/j.astronomy.20190801.01

Characterizing Coronal Mass Ejections in Solar Cycle Analysis
 Abstract
 Reference
 Full-Text PDF
 Full-text HTML
Ryan Manuel D. Guido, Jason B. Kalaw
Department of Earth and Space Sciences, Rizal Technological University, Mandaluyong City, Philippines
Correspondence to: Ryan Manuel D. Guido, Department of Earth and Space Sciences, Rizal Technological University, Mandaluyong City, Philippines.
| Email: |  |
Copyright © 2019 The Author(s). Published by Scientific & Academic Publishing.
This work is licensed under the Creative Commons Attribution International License (CC BY).
http://creativecommons.org/licenses/by/4.0/

The Sun is the major source of heat and light in our solar system. Solar activity is associated with several factors including radio flux, solar irradiance, magnetic field, solar flares, coronal mass ejections (CMEs), and solar cycles. This study is unique as it determines the Sun’s activity specifically for the coronal mass ejection, its trend during solar cycle 23 and gives significance to the statistical nature in the form of normality of the emissions of the coronal mass ejections. The data were gathered from the different solar databases to obtain accurate results of the data. A time series analysis was used to measure the CME data for larger cases and to see the apparent difference and trends of the CMEs. This study analyzed the coronal mass ejections in the solar cycle 23 analysis.
Keywords: Solar Cycle Analysis, Coronal Mass Ejections, Solar Activity, Geomagnetic Storms, Solar Physics
Cite this paper: Ryan Manuel D. Guido, Jason B. Kalaw, Characterizing Coronal Mass Ejections in Solar Cycle Analysis, International Journal of Astronomy, Vol. 8 No. 1, 2019, pp. 1-7. doi: 10.5923/j.astronomy.20190801.01.
Article Outline
1. Introduction
- The Sun is the major source of heat and light in our solar system. The solar cycle (SC) is an 11-year cycle of solar activity that can be determined by the rise and fall in the numbers and surface area of sunspots. Solar activity is associated with several factors including radio flux, solar irradiance, magnetic field, solar flares, coronal mass ejections, and solar cycles.This study determines the Sun’s activity specifically for the coronal mass ejection, its trend during solar cycle 23, and the apparent differences of the normality of the emissions. This is a unique study as it unveils and gives significance to the statistical nature in the form of normality of the coronal mass ejections.
2. Solar Activity
- A study revealed several key features of the solar cycle such that; the solar cycle has a period of about 11 years but varies in length with a standard deviation of about 14 months [1]. He also pointed out that each cycle appears as an outburst of activity that overlaps about 18 months when measured by the occurrence of sunspots but reaches to years when measured by ephemeral regions, torsional oscillations, and coronal emissions and that predicting the level of solar activity for the remainder of a cycle is reliable 2-3 years after cycle minimum.Sunspots originate in diverse shapes and sizes, and the sunspot size depends on the solar cycle phase, such that bigger spots frequently expose near the maximum of a specified cycle, and that independent sunspot observations, from different observatories, displays that the sunspot areas follow a log-normal dispersal [2]. It is suggested that the Sun is about to proceed to its next supercenturial minimum as the solar minimum between solar cycles 23 and 24 during the period 2007-2009 has been the longest and deepest one at least since for the last 100 years [3].A study generated the yearly average sunspot area time series for the full Sun as well as for the individual hemispheres and analyzes different time series and showed that different properties of the sunspot cycles depend on the sunspot sizes [4]. They also found a variety of periodicities in the asymmetry index that have a dependency on the sunspot sizes. It is pointed out that solar activities are not symmetric in both the hemispheres and this hemispheric imbalance of the activities [5].It is noted that the years 2001 and 2002 of solar cycle 23 corresponds to the maximum solar activity years while years 2007 and 2008 belongs to the minimum phase of the solar cycle 23 [6]. There are studies who performed statistical analysis of the solar wind drivers, especially the ones are driven by magnetic cloud and complex ejecta have also been investigated in a few comprehensive studies are among who have quantified the magnetic storms driven by a magnetic cloud [7].
2.1. Space Weather
- Coronal Mass Ejections (CMEs) hurl huge masses of energized gas out into space. These occur most often during the period of maximum solar activity and cause a phenomenon called space weather. These are the outburst of solar energetic particle events, as a result of acceleration and heating of solar plasma during solar flares. Geomagnetic Storms (GMS) are caused by the interactions by materials ejected from the Sun, specifically, Solar Energetic Particle (SEP) events that lead to the disturbances in the Earth’s magnetic field [8] and large SEP events with halo CMEs are associated with the solar flares [9].It was reported that there is a difference in the sunspot number in cycle 24. It has been noted that it has dropped by about 40%; the number of halo CMEs in cycle 24 was nearly the same as in cycle 23 [10]. There is an increased presence of CMEs near solar maximum [11]. The relations among characteristics of flares and CMEs were considered and found that flare and CMEs initiated from the same active region [12]. Studies about the role of solar variability found out that there is a strong correlation between points of surface air temperature. Implying that solar variability has been the dominant influence on northern hemisphere temperature trends since at least 1881. That there is an apparent correlation, and its implications for previous studies which have instead suggested that increasing atmospheric carbon dioxide has been the dominant influence [13].The observation of the powerful flares in cycle 24 and reported that the number of strong flares reduced by about 34% as compared from cycle 23 [14]. CMEs originating close to the central meridian of the Sun directed towards the Earth are the most geoeffective one with the biasing of the source region to the western hemisphere and makes it very important to know when a solar disturbance would reach the Earth [15].The propagation of CME can be determined whether a particular event might be directed towards Earth, Venus, Mars, or indeed any other objects in the solar system [16]. The CME arrival times in the locality of the Earth show a significant role for solar-terrestrial environment. It is essential to forecast the CME arrival time at 1 AU, for the better predicting of space weather [15]. This progress can be due to their interface with the background solar wind – including stream interactions regions, co-rotating interaction regions, and fast solar wind streams – as well as other CMEs [17].It was revealed that about 65% prominence eruptions are associated with CMEs which is lower than any researches have conducted, there is no correlation between various speeds of CMES and their acceleration, and the rate of prominence eruptions and prominence eruptions associated CMS varies with solar cycle variation [18].The solar activities main feature is the quasi-periodicity with a period of about 11 years that varies in both amplitude and duration, known as the Schwabe cycle. Schwabe cycle is the most prominent variability in the sunspot-number series. It is renowned now as a vital feature of solar activity originating from the solar-dynamo process. It is blatant in many other parameters including solar, heliospheric, geomagnetic, space weather, climate, and others. Many indices are used to quantify diverse aspects of the variable solar activity. Quantitative indices comprise direct and indirect, they can be physical or synthetic. The longest available index of solar activity is the sunspot number, which is a synthetic index and is useful for the quantitative representation of overall solar activity outside the grand minimum. Furthermore, it showed that solar activity contains essential chaotic/stochastic components, which lead to irregular variations and make the prediction of solar activity for a timescale exceeding one solar cycle impossible [19].CMEs in the interplanetary space (ICMEs) are considered to be the main source of geomagnetic disturbances [20]. CME clouds have been reported to produce several effects in the near-earth space, including geomagnetic disturbances [21-27]. There is a clear identification of specific solar wind parameter that best follows the development of the recovery of the geomagnetic disturbance during the presence of ICMEs with distinct magnetic properties will also be useful.
2.2. Solar Cycle 24
- A research utilized solar wind plasma and field data of the same periods of the solar cycle and applied methods of superposed epoch analysis and the correlations analysis and found that magnetic clouds appear more geoeffective than non-magnetic cloud group of ICMEs [28]. During the period 2010-2015 of solar cycle 24, 63% of magnetic cloud (MCC) produce moderate/severe geomagnetic storms while only 23% and 24% another non-magnetic cloud (MCN and MCL) ICMEs produce such large disturbances. The relationship between the CME and flares was found using a set of 77 flare-CME pairs observed in the period 1996-2008 and found a correlation between the CME speed and the soft X-ray flux and fluence of the associated flares, characterized by R = 0.48 for flare flux and 0.58 for fluence [29].Another study considered the connection amongst characteristics of flares and CMEs by means of the limb events, gathered 129 events in solar cycle 23 and 92 events in solar cycle 24, comparing the flare-CME relationship in two solar cycles, it showed no significant differences are found between the two cycles [30]. It is also revealed that the CME average width was slightly larger and the CME mean acceleration was slightly higher in solar cycle 24 and that there was fairly an improved relation between flare flux and CME deceleration in cycle 24 than in cycle 23.It is also revealed that the general trend in heliospheric CME activity is consistent with the solar activity cycle, increasing from a minimum in 2008-2009 to a maximum in 2012-2013, followed by a subsequent decline to 2017 [31]. Also, increases in the rate of heliospheric CMEs occur near the start of 2010 and 2011. Geomagnetic storms are largely associated with CMEs from the sun. CMEs faster than – 500 Km/s eventually drive shock waves which normally strike the earth’s magnetosphere in 24 to 36 hours after the even on set on the sun. 47 geomagnetic storm with minimum Dst ≤ -100nT.It is concluded that the localized Earth potentials can produce significant effects on power systems and pipelines [32]. The corrosion is increased by the electric currents that spread through the ground during magnetic storms and substorms; the difference in potential with the ground (PV) can become positive by several volts, resulting in electron leakage. It is also observed the PV values were always negatives, but during some periods, they were greater than -850 mV.It was emphasized that there is a significant increase in the rate of CMEs detection during SC 24 compared to SC 23 [33]. A very important result has been recently indirectly proved which clearly fixated on trends with time among the catalogs were shown to be consistent based on the correlation coefficient [34].Space weather is significantly controlled by CME which can affect our Earth environment in many ways [35]. A research has studied some characteristics of large kinetic energy CMEs (KE greater than equal to 1031 ergs) [36]. More than 30,000 CMEs has been observed by SOHO/LASCO from 1996 to 2015. Out of all CMEs, only 314 CMEs are large kinetic energy CMEs. It is also shown that majority of events are biased to the positive acceleration that expresses that huge kinetic energy CMEs accelerate in general. It also found that mass and kinetic energy of CMEs do not rest on the position of CME and related flare on the solar disc.A study presented the statistical analysis of coronal mass ejections image by the Heliospheric Imager (HI) was conducted [31], compared the heliospheric CME characteristics with properties of CMEs observed at coronal altitudes, and with sunspot number and showed that heliospheric CME rates correlate with sunspot number as well as being more abundant, heliospheric CMEs, like their coronal counterparts, tend to be wider during solar maximum. Moreover, the results confirm that CME launch sites do not simply migrate to higher latitudes with increasing solar activity.
3. Materials and Methods
- The research explores the inherent quantitative behavior of the Sun. This study will give rise to the study of solar science that will showcase the exquisite role of the Sun through analyzing its behavior. The solar parameters are delimited to coronal mass ejections and the disturbance storm time index (Dst) during geomagnetic storms of solar cycle 23.Some studies have shown that there are about 6,000 – 10,000 CME was observed by SOHO/LASCO (Solar Heliospheric Observatory/ Large Angle Spectrometric Coronograph) during the 23rd and 24th solar cycles. LASCO/SOHO observations are utilized [33, 37] and recognize the relationship between geomagnetic storms and coronal holes through the use of a different methodology to realize the relation between type II radio burst linked to CMEs and CHs [38]. Other studies use of LASCO halo CMEs data of 248 events observed during the time period 1996-2007 and predicted the advent times as precisely as probable of full halo CMEs only [39]. It is found that the observed travel time is fairly interrelated with several speeds of CMEs, the considered travel time is exceptionally correlated with different speeds of CMEs, the direction of CME towards Earth does not depend on associated activities [15].In this study, data were gathered from Compact Astronomical Low Cost, Low Frequency Instrument for Spectroscopy and Transportable Observatory (CALLISTO) network: STEREO, LASCO, SDO/AIA, and Solar Heliospheric Observatory (SOHO), Space Weather Services of the Australian Government Bureau of Meteorology, Sunspot Index and Long-term Solar Observations (SILSO), Solar Physics, Marshall Space Flight Center, National Aeronautics and Space Administration (NASA), Space Weather and Prediction Center, National Oceanic and Atmospheric Administration (NOAA), to obtain accurate results of the data. These mentioned sources can be accessed over their respective websites and can be navigated easily on obtaining such raw data.The gathered data were analyzed using time series analysis to determine the trend of the CME data for larger cases of solar cycle 23 and extending also to the current solar cycle 24; from 1996 to 2016. Fourier analysis of the Disturbed Storm Time (Dst) Index of the Solar Cycle 23 used to determine the ascending and descending phase of the solar cycle and the relationship that could determine with the peak during this solar cycle, and Kolmogorov-Smirnov Test was used to determine the apparent difference of CME and its specific dispersal over time both utilized 0.05 for the significance level using SPSS.
4. Result
- Provided with the gathered solar parameters, this paper is able to reflect the different statistical treatments and presentations to easily realize the analysis of the coronal mass ejections in the solar cycle. The result of the time series trend analysis of coronal mass ejections shows the increase and decrease since the start of data collection from 1996 to 2016. Based on figure 1, it further shows that the trend is decreasing. This basically reveals that the amount of coronal mass ejections being generated by the Sun is decreasing as time goes by which means that the sun produces lesser ejections. It is also noted that the rise of the CMEs was visible during 2003 and a deep decrease during 2007. Both peak and crest of the figure are within the solar cycle 23. Thus, interposing no probable reason, for now, the influence of the peak and crest of the CME in the same solar cycle. It can also be seen on the figure of the apparent drop of the CMEs during the years of 2001 and 2013, five and six years after the start of the SC 23 and SC 24, respectively.
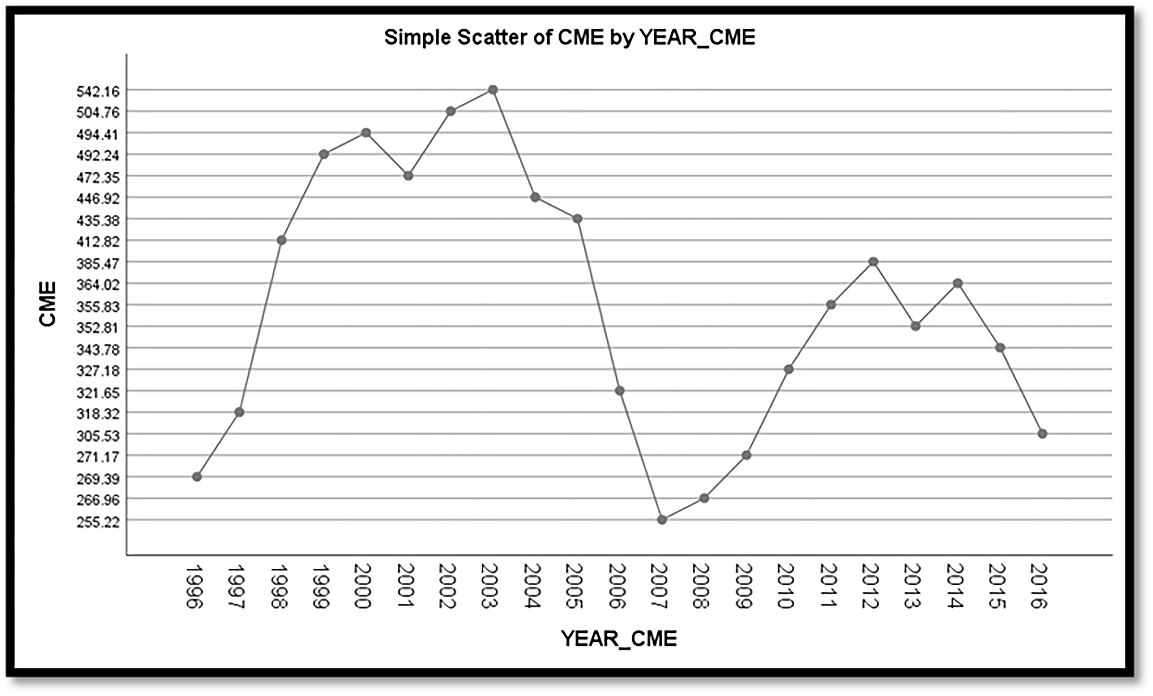 | Figure 1. Time Series Trend Analysis of Coronal Mass Ejections |
|
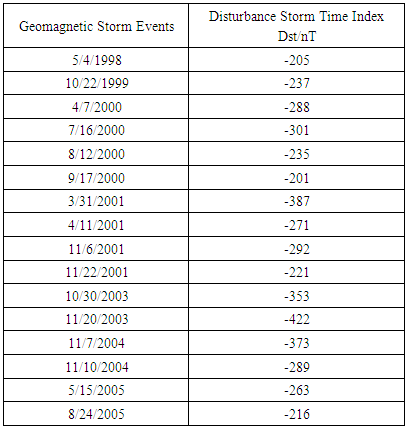
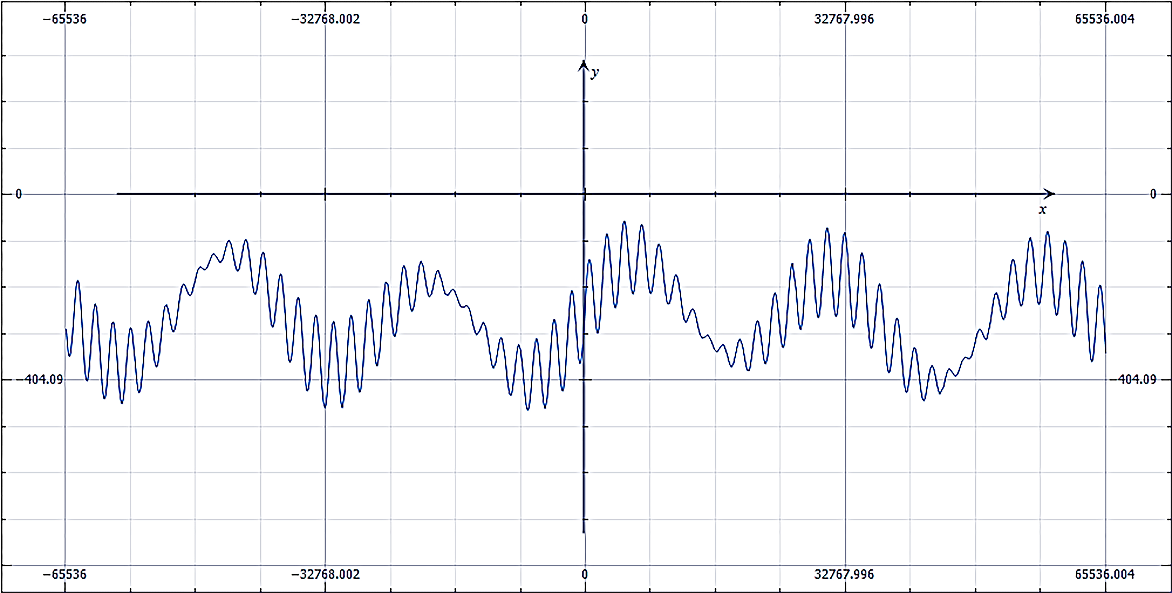 | Figure 2. Fourier Analysis of the Disturbed Storm Time Index of the Solar Cycle 23 |
|
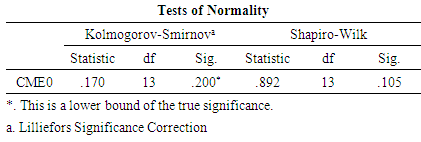
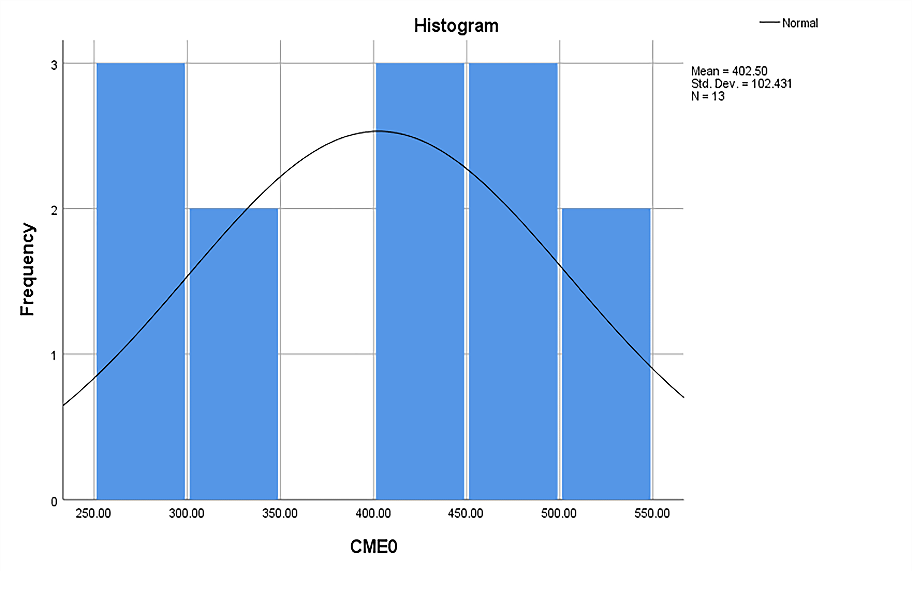 | Figure 3. Histogram of the Coronal Mass Ejection Data |
5. Discussion
- The time series analysis reveals that there is a trend for the CMEs. It is disclosed that the maximum solar activity happens in the years 2001 and 2002, and minimum phase happened in 2007 and 2008, all of which belongs to solar cycle 23 [6]. corresponds to the maximum solar activity years. When the Sun’s magnetic field had flipped on February 2001, several recordings about great geomagnetic events occurred as it normally happens during the peak of each solar cycle. The gathered data shows that the amount of CME is decreasing over time which expresses that the Sun produces lesser ejections as it followed a subsequent decline to 2017 [31]. The highest CMEs and lowest recorded CMEs belong within SC 23 [6, 11] and a significant increase in the rate of CMEs detection during SC 24 [33]. It is also noted that the great geomagnetic storms in the ascending phase and displays more peaks during the descending phase. A trend of consistent correlation coefficient was determined [34] and significant differences between solar flare and CMEs are found between solar cycle 23 and 24 [30]. This study also affirms that the CMEs data are normally distributed which reveals that CMEs are unlikely to produce unusual extreme data.
6. Conclusions
- This study reveals the decreasing trend of coronal mass ejection from the generated data from the year 1996 to 2016. This basically implies that the amount of coronal mass ejections being generated by the Sun is decreasing as time goes by which means that the sun produces lesser ejections. It is also noted that the rise of the CMEs was visible during 2003 and a deep decrease during 2007. Both peak and crest of the figure are within the solar cycle 23. The solar cycles have a larger number of great geomagnetic storms in the ascending phase, however, more peaks occur during the descending phase. It implies that it is acceptable to assume that the weight distribution is normal. With this, it appears statistically unlikely, so there is sufficient evidence that it failed to reject the null hypothesis.The result shows that a decreasing trend of coronal mass ejection from the year 1996 to 2016. It is therefore concluded that the coronal mass ejection data are normally distributed while coronal mass ejections are distributed normally and curved. This means that even though the Sun has cycles and trends in its inherent characteristic, the Sun still possesses getting more dynamic through time which showcases that through the limited parameters involved in this study.