-
Paper Information
- Paper Submission
-
Journal Information
- About This Journal
- Editorial Board
- Current Issue
- Archive
- Author Guidelines
- Contact Us
International Journal of Astronomy
p-ISSN: 2169-8848 e-ISSN: 2169-8856
2016; 5(2): 19-24
doi:10.5923/j.astronomy.20160502.02

Coronal Mass Ejections during Geomagnetic Storms on Earth
 Abstract
 Reference
 Full-Text PDF
 Full-text HTML
Ryan Manuel D. Guido
Department of Earth and Space Sciences, Rizal Technological University, Mandaluyong City, Philippines
Correspondence to: Ryan Manuel D. Guido, Department of Earth and Space Sciences, Rizal Technological University, Mandaluyong City, Philippines.
| Email: |  |
Copyright © 2016 Scientific & Academic Publishing. All Rights Reserved.
This work is licensed under the Creative Commons Attribution International License (CC BY).
http://creativecommons.org/licenses/by/4.0/

Coronal mass ejections are the outburst of solar energetic particle events, as a result of acceleration and heating of solar plasma during solar flares. Geomagnetic storms are caused by the interactions by materials ejected from the Sun, specifically, solar energetic particle events that lead to the disturbances in the Earth’s magnetic field. The results showed that geomagnetic activity on Earth’s atmosphere severely affected unexpected changes in charge particle density, which in turn, affected technology, power grids, and relative temperature on Earth. A fluctuation was found in the amount of the disturbed storm time index as the number of great geomagnetic storms noticeably raised the ascending and the descending phases of the cycle. The solar cycles have larger number of great geomagnetic storms in the ascending phase, however, more peaks occur during the descending phase. A low inverse correlation exists between disturbance storm time index and proton flux unit of the solar proton particles; and the disturbance storm time index and the proton flux unit of the solar proton particles during geomagnetic storms on Earth are apparently and significantly distributed differently.
Keywords: Coronal Mass Ejections, Geomagnetic Storms, Solar Energetic Particle Events
Cite this paper: Ryan Manuel D. Guido, Coronal Mass Ejections during Geomagnetic Storms on Earth, International Journal of Astronomy, Vol. 5 No. 2, 2016, pp. 19-24. doi: 10.5923/j.astronomy.20160502.02.
Article Outline
1. Introduction
- Solar energetic particle events are the energetic outburst as a result of acceleration and heating of solar plasma during solar flares and coronal mass ejection. Geomagnetic storms are recognized as natural hazard in the scientific community and governmental entities are aware about the possibility of severe disturbances of terrestrial environment caused by solar activity that may threaten critical infrastructure [1]. Several studies showed that multiple interacting magnetic clouds, as a result of the release of successive CMEs, were involved in a significant number of intense storms [2-5]. Since geomagnetic storms can affect human lives, this study will determine the implications of geomagnetic activity on Earth’s atmosphere. The 10 strongest CMEs during the solar cycle 24, and solar energetic particle events with intensity
 10 pfu in the > 10 MeV energy channel are significant in causing space weather effects and are commonly referred to as large SEP events are considered in this study. Major geomagnetic storms are those with geomagnetic indices (Dst) < - 100 nT and are mostly caused by high-energy CMEs heading toward Earth [6]. The scientific hazards, concepts, physical mechanism was poorly understood by the commonalities. The forecast of severe storms without releasing a large amount of false alarms, which leads to reduce trust in the procedure of observational technique. Such technique of space weather discipline involves different physical scenarios, which are characterized by very different physical conditions, ranging from the Sun to the terrestrial magnetosphere and ionosphere.The goal of this research is to find the behaviors of the 10 strongest GMS of solar cycle 24, as currently recorded, and solar energetic particles, the implications of the geomagnetic activity on Earth’s atmosphere, to describe the geomagnetic indices (Dst) index during the major geomagnetic storms, to identify the connection through statistical relationship between the solar energetic particles during the geomagnetic storms, and the apparent difference in the solar energetic particles events during geomagnetic storms.In particular, during solar energetic particle events, protons in the energy range of 47-187 keV fed to the magnetosphere have been found to contribute substantially to the enhancement of ring current leading to intense magnetic storms.This makes that the study of coronal mass ejections, specifically solar energetic particle events, is relevant for space weather prediction. The models used in this study was the inherent conceptualization of the thematic research approach that best fits in showcasing the inherent data sets retrieved from the different databases.The experimental set up was a data mining approach in which the principles of data science was utilized as interpreted and analyzed by the mixed method approach to reveal its scientific bases on revealing its importance from the data available from the different databases as the research was employed by the use of SPSS.
2. Coronal Mass Ejections and Geomagnetic Storms
- The interaction of the geomagnetic field with the magnetic field carried within CMEs and the surrounding background magnetized by modulated solar wind. If the speeds ranges from 400-2,500 km/sec, it takes some 1-4 days for CMEs to propagate from the Sun to the Earth, with typical transmit time of 2-3 days. Correlations between the strength of CMEs, and the magnitude of their impact in geospace continue to be studied, both observationally and in numerical analyses [7-9]. On the analytical study it showed that the whole solar-interplanetary event leading to the eleven superintense
 geomagnetic storms that occurred during solar cycle 23, concluded that the interaction among multiple magnetic clouds from solar coronal holes were involved [1].It also showed that the geomagnetic disturbances cause various space weather hazards, ranging from satellite system to ground facilities, such as induction current, drastic variation of radiation belt particle flux, heating and expansion of polar upper atmosphere, and development of ionospheric storms in which all these phenomena have been a subject under intensive space weather research and are worth being predicted accurately in practical space weather forecast [10]. Geomagnetic activity that is measured by Dst is principally driven by the plasma and magnetic field conditions in the solar wind that encounters the Earth [11-13]. Indices such as Dst are used to assess magnetic storms severity. Thus, a Dst index below -50 nT is indicative of moderate disturbance, which turns to intense when -100 nT threshold is passed [14] and superintense or extreme if Dst reaches less than -250 nT [15].It also revealed that the geomagnetic disturbances are more difficult to be predicted than quiet intervals, suggesting that the simple correlation method of solar wind measurement at separated solar longitude is not enough to accurately predicting geomagnetic disturbances, even though the correlation seems generally high [10].The solar cycle distribution of major geomagnetic storms
  including intense storms at the level of
  great storms at
  and super storms at
  which occurred during the period of 1957-2006, based on Dst indices and smoothed monthly sunspot numbers. It also shows that the majority (82%) of the geomagnetic storms at the level of
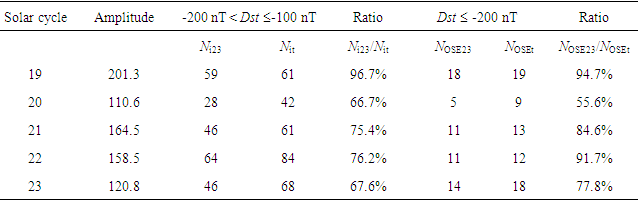
  that occurred in the study period were intense geomagnetic storms, with most are ranked as great storms and almost half of it are super storms [16].Geomagnetic storms are largely associated with CMEs from the sun. CMEs faster than – 500 Km/s eventually drive shock waves which normally strike the earth’s magnetosphere in 24 to 36 hours after the even on set on the sun. 47 geomagnetic storm with minimum Dst ≤ -100nT.The Carrington event of 1859, the March 1989 storm responsible for the Quebec power outrage or the October 2003 storm threatening the electrical grid in South Africa and Sweden cannot be missed in the short list of historical records of extreme geomagnetic storms due to their consequences for society. All these three storms had consequences in infrastructures, and all of them were super intense as seen by Dst index [1]. Carrington event was estimated by [17] as -1760 nT, approximately three times more intense than the Quebec storm.Solar energetic particle events are hazards for satellites and space-based instrumentation. If they are trapped in the inner magnetosphere’s dipolar field, they populate the radiation belts and reside in the magnetosphere for extended periods. When solar energies in the range of several MeV reach a spacecraft, which can penetrate the shielding and bury themselves within dielectric materials. Many authors’ studies included currents that it happens when voltage readings are irregular and at times full outside the safe zone. They are influenced by the geomagnetic activity the Earth conductivity and the pipeline structure. A study concluded that the localized Earth potentials can produce significant effects on power systems and pipelines. The corrosion is increased by the electric currents that spread through the ground during magnetic storms and substorms; the difference in potential with the ground (PV) can become positive by several volts, resulting in electron leakage. It is also observed the PV values were always negatives, but during some periods, they were greater than -850 mV [18].Another showed that the SEP event considered as one of the 4 major events of the solar cycle 23, which has a maximum proton flux of 24,000 pfu. During strong SEP events (and intense geomagnetic storms), the solar protons and the auroral electrons possibly have sufficient energy as to penetrate to the height covered by the meteorological balloons and so, these charged particles could give rise to weak and disperse changes in temperature. Statistically significant increase in temperature is not observed in the study. Further, studies in different latitudinal sectors are necessary in order to determine whether there are temperature increases depending on the intensity of geomagnetic storm [19].Studies about the role of solar variability found out that there is a strong correlation between points of surface air temperature. Implying that solar variability has been the dominant influence on northern hemisphere temperature trends since at least 1881. That there is an apparent correlation, and its implications for previous studies which have instead suggested that increasing atmospheric carbon dioxide has been the dominant influence [20]. The velocity and angular distance of the particles were found to be dependent on the relative kinetic energy of every solar proton particle event during the major geomagnetic storms occurred on Earth. Moreover, the geomagnetic activity on Earth’s atmosphere severely affected unexpected changes in charge particle density, which in turn, affected technology, power grids, and relative temperature on Earth. The table below shows the disturbance storm time index during major geomagnetic storms in the solar cycle 23.
|
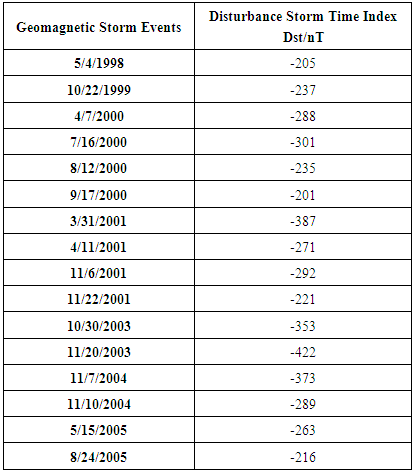
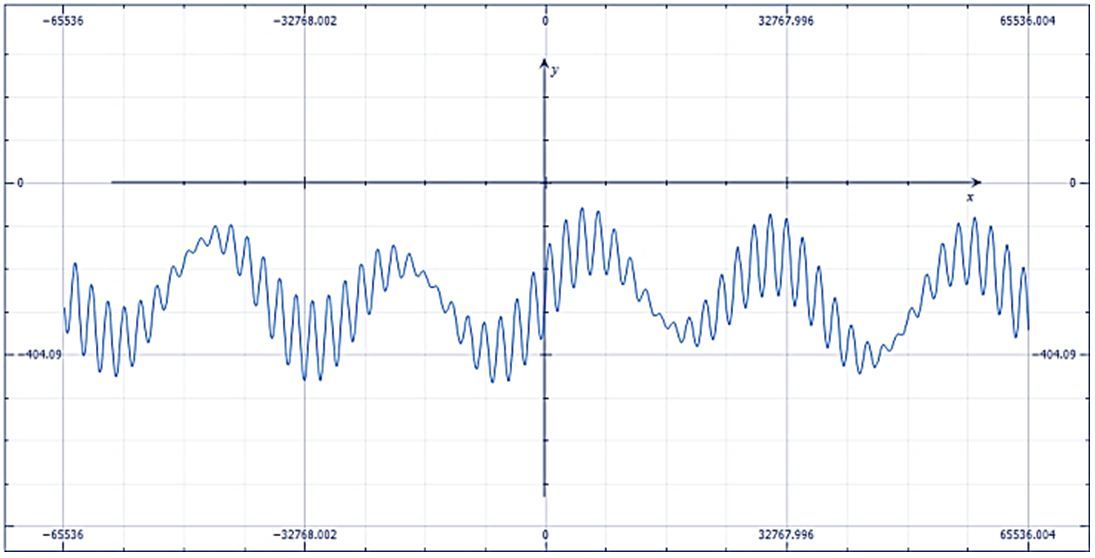 | Figure 1. Fourier Analysis of the Disturbed Storm Time Index of the Solar Cycle 23 |
|
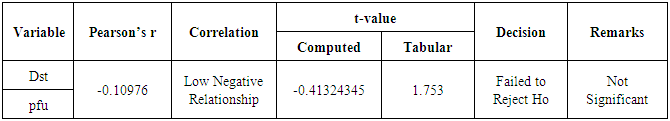
3. The Relationship between the Solar Proton Events and Geomagnetic Storms
- The table below shows the correlation between the disturbance storm time index and the proton flux unit of the solar proton particles.
|
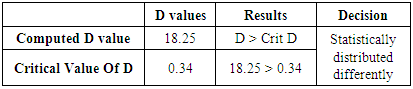
4. The Apparent Difference in the Solar Proton Events during Geomagnetic Storms
- The table below was calculated using the Kolmogorov-Smirnov test (K-S test) to determine if there is an apparent difference between in the solar proton events and the disturbed storm time index.
|
5. Disturbed Storm Time Index and the Proton Flux Unit
- This will resolve distinctions about the relationship on the predictive factors of solar energetic particle specifically the solar proton particles in pfu and the geomagnetic storms in disturbed storm time index in Dst.
|
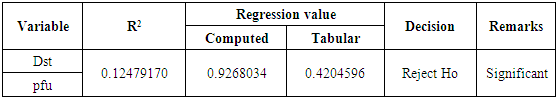
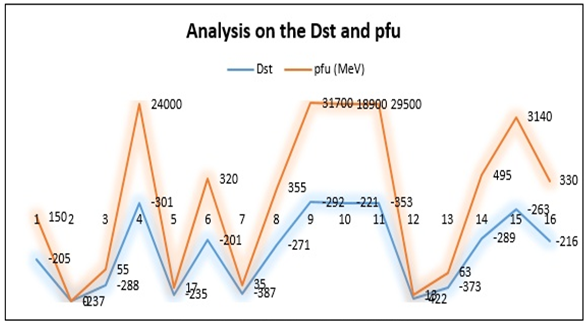 | Figure 2. Analysis of the Dst and pfu during Solar Cycle 23 |
6. Conclusions
- Based on the findings of the study, it shows that the greater the amount of relative kinetic energy of the solar proton particles, the greater is its velocity and angular distance. The geomagnetic activity on Earth’s atmosphere has significant effects on technology, power grid, and relative temperature on Earth. The solar cycles have larger number of great geomagnetic storms in the ascending phase, however, more peaks occur during the descending phase. A low inverse correlation exists between disturbance storm time index and proton flux unit of the solar proton particles. The disturbance storm time index and the proton flux unit of the solar proton particles during geomagnetic storms on Earth are apparently and significantly distributed differently.It is then recommended to fully determine the eminent relationship between the disturbed storm time index and the proton flux units, the amount of disturbed storm time index and proton flux units can be used into account the full data of the Dst and pfu, however the threats is the availability of the data as there are data that were not available, much as lapses, and it is suggested to fully gather data and researches about the effects and implications of the geomagnetic storms on the archive of different atmospheric, astronomical, and other scientific journal to fully extract the essential factors so that the implications can be fully drawn.