-
Paper Information
- Paper Submission
-
Journal Information
- About This Journal
- Editorial Board
- Current Issue
- Archive
- Author Guidelines
- Contact Us
International Journal of Astronomy
p-ISSN: 2169-8848 e-ISSN: 2169-8856
2016; 5(1): 1-6
doi:10.5923/j.astronomy.20160501.01

Aerosol Optical Thickness and Water Vapor in the Atmosphere of Metro Manila
 Abstract
 Reference
 Full-Text PDF
 Full-text HTML
Ryan Manuel D. Guido, Miguel M. Artificio
Department of Earth and Space Sciences, Rizal Technological University, Mandaluyong City, Philippines
Correspondence to: Ryan Manuel D. Guido, Department of Earth and Space Sciences, Rizal Technological University, Mandaluyong City, Philippines.
| Email: |  |
Copyright © 2016 Scientific & Academic Publishing. All Rights Reserved.
This work is licensed under the Creative Commons Attribution International License (CC BY).
http://creativecommons.org/licenses/by/4.0/

This study determine the amount of aerosol optical thickness and water vapor in metro manila during the first trimester of 2013, the difference in the amount of aerosol optical thickness in the first trimester months, and the relationship between the aerosol optical thickness and amount of water vapor in the atmosphere. This study utilized aerosol data from satellite measurements of the National Aeronautics and Space Administration (NASA) using Aerosol Robotics Network (AERONET) ground base measurement station in Manila Observatory to determine the aerosol optical thickness for the first trimester of 2013 in Metro Manila, Philippines (14º22’ N, 120º53’ E, and 13 m above sea level). The findings showed that there is a significant increase in the amount of aerosols optical thickness and a linear increase of water vapor in the atmosphere as time passes by, going through the months of the wet season, there is a significant cumulative increase of aerosols and water vapor in the first trimester of 2013. Therefore, it concludes that there is a significant difference in the amount of aerosol optical thickness during the first trimester of 2013 and there is a very high positive relationship between the aerosol optical thickness and amount of water vapor in the atmosphere.
Keywords: Aerosol Optical Thickness, Water Vapor, Metro Manila Atmosphere
Cite this paper: Ryan Manuel D. Guido, Miguel M. Artificio, Aerosol Optical Thickness and Water Vapor in the Atmosphere of Metro Manila, International Journal of Astronomy, Vol. 5 No. 1, 2016, pp. 1-6. doi: 10.5923/j.astronomy.20160501.01.
Article Outline
1. Introduction
- Aerosols are tiny particles in solid or liquid phase suspended in the atmosphere. They can be naturally occurring from volcanoes, windblown dust, dust storms, forest and grassland fires, living vegetation and sea spray or anthropogenic, generated from the burning of fossil fuels. These particles are called particulate matter. These can be categorized according to their shape, size, and composition; which can be classified as ultrafine particles PM0.1, fine particles PM2.5, or coarse particles PM10.These aerosols occur over a wide range of sizes, extending from 10-2 µm to about 102 µm. Aerosol particles larger than about 1 µm in size are produced by windblown dust and sea spray and bursting bubbles. Aerosols smaller than 1 µm are mostly formed by condensation process such as conversion of sulfur dioxide (SO2) gas (released from volcanic eruptions) to sulfate particles and by formation of soot and smoke during burning processes [1].They hover in the atmosphere which can be located in the stratosphere to the surface and range in size from a few nanometers to micrometers. Aerosols range in size from very small clusters only a few nanometers (10-9 m) in diameter to several µm. Aerosol number density ranges from 10 cm-3 in the lower stratosphere during volcanically quiescent times to 103 cm-3 in clean tropospheric air (particularly in the southern hemisphere) to 106 cm-3 or more in polluted urban environments.The gaseous aerosol precursor groups together dimethylsulfide (DMS), sulfur dioxide (SO2), and hydrogen sulfide (H2S). The aerosol fine mode includes sulfate, black carbon (BC), particulate organic matter (POM), desert dust (DD) with a radius between 0.03 and 0.5 µm and sea salt (SS) aerosols with radii smaller than 0.5 µm [2].These aerosols perform a significant role not only in the atmosphere and its processes, but also in people’s health and welfare around the world. Apart from their ability to scatter and absorb solar and terrestrial radiation, plus modifying the climate as they act as cloud condensation nuclei (CNN) [3]. These particulates are important in the study for the scientist and meteorologist as it affects the climate, weather, and the peoples’ health.The smaller particulate matter has a strong potential impact on human health because it can be inhaled easily and through their small size it allows them to get deep into the lungs and can trigger inflammation in the lung, blood vessels or the heart, or even other organs. Furthermore, it could cause asthma or cancer of other severe health problems.Aerosol affects the climate by scattering sunlight back into the space and cooling the surface. These aerosols can help clouds to form, or can inhibit cloud formation. Aerosols which are mostly found in the Earth’s troposphere are the ones associated with air pollution which are responsible for poor air quality, reduction of visibility and even health hazards [4]. Particles are highly associated with air quality and pollution. Thus, the need for understanding their physical, chemical and optical properties is essential in order to recognize their complex nature and how they affect climate and society [5].A layer of microscopic aerosol particles between the tropopause and about 30 km altitude is called the Junge Layer or the Stratospheric Aerosol Layer. These particles of mean size 0.1 µm diameter are produced from the condensation of sulfuric acid with a co-condensation of small amounts of water approximately 25-50% by weight. The sulfuric ace is produced from the oxidation of SO2, OCS and in fact transport of aerosol from the troposphere. In the absence of volcanic emissions, this aerosol has negligible optical depth. Eruption of large volcanoes can, however, increase the stratospheric aerosol optical depths by orders of magnitude.
2. Aerosol Optical Thickness and Water Vapor
- Scientist use measurements from the MODIS sensor aboard NASA’s Terra and Aqua satellites to map the amount of aerosol that is in the air all over the world. Scientist call this measurement aerosol optical thickness as it measures the amount of light airborne particles prevent from travelling through the atmosphere. Aerosols absorb and scatter incoming sunlight, thus reducing visibility and increasing optical thickness. An optical thickness of less than 0.1 indicates a crystal clear sky with maximum visibility, whereas a value of 1 indicates the presence of aerosols so dense that people would have difficulty seeing the sun (AERONET).The AERONET is a federation of about 200 ground based measurement sites around the world [6] and provides spectral measurements of sun and sky radiance for cloud free conditions [7].Aerosols interact both directly and indirectly with the earth’s radiation budget and climate. They scatter and absorb optical radiation depending upon their size distribution, refractive index and total atmospheric loading which results to the attenuation (extinction) of solar radiation reaching the earth’s surface [1]. Aerosols can affect solar radiation budget in two ways; by directly scattering and absorbing solar radiation (this is known as the direct radiative forcing), and also by acting as cloud condensation nuclei thereby influencing the optical properties and lifetime of clouds (this is known as the indirect radiative forcing). Aerosols tend to cool the Earth’s surface directly beneath them. As most aerosols reflect sunlight back into space, they have a “direct” cooling effect by reducing the amount of solar radiation reaching the Earth’s surface [8].This study utilizes aerosol data from satellite measurements using Aerosol Robotics Network (AERONET) ground base measurement station in Manila Observatory to determine the Aerosol Optical Thickness for the first trimester of 2013. Manila, Philippines (14º22’ N, 120º53’ E, and 13 m above sea level) it features a tropical and maritime climate characterized by relatively high temperature, high humidity and abundant rainfall. It has only two seasons, dry from November to April, and wet during the rest of the year, while June to September is the period with maximum rainfall.The study of atmospheric aerosols in Asia has occurred much attention in the scientific community. Aerosols generated in Asia has significant direct and indirect effect on changing the Earth’s climate on a global scale.It is also pointed out that in the last decade, scientist from East Asian countries and the world’s science communities have organized and conducted many international and regional experiments and projects on aerosol optical properties and the measurement of radiation, for example: NASA AERONET (Aerosol Robotic Network), East Asian Regional Experiment 2005 (EAREX 2005) of the United Nations Environmental Program (UNEP), Atmospheric Brown Cloud (ABC) project, ABC Maldives Monsoon Experiment (APMEX), SKYNET (MEXT Sky Radiometer Network), ADEC (Japan-Sino Joint Aeolian Dust Experiment), ABC-EAREX (ABC East Asian Regional Experiment) and EAST-AIRE (East Asian Study of Tropospheric Aerosols, International Regional Experiment) [8].The aerosol monitoring over Eastern Asia using AERONET Sun-photometer acquired aerosol optical thickness and Angstrom exponent measurement have been conducted in the research on Aerosol properties in a Chinese semiarid region [9].Seasonal and monthly variations of columnar aerosol optical properties over East Asia determined from multi-year MODIS, LIDAR, and AERONET Sun/sky radiometer measurements [10].Asian dust particles have a significant effect on the radiative budget of the earth-atmosphere system through the scattering and absorption of solar and long wave radiation and acting as condensation nuclei to form cloud [8].The diurnal variation of AOD at 500 nm wavelength, α, β were derived from direct beam measurements. The variation of the AOD at different time intervals; (0700-0930H), (0930-1200H), (1200-1430H) and (1430-1700H) with maximum frequency occurring in 0.83, 0.97, 0.97, and 0.79, respectively, showed that the AOD was mainly influenced by human activities and industrial operations as the day progressed. The Angstrom turbidity coefficient followed of the same trend as the AOD during the day wherein the values extended up to a maximum of 2.5 with an average value about 0.11. This was also attributed to human activities (such as the use of individual transport) which starts in the morning and increase in number as the day steps forward [11].There is a vertical differentiation in profiles yielded aerosol extinction spectra and water vapor concentration. The wavelength dependence of these AOD and extinction spectra indicates that supermicron dust has been often a major component of the ACE-Asia aerosol. The frequency of dust-containing aerosol is extended to high altitudes [12].The In-situ AOT measurements were derived from atmospheric transmittance measurements using a handheld Spectroradiometer. A high correlation was found between the retrieved AOT values and the atmosphere reflectance values [13].Aerosol Optical Thickness in Philippines and East Asia region by utilizing three instruments of acquiring these results. The study shows that aerosols present from a selected time frame of satellite data for the whole month of November 2011. It was observed that the AOD on the ground level reached as high as 3.3 on the afternoon of November 2, 2011. Severe cases of pollution from East Asia, specifically from China were also evident in the study period. Intercomparison of CALIPSO, AERONET and MODIS seems to be accurate since they all share the same results. This also shows the feasibility of using satellite data retrievals has shown its applicability for aerosol studies in the Philippines as of the moment when technologies for an in depth comparison of aerosol levels with the neighboring Asian countries [14].Satellite remote sensing data sets are widely used to map the geographical distribution of aerosols at high spatial and temporal resolutions and to explore the bulk effects of atmospheric aerosols on the earth’s radiation budget. Dust aerosols, which are prevalent over the desert, can be transported to download areas thousands of kilometers away from source regions, degrading visibility and air quality, perturbing the radiative transfer in the atmosphere, providing a vector for disease causing organisms, and exacerbating symptoms in people with asthma [15].Aerosol Optical Thickness values of nine pixels centered at the Manila Observatory were recorded and results shown that the monthly MODIS AOT for both Terra and Aqua follow the PM trends well, except for one anomalous month (July) when the AOT significantly decreased despite a considerable monthly increase in PM [16].Most of the studies have used aerosol optical thickness to study urban air pollution. Aerosols fall into two main fractions, a coarse 10 micron (PM10) and finer 2.5 micron fraction. The smaller fraction easily penetrates lung tissue and is suspected of causing asthma and related conditions [17].Aerosols play an important role in the Earth’s radiative balance and in the global climate, since they influence the radiation balance through two key processes: directly, by scattering and absorbing solar radiation, and indirectly, by acting as cloud condensation nuclei and thus dramatically affecting the optical properties of clouds [18-22].There is a direct radiative effect at the top of atmosphere shortwave aerosols, but it depends on aerosol properties and the underlying surface albedo, which can be positive (warming effects) or negative (cooling effect). By absorbing incoming solar radiation, aerosols such as soot can both warm the atmosphere and cool the surface, whereas highly scattering type aerosols (e.g. sulfates) can cool the earth’s surface by reflecting more solar insolation and thereby increasing the planetary albedo [23, 24].The correlation between Aerosol Optical Depth and Cloud Condensation Nuclei decreases as the wavelength of the Aerosol Optical Depth measurement increases, suggesting that Aerosol Optical Depth at a shorter wavelength is a better proxy for Cloud Condensation Nuclei. The correlation is significantly improved if an aerosol index is used together with aerosol optical depth [25].Water vapor and aerosols are two interesting atmospheric parameters that are generally monitored for the improved understanding of weather and climate [26-31].There are variations of monthly mean AOD at 1020 nm and precipitable water vapor for the period of July 2004 – July 2005. There is a low value in winter, a global feature, is attributed to the removal of aerosols due to monsoon rains and decreased aerosol input due to colder ground surface. The less possibility of hygroscopic growth of aerosols due to low water vapor content may also contribute. High AOD is observed during July and has been attributed to increased aerosol input due to increased surface heating and resultant vertical mixing, dry surface conditions and windblown dust [1].Concurrently higher values of total water vapor and the AOD at 1020 nm are suggestive of the possibility that aerosols of sizes
 1020 nm act as condensation nuclei for the water vapor. As the droplets grow in size, and when a threshold size of the droplets is reached, precipitation occurs. The spectral dependence of mean aerosol optical depth in the wavelength region 380 – 1020 nm for the period March – June 2005. The general trend shows that the AOD values are higher for smaller wavelength and lower for larger wavelengths.Aerosols influence the solar radiation both directly and indirectly through their various sizes and thus their different optical and physical properties. When aerosols are sufficiently large in size, they scatter and absorb sunlight, and when these particles are small, they act as cloud condensation nuclei and aid in the formation of clouds [32].The particle population highly depends on the strength of their source and sink mechanisms. As a consequence, concentrations of ambient aerosol differ to a great extent between urban centers and remote areas, and between industrialized and rural regions [33].The distribution of water content in the atmosphere is a good indicator of the dynamics of the circulation systems in the atmosphere [34]. It is well known that the precipitable water content present in the atmosphere can vary on very short time scales [35].Anthropogenic and natural aerosols are recognized as significant atmospheric substances in the present and future climate changes. They have two effects on the earth’s radiation budget. One is a direct effect in which aerosol particles scatter and absorb the solar and thermal radiation. The other is an indirect effect in which they change the particle size and lifetime of cloud droplets acting as cloud condensation nuclei, leading to a cloud albedo change [36].Water vapor mixing ratio is a useful as a tracer of air parcel and in understanding energy transport mechanisms within the atmosphere [37, 38]. Indeed, water vapor is the key greenhouse gas in an atmosphere and has an important role in radiation transfer processes, cloud formation, and atmospheric circulation [35, 39].It is also shown that the water uptake significantly affects the particle size, shape, and chemical composition and therefore the aerosol role in the radiative forcing of climate [40]. Thus, simultaneous measurements of the vertical profiles of aerosols and water vapor densities are required to investigate the correlation between these two interesting atmospheric parameters [41] and determinate the aerosol characteristics.
3. Data Analysis
- The figure below shows the amount of water vapor in the atmosphere of metro manila during the first trimester of 2013. This figure illustrates the fluctuation of the water vapor in the atmosphere. It is shown that there is a minimal amount of water vapor in the atmosphere during the month of January, eventually increases in the month of February, but lately dropped down as the availability of data from AERONET is limited. Then gradually, there is a sudden increase of water vapor in the atmosphere by March, as shown in the figure, during the latter part of January, there was a sudden increase in the amount of water vapor that has been continued during the month of March. As it can be noticed during the latter part of March, the consistency of having an increase in the amount of water vapor is evident.
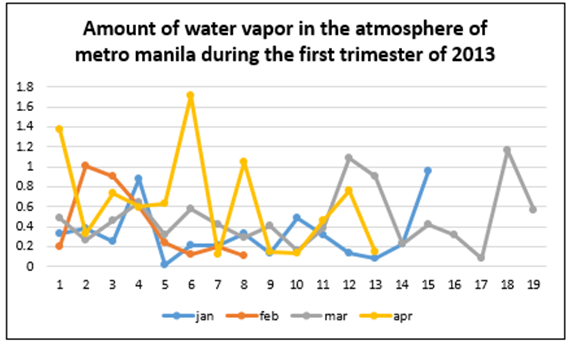 | Figure 1. Amount of Water Vapor in the Atmosphere of Metro Manila during the First Trimester of 2013 |
|
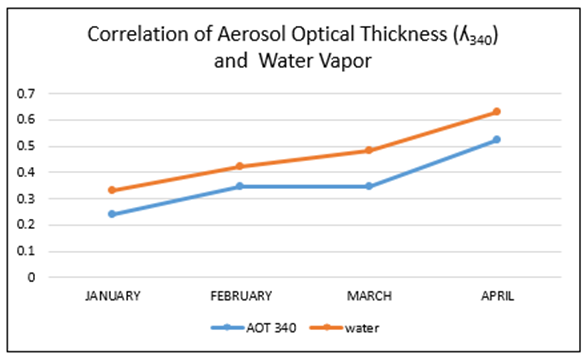 | Figure 2. Correlation between Aerosol Optical Thickness and Amount of Water Vapor in the Atmosphere |
4. Conclusions
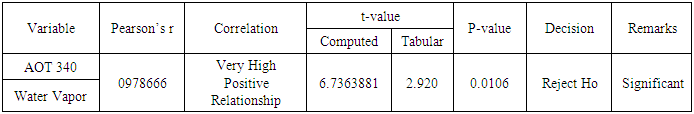
- There is a significant increase in the amount of aerosols in its optical thickness at varying wavelengths in the atmosphere. As time passes by, going through the months of the wet season, there is a significant cumulative increase in the first trimester of 2013. There is a linear increase of water vapor in the atmosphere as time passes by, going through the months of the wet season in the first trimester of 2013. There is a significant cumulative increase in the first trimester of 2013.It therefore concludes that there is a significant difference in the amount of aerosol optical thickness during the first trimester of 2013 and there is a very high positive relationship between the aerosol optical thickness and amount of water vapor in the atmosphere. There is a significant relationship between aerosol optical thickness and water vapor in the atmosphere.Furthermore, it is recommended to use other aerosol optical thickness at different wavelengths to determine the significant differences in the time frame not covered by the study.It is also recommended to use other variable other than water vapor in the atmosphere to determine the significant relationship on the amount of aerosols in the atmosphere for the academe and the field of atmospheric science.