-
Paper Information
- Paper Submission
-
Journal Information
- About This Journal
- Editorial Board
- Current Issue
- Archive
- Author Guidelines
- Contact Us
International Journal of Astronomy
p-ISSN: 2169-8848 e-ISSN: 2169-8856
2014; 3(1): 1-17
doi:10.5923/j.astronomy.20140301.01
A Statistical Study of Prominence Eruptions and Coronal Mass Ejections during 2002-2008
 Abstract
 Reference
 Full-Text PDF
 Full-text HTML
Pooja Gupta , Rachna Sharma , Ruby Yadav , Udit Narain
Astrophysics Research Group, Meerut College, Meerut-250001, India
Correspondence to: Pooja Gupta , Astrophysics Research Group, Meerut College, Meerut-250001, India.
| Email: |  |
Copyright © 2012 Scientific & Academic Publishing. All Rights Reserved.
It has been recognized early that prominence eruptions (PEs) are the near-surface activity, mostly associated with coronal mass ejections (CMEs). The prominence eruption is treated as a secondary process during the CME phenomenon because prominence may not have sufficient energy to drive CME. In the present work we showed the results of a statistical study of the association between a large number of solar prominence events observed by the Nobeyama Radioheliograph (NORH) and coronal mass ejections, observed in white-light by SOHO/LASCO. In our study 165 events are studied, out of them 66% are found radial events (Eruptive prominences/EPs) while only 33% are transverse events (Active prominences/APs). When we compare the data with white- light CMEs data it is found that 41% Prominences are clearly associated with CMEs and 62% of CMEs associated with EPs have cores, while only 46% APs have cores. We found that the average height and speed of radial events are larger than the transverse events and 99% of EPs reached at height 1.1Ro (solar radius). Our study of temporal and spatial behaviour of prominence and CMEs events shows that the PEs and CMEs seem to start nearly at the same time.
Keywords: Sun, Coronal mass ejection, Prominence eruption
Cite this paper: Pooja Gupta , Rachna Sharma , Ruby Yadav , Udit Narain , A Statistical Study of Prominence Eruptions and Coronal Mass Ejections during 2002-2008, International Journal of Astronomy, Vol. 3 No. 1, 2014, pp. 1-17. doi: 10.5923/j.astronomy.20140301.01.
Article Outline
1. Introduction
- Filaments (or prominences when seen on the solar limb) are relatively cool structures that are enclosed firmly in a surrounding mass in the corona[1]. Prominences are tongues of a material emitting a visible spectrum typical of chromospheres, normally observed in H-alpha, but also seen in microwaves. To clarify the types of prominence classification schemes, Pettit[2,3,4,5 and 6] defines a prominence as eruptive when the entire phenomenon moves up with a uniform velocity and active prominence is one in which material seems to be streaming into nearby active centers (such as sunspots)[7]. According to Tandberg- Hanseen[8] two primary types of mass motions have been recognized in prominence are active prominence in which material streams from one part to another on the solar surface, and eruptive prominence in which the material leaves the sun partially or completely. Prominence eruptions are known to be related to the CME initiation since the early CME observations[9, 10], as the filaments are an essential part of the most CME initiation model[11, 12]. A detailed study about these “moving” Prominences[13] is important to get a clear understanding of coronal mass ejections (CMEs) since the inner core of CMEs is made up of prominence material[14, 15]. CME is considered to be a distinct feature of coronal and interplanetary dynamics. They are responsible for large geomagnetic storms, and can drive transient interplanetary shocks, which are key sources of energetic particle events. It has been shown that CMEs can be caused by the eruption of inverse polarity prominences[16]. Inverse polarity refers to the case in which the magnetic field threading the prominence has the opposite direction as the underlying magnetic field. Maricic[31] showed that the take-off of the PEs and overlying structure is tightly synchronized, favoring the hypothesis according to which the whole structure erupts as a single entity[32]. The mechanism of the prominence/CME eruption is not fully understood, because the underlying magnetic structure is poorly known. In particular, the prominence is usually very complex itself, and most often it is not possible to disclose its configuration. Moreover, not much is known about the overall magnetic structure within which the prominence is nested[33]. The eruption of the prominence and the associated magnetic structure could be considered as a process of catastrophic loss of equilibrium[32]. The most probable initial configuration of CMEs is a flux rope, consisting of twisted field lines that form a dark cavity stretched in the corona along the photospheric inversion line)[34]. Cold and dense prominence material accumulate in the lower parts of the helical flux tube, where concave field lines form a magnetic-dip configuration, providing support against gravity[35]. The Prominences are believed to be caused by the formation of a flux rope low in the magnetic structure eventually erupts to form the CME. Many CME onset models (e.g., flux cancellation, mass loading) require the presence or formation of a prominence in order for the CME to erupt[36]. The correlation between CMEs and eruptive prominences depends on the amount of matter contained in the initial magnetic structure[37].Therefore, it seems useful to study on prominence eruption and their association with CMEs which are most frequently associated with erupting prominence. Many studies have shown that eruptive prominences can be traced into the inner parts of the bright core[14, 17, 18], which is also clear in the study of Munro[9]. However, in 1997, data from the Big Bear Solar Observatory (BBSO) has suggested that the association between H-alpha prominence eruptions and white-light CMEs was rather poor[19]. Hori, and Culhane[20] found the similar relationship between 50 microwave prominence eruptions observed by NORH and white-light CMEs concluded that 94% PEs were clearly associated with CMEs. Recently, Yang and Wang[21] carried out a statistical study of a large number of prominence and filament eruptions (431 in all), and they concluded that only 10%–30% of the prominence eruptions were found to be associated with CMEs, which is consistent with the earlier BBSO study[19]. Their study was further extended by[15], which reported the result of statistical study of a number of prominent (186 in all) concluded that only 72% PEs were clearly associated with CMEs. Very recently it has been reported that out of 396 events, 390 (98%) were associated with CMEs[22]. In view of previous studies 98% association seems too high. Here we re-examine the relationship of PEs associated CMEs by using a large data set for the period 2002-2008 covering solar cycle 23.
2. Data Selection
- The Nobeyama Radio Heliograph (NORH) is a Japanese interferometric array which observes the Sun in two frequencies, 17 and 34 GHz; from 22:00 to 6:00 UT .The generated maps can have a spatial resolution of ~ 10 arcsec and a time resolution of 1 sec.[23]. Shimojo et al.[24] developed a method to automatically detect prominences in the Nobeyama 17 GHz routinely observations. The automatic detection is based on the difference of brightness temperature between the corona (optically thin) and the prominence (optically thick) material and is explained in detail in[24]. Although, NORH has observed filaments and prominences both, in our study, we focus on the prominences because it is easier to measure the characteristics of height vs. time. We have considered all the prominence eruption events during the period (2002-2008) which covers the sunspots (maximum to and the minimum periods of the current solar cycle 23). During this period, 165 events are observed, which have been analyzed in this paper. The Large Angle and Spectrometric Coronagraph (LASCO)[25] on the board of the Solar and Heliospheric Observatory (SOHO) spacecraft has observed the corona and near solar interplanetary space, from 2.5 to 30 Ro since the end of the year 1995. The LASCO data contain speed, acceleration, width and position angle of CMEs and is catalogued at http://cdaw.gsfc.nasa.gov [26]. The position angle is measured counter clockwise from the solar north pole to the bisector normal to the CME width.
3. Statistical Properties of Prominence Events
- We tracked each of the identified prominence events for 10 minutes in order to study the height-time history of the events. The data shown in this paper is based on two aspects, (1) examination of the prominence movies and (2) measurement of height vs. time. With the help of movies we recognized the direction of motion of prominence, height, velocity etc.
3.1. Definitions of Eruptive (Radial) and Active (Transverse) Prominences
- With the help of NORH movies, we refer to all the events detected automatically as prominence events (PEs). According to us Prominence can display activity without erupting. Although a wide range of types of activities is possible, we can separate prominence into just two classes, active and eruptive. We define an eruptive prominence as one in which all or some of the prominence material appears to escape the solar gravitational field (in NORH data). EPs are generally characterized by a strong radial component of motion away from the solar surface. When the prominence has a significant motion in the radial direction, we refer to it as a radial event (R).We define an active prominence as showing motion in NORH data, where the portion of the APs appearing to escape the solar gravitational field is not considered. A Variety of AP motions exist, but the predominant motion consists of either a rise followed by a fall towards the solar surface or a rise followed by a tangential motion parallel to the surface. Only a minority of the PEs has a horizontal motion with or without a change in height; we refer to these as transverse (T) events. According to the traditional definition of prominence motions, the R and T events would roughly correspond to the ‘Eruptive’ and ‘Active’ prominences, respectively.Fig 1 shows various types of trajectories which can easily be identified in our sample. Decelerating (Fig, 1a, 1b) and constant speed (Fig, 1c) profiles are observed which are somewhat similar to the profiles of[15]. In Table-1 we show the motion’s directions for each prominence with the help of NORH movies from which height-time measurements could be done.
|
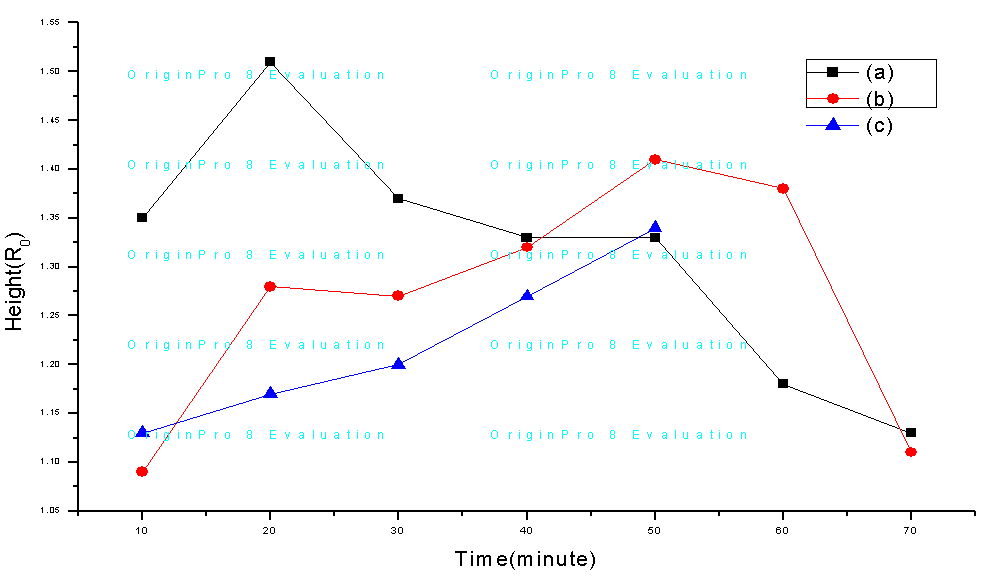 | Figure 1. Various type of prominence trajectories observed in our data. The height- time measurement fit to (a), (b) deceleration phase and (c) straight line |
3.2. Difference between Eruptive (R) and Active (T) prominences
3.2.1. Maximum Height of EPs and APs
- With the help of NORH movies, a prominence attains various final heights, but we are not able to get the complete height-time history because the observation went off when the eruption was in progress. We assumed that the last observation height was the final height. There are significant differences between EPs and APs in their maximum heights and velocities.The distribution of final height is shown in Fig 2. The estimated heights are in the range of 1.00 to 1.65Ro. The average of the distribution of heights for all prominence is 1.24 Ro. We have compared the distribution of the final heights for radial and transverse events. We find that the average final height (1.27 Ro) of the R events is larger than that of T events (1.18 Ro). Our final average height of R and T events is similar to those of Gilbert[7]. It can be seen from the figure that EPs tend to have significantly greater maximum-heights than do for APs. In particular, 99% (109 of 110) of the EPs reached at least 1.1 Ro (before disappearing), while only 94% (52 of 55) of the APs did. This contrast becomes greater with increasing height: 78% (86 of 110) of the EPs reached at least 1.2 Ro, while only 30% (17 of 55) of the APs did, and 1% of the APs beyond 1.35 Ro, but a majority (18%) of EPs did. The highest measurable point (in NORH) for any EP trajectory was 1.70Ro. In Fig.3, the distributions are remarkably similar to those in Fig.2, the average height of prominence associated CMEs is 1.27 Ro and without CMEs is 1.22Ro, this result is very close to radial and transverse events.
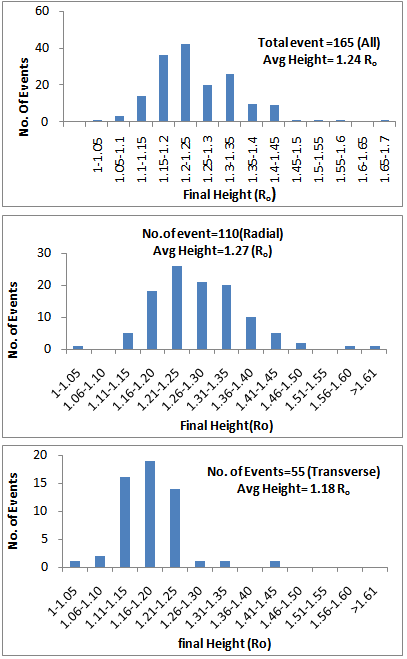 | Figure 2. Maximum heights reached by the prominences: all events (top); radial events (middle); transverse events (bottom). The heights are measured from the disk center |
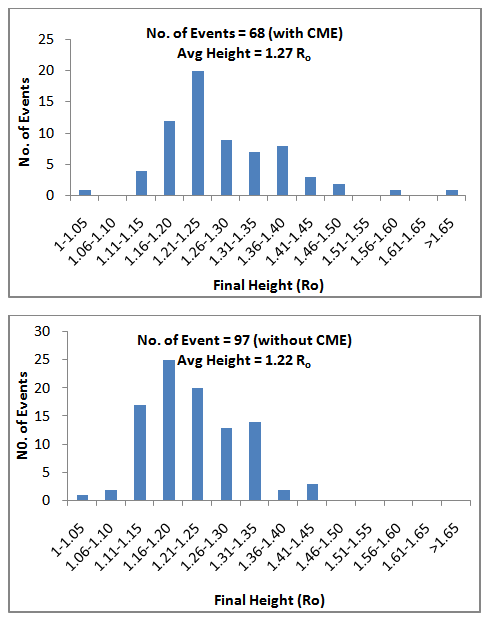 | Figure 3. Histograms of the maximum heights reached by prominences: events associated with CMEs (top); events not associated with CMEs (bottom) |
3.2.2. Prominence Velocities :( Radial velocities of EPs and APs)
- In Fig.4, the distribution eliminated thirty five (35) events with negative speed (opposite direction). For 21 of the transverse events and 13 of the radial events with negative speed; it was not possible to obtain a meaningful outward velocity. The distribution of speeds of the remaining 130 events is shown in the top panel of Fig.4. The speed ranges from a few to 200 km/sec. The speed of 97 radial and 34 transverse events are also shown in the middle and the bottom panel of Fig.4, respectively. The average speed of the R events (43km/sec) is close to that of the total population (38km/sec) whereas the average speed of the T events (21km/sec) is smaller than that of the total population. The maximum speed attained by the prominence within the NORH field of view (FOV) is only ~200km/sec which is much smaller than the escape velocity at the solar surface (620km/sec). This result is similar to that of Gilbert[7]. In Fig.4, the distributions are remarkably similar to those in Fig.5, the average speed of prominence associated CMEs is 46 km/sec and those without CMEs is 31 km/sec. This result is very close to radial and transverse events. Fig.6. is a scatter plot between the final height reached by the prominences and speed. There is a clear trend of faster prominences reaching greater heights (the correlation coefficient being 0.27). In[15] the correlation coefficient was reported to be 0.62. In our case (during 2002-2008) weak correlation is found.
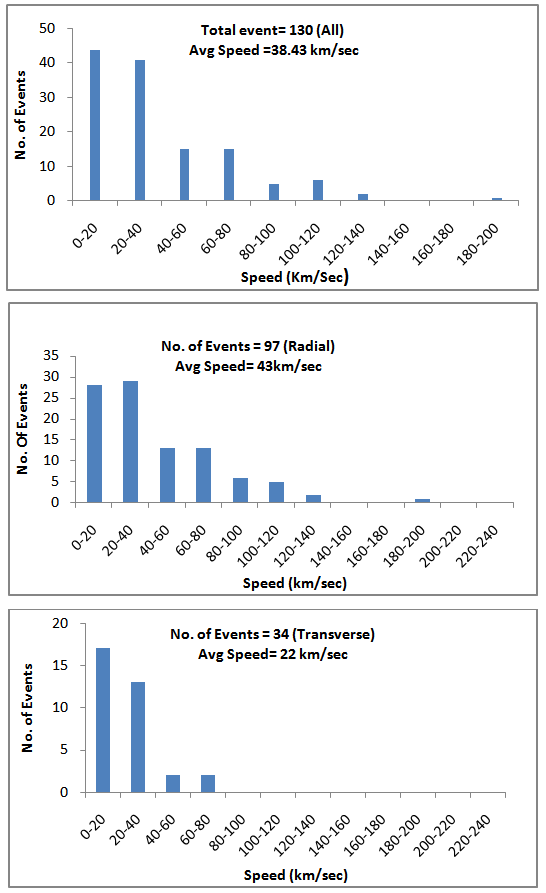 | Figure 4. Average speed to maximum of the prominence eruption events: all events (top); radial events (middle); transverse events (bottom) |
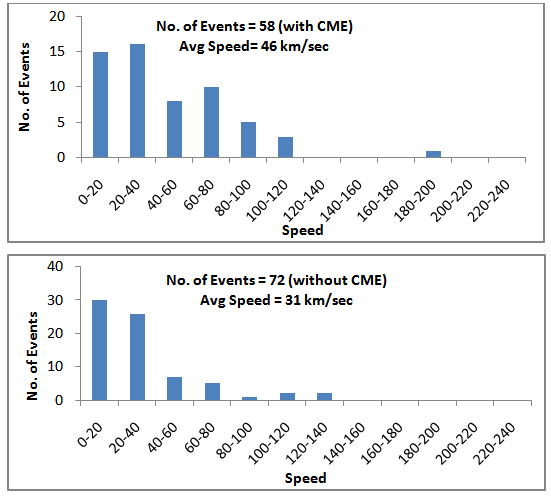 | Figure 5. Histograms of the maximum speed reached by prominences: events associated with CMEs (top); events not associated with CMEs (bottom) |
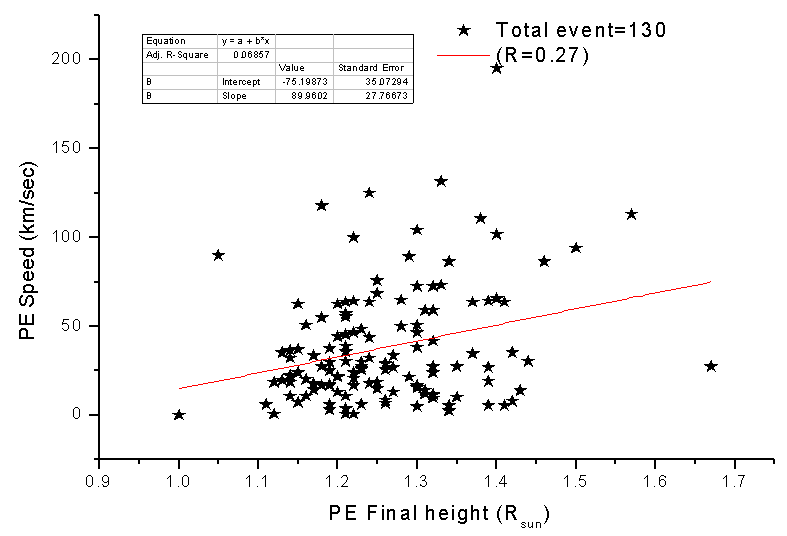 | Figure 6. Relation between the average speed of prominences and their final height. As expected, the T events are below the straight line. This straight line is a fit to the data points |
4. Relation between Prominence and CMEs Eruptions
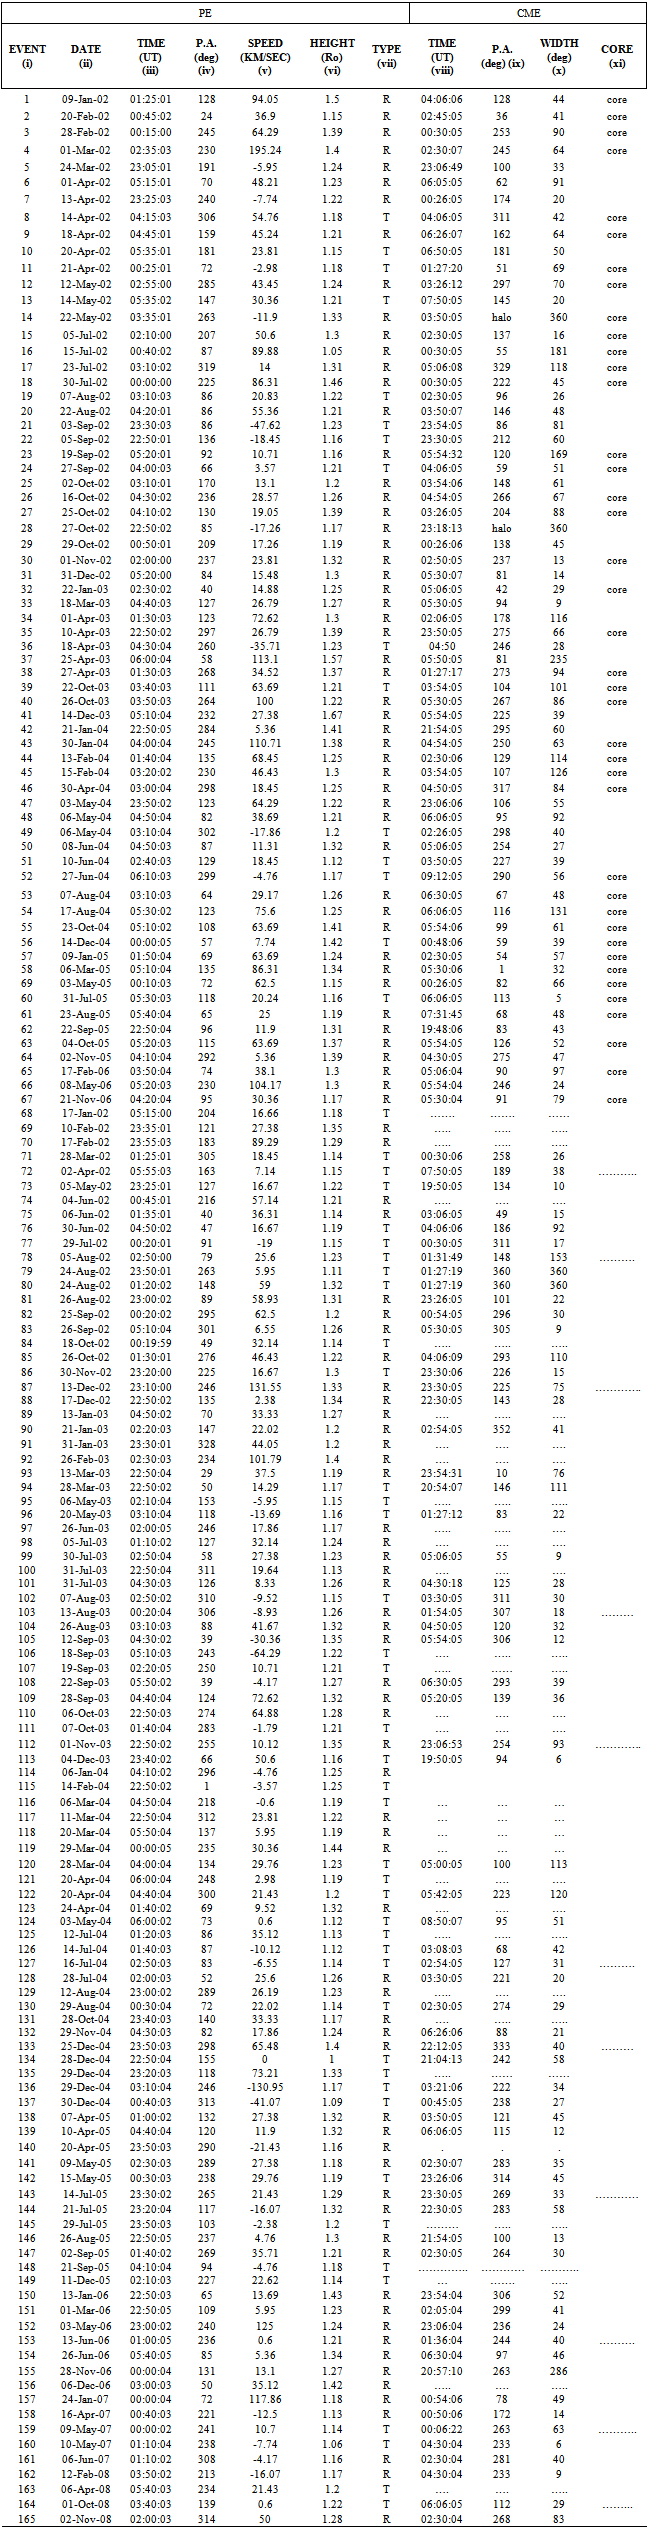
- Gopalswamy[15] chose the period 1996-2001 (close to the beginning of solar cycle 23) for the study of the association between prominence eruption and CMEs from the minimum to the maximum phase of the solar cycle 23. Here we take the study period (2002-2008) to the association between PEs and CMEs (close to the end of solar cycle 23). Both radio and white-light data can be viewed as movies, which help in establishing the position angle (P.A.) and temporal correspondence between PEs and CMEs. Table-1 compares the measured properties of the prominence eruptions and those for the associated with CMEs. The table shows all the PEs with their date, time, P.A., speed, final height, and the event type (Radial or Transverse) in columns (ii)-(vii), respectively. In columns (viii) -(x) we indicate the CME time, P.A., and width. In column (xi), we mention that the associated CME has a core feature. In Table-1, Non- color events denote the absence of CME.Here we take out the two examples to show the relationship between prominence and CMEs, one with and another without associating. One of the eruptive prominences (2004 6 May) is shown in Fig 7. In Fig 7 (a), the prominence rises slowly from an initial height of 1Ro and accelerated (-155m/sec2) to attain a speed of ~58km/sec by the time of its ends at a height of 1.17Ro. Fig 7 (b) shows. The corresponding white-light CME observed by Soho/Lasco. The white-light CME was very fast (277km/sec) and showed a slight acceleration, when we used the C2 data alone, consisting with the prominence height-time profile. Figure 8 shows the 2002 June 6 prominence eruption from above the northeast limb. It is a well observed event with an initial height of 1.06Ro and maximum height of 1.18Ro, and reaches to the final height of only 1.16RoThe SOHO/LASCO images show that there is no discernible change around the central position angle of the eruptive prominence.
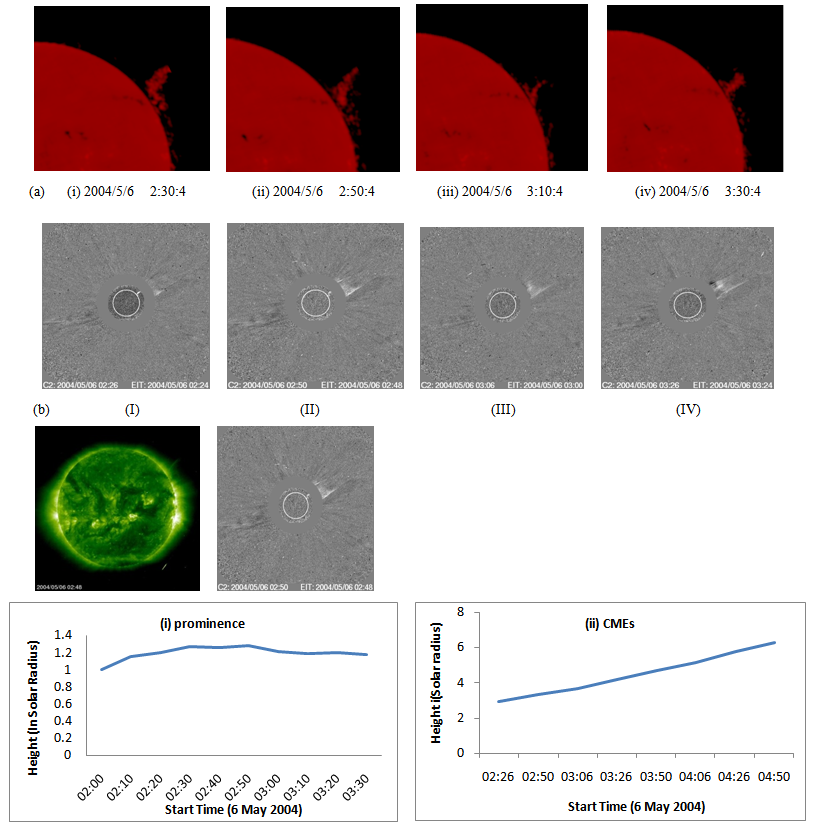 | Figure 7. (a) Eruption of the 2004 may 6 microwave prominences from the west limb (top panel). (b) SOHO/LASCO images at several instances (middle panel). Height-time plots of the Prominence and CME, respectively (bottom panel) |
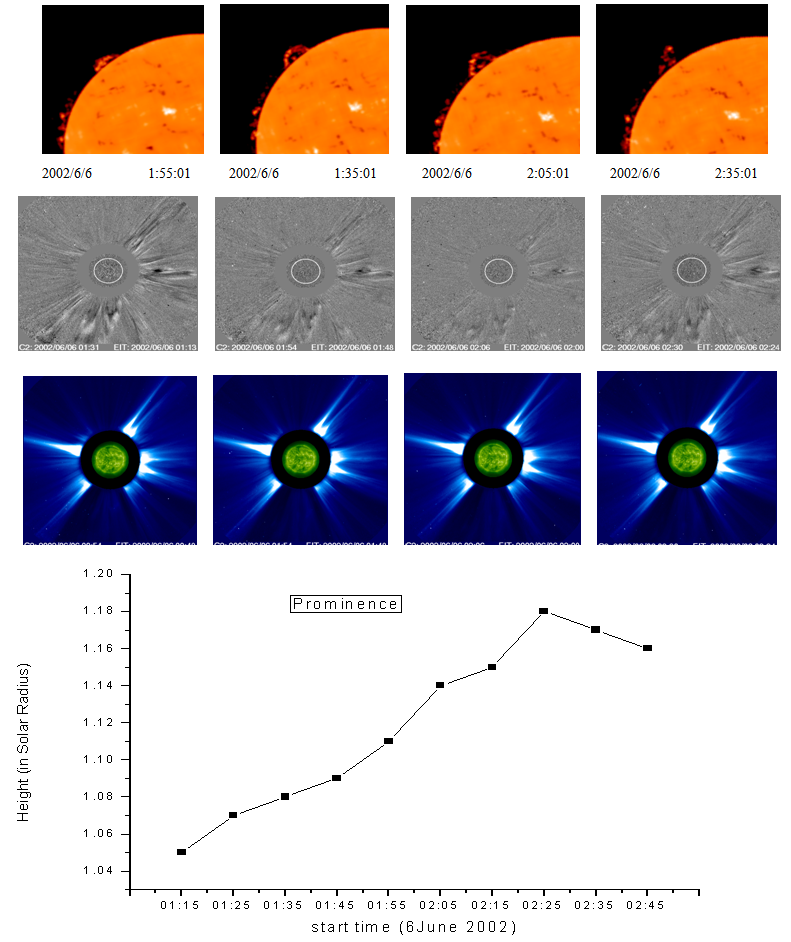 | Figure 8. Shows the comparison between microwave and white-light images corresponding to the 2002 June 6 prominence eruption event (Top panel). The prominence rises from the northeast limb and then moves northward (parallel to the limb) before fading out (Middle panel). LASCO C2 running difference images showing no changes along the position angle of the prominence and the same in SOHO/LASCO EIT images in the bottom panel. In the last graph the height-time plots of the prominence eruption are shown |
4.1. Latitudes
- We find out the Position angle of prominence with the help of coordinate x and y.x= rcosθ, y= rsinθΘ= tan-1 (y/x).We converted the observed P.A. of the PE and CME events to heliographic latitudes. For example a prominence eruption from P.A. = 90 or 270 will be considered to have zero latitude, from P.A. = 0 or 360 it will be considered to be originated from a latitude of 90, and so on. Figure 9 represents the latitude distributions of all the prominences along with those associated with CMEs. The latitude distributions of the prominence exhibit two peaks corresponding to negative latitudes, although events are found from almost all latitudes. Eight events occurred close to the equator. The latitudinal distribution of the CMEs does not show the double peak. Only one broad peak is found close to the equator (originated from -300 or -400 latitudes). The largest bin in the CME latitude distribution is centered on the equator. However, as in the case of prominence eruption, CMEs originates from almost all latitudes.
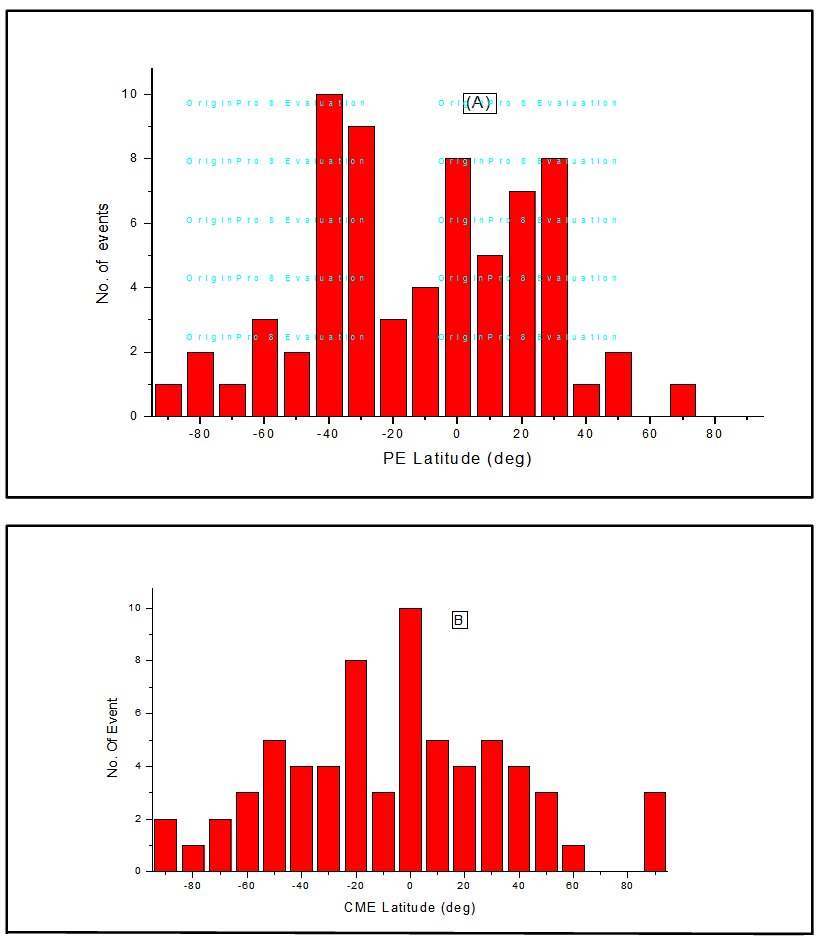 | Figure 9. Show the latitudinal distribution of the prominences and corresponding CMEs (A) and (B) |
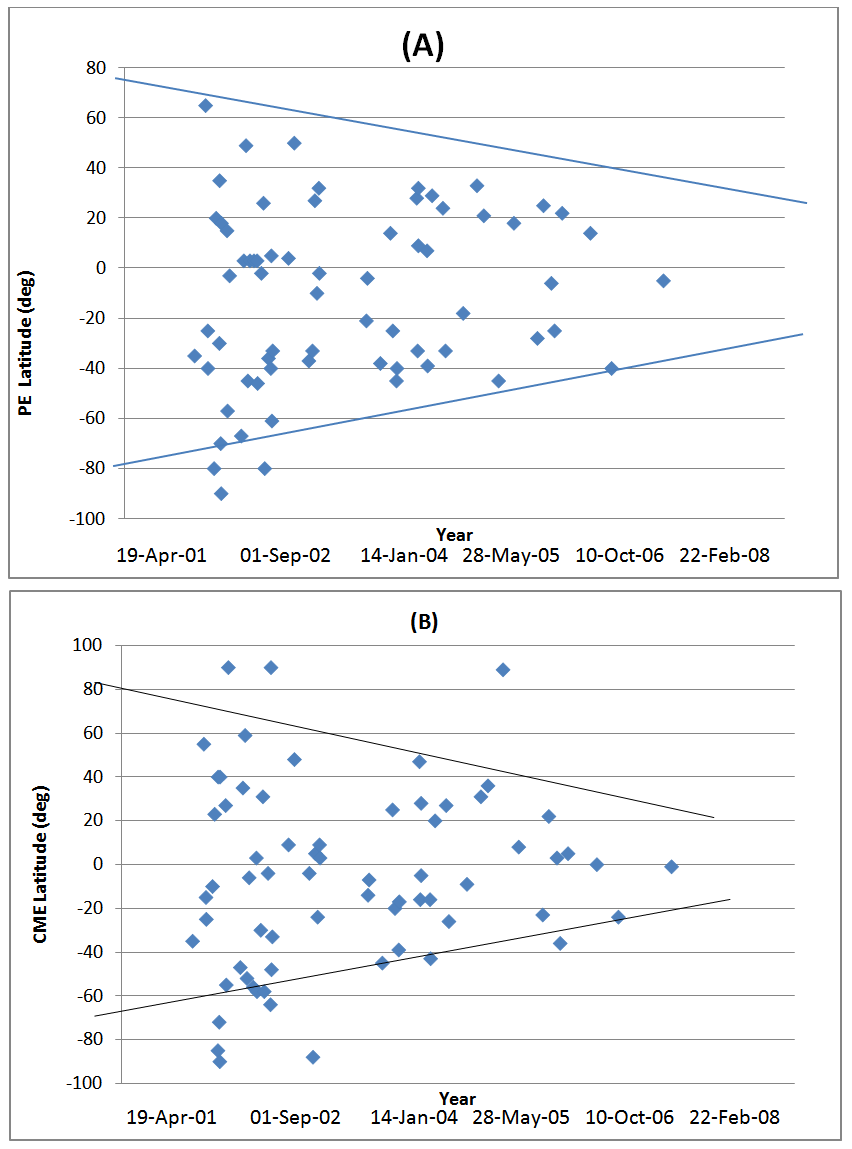 | Figure 10. (A) Another view of the plot in Fig. 9, but showing the solar cycle variation of the latitude of prominence eruption. (B) Latitude of the CMEs corresponding prominence as a function of time |
4.2. Timing and Spatial Relationship between CMEs and Prominence Events
- We measure the difference between the onset time of the prominence and that of the associated CMEs. Fig.11 (A) shows the difference between the onsets times of prominences and CMEs. Here we have omitted some events with negative speeds because we do not have any idea about their actual onset times. Onset time is the beginning time for the both the events. Projection effects may also introduce some uncertainty in the onset times. With these cautionary notes, we recognize that the onset times of the prominence and CMEs are roughly the same, within ±0.5 hr. to 1hr. This seems to be true independent of the phase of the solar cycle, as it is clear from Fig.11 (B). In Fig.11 (A) more events with negative onset are shown. Negative onset means that CME onset precedes PE onset. Fig 11 (B) shows the solar cycle variation of onset time difference of both events and it is clear that the maximum events occur in the period 2002-2004.On the basis of latitudes, we define the spatial relationship between the PEs and CMEs. The latitudes were obtained from the position angles of the events. Fig.12 (A) shows the difference between the PEs and CMEs latitudes. Negative value means that the prominence is at lower latitudes than CME and vice-versa. Note that there are more events with negative offset. This result is similar to that of Fig 9. This implies that the position-angle correspondence between PEs and CMEs has solar cycle dependence: during period 2002-2008 the PEs start at lower latitudes and the corresponding CMEs appear at higher latitudes. This effect is also shown in Fig 12 (B). The maximum events occur during 2002-2005. Note that up to the end of 2006, the CME latitudes are clearly centered toward the equator. Beyond that there is no systematic offset. The negative PE-CME offset is also thought to be an indicator of the strong polar field[15, 38].
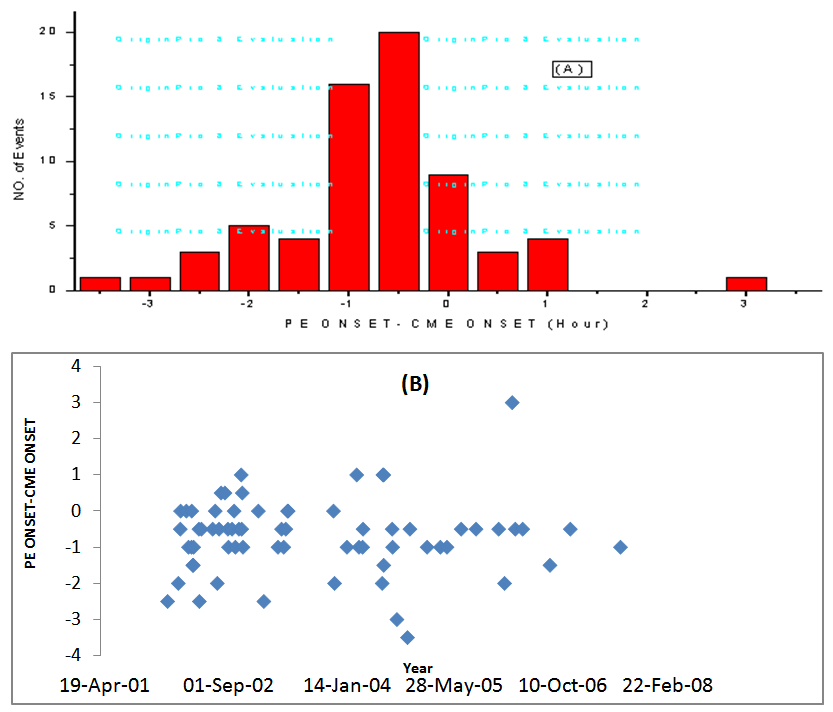 | Figure 11. (A) Comparison between the onset times of the prominence and CME events. Negative numbers mean that precede PE onsets. (B) Solar cycle variation of the onset time differences |
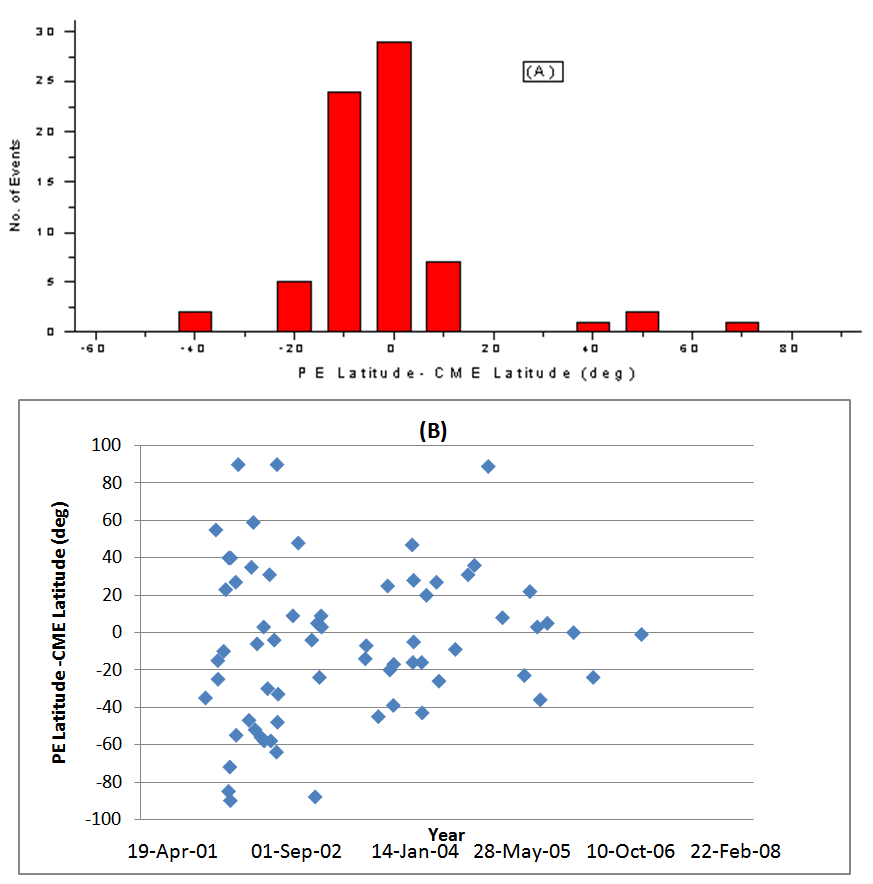 | Figure 12. (A) Positional relationship between CMEs and PEs as a difference in CPAs. (B) Solar cycle variation of the P.A. offset |
4.3. Core association
- We have also investigated the fraction of CMEs that show a visible core feature (see Table-3), which is generally taken as an indication of prominence material. A core is the bright central region in the dark cavity trailing a CME front[30]. Out of 108 prominences (active and eruptive) we find 68 are associated with CMEs, and 40 of those 68 CMEs (59%) had visible core material. While considering EP and AP core association separately, we find that 33 of 53 (62%) of the CMEs associated with EPs had cores, while only 7 out of 15 (46%) of the CMEs associated with APs had cores. This result is similar to[7], where 15 of 29 (52%) had visible core material. In our set of data we have compared the white-light cores with the corresponding microwave prominences. We find that out of the 68 CMEs identified to be associated with the prominences, 40 (59%) had clear white light cores. This rate is slightly lower than the 65% reported by[20] and 73% reported by[15].
|
5. Discussion and Conclusions
- One of the primary goals of this paper has been to differentiate characteristics of active and eruptive prominences. Let us begin by considering the maximum height of prominence, as stated earlier, the average height of all events (165) is 1.24Ro. These events are divided into two groups-- radial and transverse. The average height of R and T events are 1.27Ro and 1.18Ro, respectively. It is clear that the average maximum height of the radial events is greater than that of transverse events[7, 15]. It is found that the average height of PEs with CMEs (68) is 1.27Ro and without CMEs (97) is 1.22Ro. This result is similar to the R and T events. Clearly the height of PEs associated with CMEs is larger than those without CMEs.The histogram of prominence speeds shows that the average speed of total events (130) is 38.43km/sec. The radial and transverse events have speeds 43 and 22km/sec, respectively. Thus, the average speed of R events is greater than that of transverse events. The average speed of PEs associated with CMEs is 46km/sec and that of PEs without CMEs is 31km/sec, similar to the R and T events. The correlation coefficient between the maximum height and speed of prominences is 0.27. That is, during solar cycle 23 (2002-2008), the heights and speeds of prominences is weakly correlated.The histograms of latitudes of PEs and corresponding CMEs are shows that around solar minimum the PEs and corresponding CMEs tend to occur at lower latitudes and the apparent latitudes increase around solar maximum. Further, roughly the same number of PEs and corresponding CMEs are ejected from close to the equator. The number of such prominences and corresponding CMEs was larger in the southern hemisphere. The distribution of PEs and corresponding CMEs is non-symmetrical about the equator. During the period 2002-2008 the number of prominences having latitudes in between ±30° is larger than those lying outside. During the maximum of solar cycle 23, the PEs and corresponding CMEs latitudes exhibit two peaks, one in 2000 and another in 2002. The histogram of prominence and CME onsets shows the time difference between PEs and CMEs. The difference is taken from the initial time of both events. We note that the maximum number of events occur in the southern hemisphere between time interval ±0.5 hr. to -1hr. The difference of PEs and CMEs latitudes offsets shows that the maximum events occur in the southern hemisphere between latitudes 0° to -20°. 29 events occurred close to the equator.The matter presented above leads us to conclude the following:-(1) NORH observed 165 PEs of all types during the period 2002-2008 forming solar cycle 23. A Comparison with SOHO/LASCO data shows that 68 (41%) prominences are associated with CMEs and 97 (59%) prominences are not associated with CMEs. This result is consistent with two previous studies[19, 21] who concluded that only 10% to 30% PEs were associated with CMEs. This result is different from four previous studies[9, 7, 20 and 22]. The reason of the poor association is that only 39 events occurred during 2005-2008.(2) In our study out of 165 events, 110 (66%) are radial events and 55 (33%) are transverse events. In[15] found that out of 186 events, 152 (82%) were radial event, while only 34 (18%) were transverse events during the period (1996-2001) which differs from the present values, significantly.(3) In our study only 32% R events and 10% T events are associated with CMEs. Our result shows a poorer association as compared to the results of[15] and[7].(4) In our study 62% of CMEs associated with EPs (R events) had cores, while only 46% of the CMEs associated with APs had cores. This result is similar to the previous three results[20, 7, and 15].(5) The average height of R and T events is 1.27Ro and 1.18Ro, respectively. Gopalswamy[15] found the average height of R and T events as 1.40Ro and 1.16Ro and Gilbert[7] found the average height as 1.45Ro and 1.16Ro, respectively. All these results agree with each other. Gilbert[7] further concluded that 100% of EPs reached at least 1.1Ro; which agree with our study where 99% of EPs attained a height of 1.1Ro.(6) The average speed of R and T events is 43km/sec and 22km/sec, respectively. The average speed during (1996-2001) obtained from[15] is 64km/sec and 10km/sec, respectively which differs from the present values, significantly.(7) In our data the correlation coefficient for maximum height and the average speed is 0.2 whereas Gopalswamy[15] have the value is 0.62. These results seem to contradict each other. (8) We find that the onsets of PEs and CMEs are nearly simultaneous; the two events are separated by within ~30 minutes to 1hour. There is no solar cycle dependence of the temporal relationship. This result may have important implications for the theories of CME initiation.(9) We have also studied the spatial relationship between PEs and corresponding CMEs. We define the spreading of the source locations of CMEs and PEs at all latitudes towards the solar maximum. There is a solar cycle dependence of the spatial relationship. During the solar minimum, the central position angle of the CMEs tends to cluster around the equator as compared to that of prominence.
ACKNOWLEDGEMENTS
- The authors are thankful for Meerut College, Meerut for their cooperation. The authors are thankful to IUCAA, Pune and ARIES, Nainital for their financial assistance. The authors thank the SOHO/LASCO consortia for providing the data used in this analysis. SOHO is a project of international cooperation between ESA and NASA. We also acknowledge the Nobeyama Radio Heliograph consortia for providing the data.We are also thankful to Dr. Wahab Uddin of ARIES and N. Gopalswamy for their kind help in the present study.The authors are very much grateful to the referees for providing constructive comments.
References
| [1] | Alejandro Lara, Rogelio Caballero, and Eduard Mendoza, AIP Conf. Proc. 895, 153 (2007). |
| [2] | Pettit, E. 1925, Pub. Yerkes Obs., 3, IV, 205. |
| [3] | 1932, ApJ, 76, 9. |
| [4] | 1936, ApJ, 84, 319. |
| [5] | 1943, ApJ, 98, 6. |
| [6] | 1950, PASP, 62, 144. |
| [7] | Gilbert, H. R.; Holzer, T. E.; Burkepile, J. T.; Hundhausen, A. J. ApJ, 537, 503, (2000). |
| [8] | Tandberg-Hanssen, E. 1995, The Nature of Solar Prominences, Kluwer, Dordrecht |
| [9] | Munro, R. H, Gosling, J. T., Hildner, E., et al. 1979, Sol. Phys., 61, 201. |
| [10] | St. Cyr, O. C. and Webb, D. F. 1991, Sol. Phys.,136, 379. |
| [11] | Lin, J., Soon, W., and Baliunas, S. L., New Astron. Rev. 47, 53-84, (2003). |
| [12] | Aschwanden, M.J., Burlaga, L. E, Kaiser, M. L.,et al. Space Science Reviews, (2006). |
| [13] | De Jager, C. 1959, Handbuch der Physik, 52, 80. |
| [14] | House, L. L., Wagner, W. J., Hildner, E., Sawyer, C., and Schmidt, H. U. 1981, ApJ, 244, L117. |
| [15] | N. Gopalswamy, M. Shimojo, W. Lu, S. Yashiro, K. Shibasaki , and R.A. Howard. 2003, APJ, 586: 562-578. |
| [16] | Filippov, B. P. 1998, in New Perspectives on Solar Prominences (IAU Colloquium 167), ed.D. Rust, D. F. Webb, and B. Schmieder, Vol. 150, p. 342. |
| [17] | Gopalswamy, N., & Hanaoka, Y. 1998, APJ, 498, L179 |
| [18] | Gopalswamy, N. 1999, in Proceeding of the Nobeyama Symposium., ed. T. S. Bastin & K. Shibasaki , NRO Rep. 479, 141. |
| [19] | Wang, H., & Goode, P. 1998, in ASP Conf. Ser. 140, Synoptic solar physics, ed. K. S. Balasubramanian, J. W. Harvey, & D.M. Rabin (San Fransico: ASP), 497. |
| [20] | Hori, K.; Culhane, J. L., A&A, 382, 666-677, (2002). |
| [21] | Yang, G., & Wang, Y. 2002, in proc. COSPAR Colloq., Ser. 14, Magnetic Activity and space Enviorment,ed. H.N. Wang & R.L. Xu (Boston Pergamom)113. |
| [22] | Nishant Mittal, Proceeding IAU Symposium No. 274, 2010, Advances in plasma Astrophysics. |
| [23] | Nakajima, H, Nishio, M., Enome, S, et al., Jrnl. Astrophysics & Astron., 16, 437, (1995). |
| [24] | Shimojo, M., Yokoyama, T. Asai, A., Nakajima, H. and Shibasaki, K., PASJ, 58, 85-92, (2005). |
| [25] | Brueckner, G. E., R. A. Howard, M. J. Koomen, et al. Solar Physics, 162. 357-402, (1995). |
| [26] | Yashiro,S., Gopalswamy, N., Michalek, G., Rich, N., St.Cyr, C. O., Plunkett, S. P., & Howard, R. A. 2004, J. Geophys. 109. |
| [27] | Ananthakrishnan, R. 1961, ApJ, 133, 969. |
| [28] | Hundhausen, A. J. 1999, Many Faces of the Sun, ed. K. T. Strong, J. L. R. Saba, and B. M. Haisch, Springer-Verlag, New York, p. 143. |
| [29] | Cliver, E. W. & Ling, A. G. 2001, ApJ, 551, L189. |
| [30] | Brueckner, G. E., R. A. Howard, M. J. Koomen, et al. Solar Physics, 162. 357- 402, (1995). |
| [31] | Maricic, D., Vrsnak, B., Stanger, A. L., and Veronig, Sol. Phys., 225, 337- 353, 2004. |
| [32] | Forbes, T.G.: 2000, J. Geophys. Res.105, 23153. |
| [33] | Ali, S.S., Uddin, W., Chandra, R.: Mary, D.L., Vrsnak, B., Sol. Phys., 240, 89-105, 2007. |
| [34] | Low, B.C.: 1996, Sol. Phys. 167, 217. |
| [35] | Priest, E.R., Hood, A.W., Anzer, U.: 1989, Astrophys. J. 344, 1010. |
| [36] | Webb, D.F., Howard, T.A., Living Rev. Sol. Phys., 9, (2012), 3. |
| [37] | Filippov, B.,Koutchmy, S., Ann. Geophys., 26, 3025-3031, 2008. |
| [38] | Gopalwamy, N., Yashiro, S., Makela, P., Michalek, G., Shibasaki, K., Hathaway, D.H., ApJ., 750: L42 (6pp), 2012. |