Tarif Rashid Santo1, Syed Ashraf Uddin2
1Department of Electrical and Electronic Engineering, Green University of Bangladesh, Dhaka, 1207, Bangladesh
2Centre for Astrophysics and Supercomputing & ARC Centre of Excellence for All Sky Astrophysics, Swinburne University of Technology, Melbourne, Australia
Correspondence to: Tarif Rashid Santo, Department of Electrical and Electronic Engineering, Green University of Bangladesh, Dhaka, 1207, Bangladesh.
| Email: |  |
Copyright © 2012 Scientific & Academic Publishing. All Rights Reserved.
Abstract
The spiral arms of Milky Way can be observed at a rest wavelength of 21cm emission that is produced by the hyperfine transition of the electrons in atomic hydrogen. An observation was carried out from galactic longitude 0° to 225° at the galactic plane. Using the velocity components of the hydrogen clouds locating at different galactic longitudes, as a function of distance from the center of the galaxy, the spiral arms were plotted. The whole observation was carried out in frequency switching mode using the remotely operated SALSA-Onsala 2.3m Radio Telescope located at Onsala Space Observatory, Sweden.
Keywords:
Milky Way Galaxy mapping, 21cm Hydrogen Emission, Galactic Spiral Arms Detection
Cite this paper: Tarif Rashid Santo, Syed Ashraf Uddin, Mapping the Spiral Structure of the Milky Way Galaxy at 21cm Wavelength Using the SALSA Radio Telescope of Onsala Space Observatory, International Journal of Astronomy, Vol. 2 No. 3, 2013, pp. 37-42. doi: 10.5923/j.astronomy.20130203.03.
1. Introduction
The 21cm radiation from galactic atomic hydrogen can be used to study the features of the Galaxy that are visibly obscured by gas and dust. This radiation (1420MHz) penetrates the gas and dust prevalent in the galaxy. The 21cm emission was first predicted by H.C. Van de Hulst (1945)[1]. After his suggestion Ewen & Purcell (1951)[2] first detect this line from Milky Way. In the same year Muller and Oort[3] also observed this line. Christiansen and Hindman (1952)[4] had detected this emission from Australia. Later in 1954 the first systematic observation was made by Van de Hulst, Muller & Oort (1954)[5]. They made a survey of the structure of the Milky Way at the galactic plane using a 7.5 m parabolic antenna with beam width of 1.9° in horizontal direction and 2.7° in vertical direction. Then Muller & Westerhout (1957)[6] made an extended survey to cover ±20° latitudes from the galactic equator and longitudes from 318° to 220°. Their work provides a 21cm line profile catalogue in that region. In light of their work we undertake our observation to reveal the structure of the Milky Way in different galactic longitudes at the galactic plane (galactic latitude=0°) using the SALSA-Onsala 2.3m radio telescope. In this paper we have discussed how the complex galactic geometry is reduced to a form of containing observable parameters, how the observation was made, data reduction process and finally using the observed values how the spiral arms of the galaxy were revealed. We also have discussed about the errors and limitations of the observation and the works that can be done in the future.
2. Theory
2.1. Hyperfine Splitting of Atomic Hydrogen
A neutral hydrogen (HI) atom has one proton and one electron. The hyperfine splitting of hydrogen arises from the magnetic field produced by the proton acting on the electron. The following derivation closely follows Griffiths[7]. The magnetic moment of the electron is, | (1) |
Where e is the charge of the electron, me is the mass of the electron and Se is the spin of the electron. Similarly the magnetic moment of the proton is, | (2) |
Here, g is the g-factor whose measured value is 5.59. According to classical electrodynamics the magnetic field produced by a dipole (proton) is, | (3) |
The Hamiltonian of the electron in the magnetic field due to the proton’s magnetic dipole moment is, | (4) |
According to perturbation theory the first order correction to the energy is the expectation value of the perturbing Hamiltonian with the wave functions of the unperturbed Hamiltonian. When the wave function is spherically symmetric the first term of the expectation value vanishes, leaving, ħ | (5) |
Here  is the permittivity of free space and
  is the permeability of free space. The spin spin coupling is the dot product
 . Using total spin states, the perturbation expectation value can be written in terms of Eigen-operators as follows,
 | (6) |
But the electron and proton both have spin, so . In the triplet state the total spin is 1 and
 ; in the singlet state the total spin is 0 and
 . Thus,
 | (7) |
The spin spin coupling breaks degeneracy of the ground state, lifting the triplet configuration and depressing the singlet. The energy gap is evidently, | (8) |
The frequency of the photon emitted in a transition from the triplet to the singlet state is, | (9) |
The 21cm radiation produced from the hyperfine transition is highly forbidden. In a single hydrogen atom the transition occur approximately once per  years. But the enormous amount of hydrogen in the spiral arms of the Milky Way makes the radiation observable at any given time and can be easily detected by radio telescopes.
2.2. Galactic Geometry
The geometry behind the observation of the Milky Way is simplified in the Figure 1. 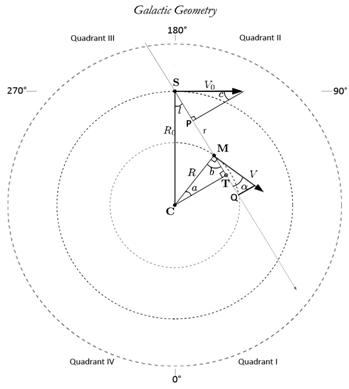 | Figure 1. Simplified Geometry of the Milky Way Galaxy |
As we are observing the hydrogen clouds located at the tangential points of the galactic plane at different longitudes, the radial velocity of a given cloud is, | (10) |
Where, V is the velocity of the cloud and V0 is the velocity of the Sun around the Milky Way. This equation can be simplified to this equation, | (11) |
Where R0 is the distance between the Sun and galactic center, R is the distance between the H. cloud and galactic center and  is the galactic longitude of the HI cloud. We assume that the elements in the galaxy obey differential rotation, which states that the circular velocity is constant with radius, means
  . From the above equation we can determine the value of
 . So we can write,
 | (12) |
Assuming kpc and
  km/s, we can calculate the value of
  for different values of longitude
 . From the figure 1 we see that in the Quadrant I and IV, there can be two possible locations of the H. clouds corresponding to given values of
  and
and , but in the Quadrant II and III the location would be unique[8]. Now applying law of cosines in triangle CSM we can write,
 | (13) |
Here, r is the distance of the H. cloud from the sun, which can be determined from this equation, | (14) |
From this second order equation we get two different values of. The negative values and two positive values are discarded. Only the single positive values are taken from which the Cartesian values are calculated using the equations below, | (15) |
 | (16) |
Calculating the values of  and
and  for different velocities at different longitudes we plot them in a graph to reveal the map of the galaxy.
3. Observation
This observation was conducted using the SALSA-Onsala Radio Telescope located at Onsala Space Observatory, Sweden[9]. The radio telescope was operated remotely from Dhaka, Bangladesh through internet. The antenna used for this experiment, named SALSA has a diameter of 2.3meter. The angular resolution of the antenna is about 7° at the frequency of the HI line (1420MHz). The receiver has a bandwidth of 2.4MHz and 256 frequency channels, each channel is 9.375 KHz wide[8]. The whole radio telescope is controlled by software named qradio installed into the controlling computer. The observation was done in frequency switching mode where the reference frequency was 1418.4MHz. 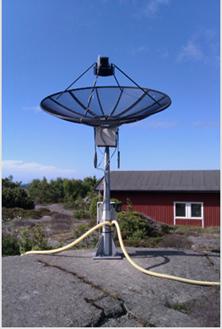 | Figure 2. SALSA 2.3 meter Antenna |
4. Data Reduction
The observation was made from 0° to 225° galactic longitudes at the galactic plane (latitude=0°) maintaining 5° steps. The spectra were taken with integration time of 120 seconds to detect weaker HI lines. The Doppler shifted frequency spectra were then calculated to get the velocity components in each point of a spectrum using the Doppler shift equation, | (17) |
Where is the observed frequency,
  is the rest frequency we are observing,
  is the velocity of the HI clouds &
 is the velocity of light. Thus the each frequency spectrum was converted to the velocity scale. Then the base line was corrected for each spectrum. The individual spectrum was then smoothed by Gaussian fit using the function shown below,
 | (18) |
Where is the amplitude,
  is the center location, is the peak width,
  is the number of peaks to fit. The whole reduction process was done with the help of SalsaJ software[9]. The gauss fitted line profile of HI in 21cm wavelength found from the observation is shown in Figure 3 and Figure 4.
 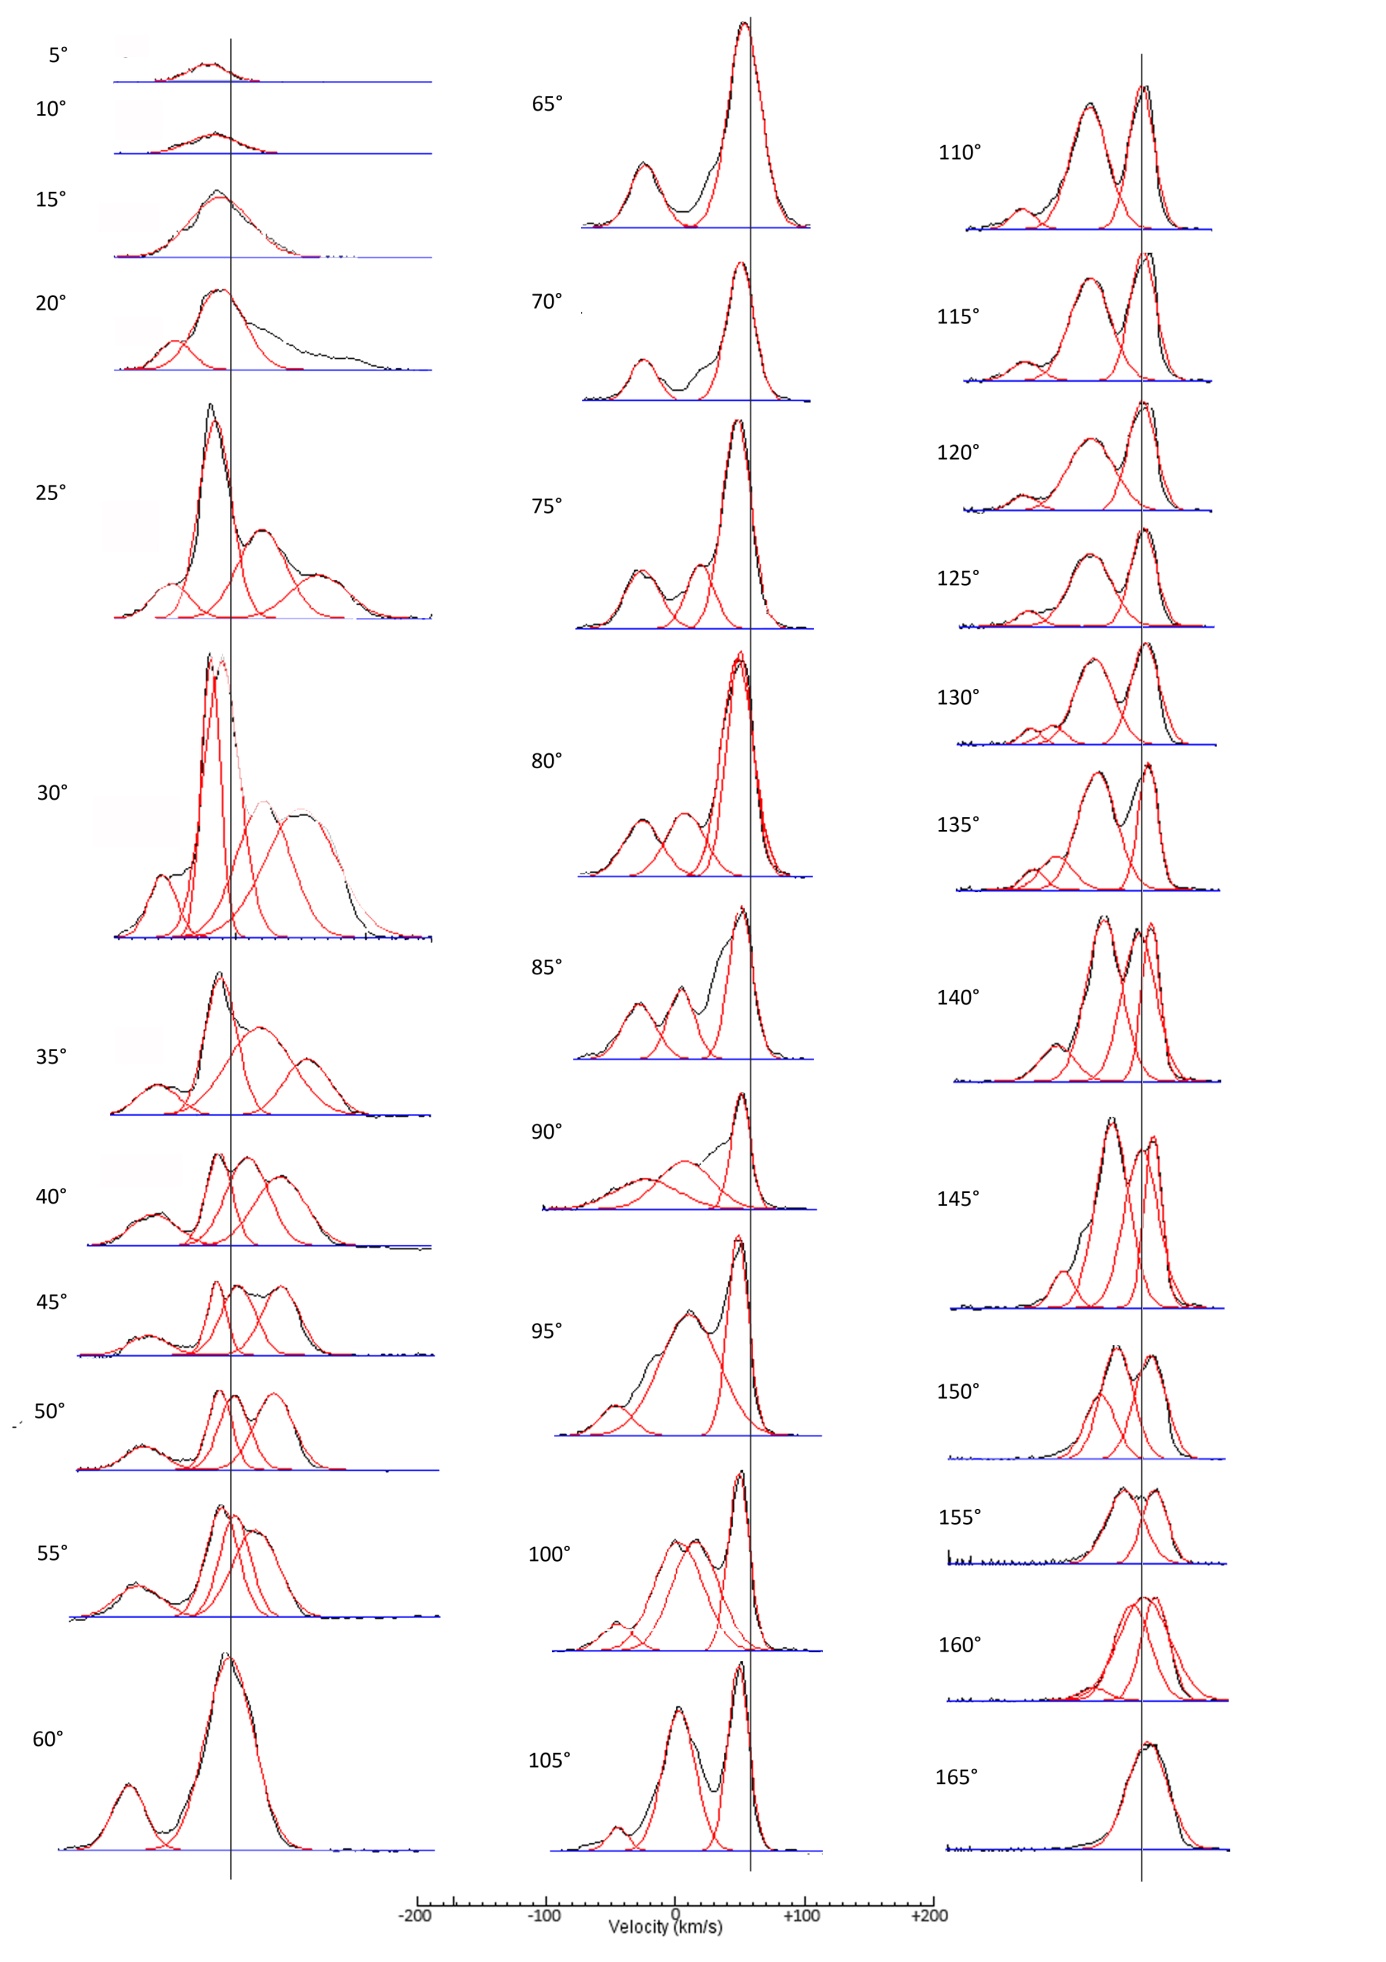 | Figure 3. Base line corrected (blue line) and Gaussian fitted line profiles (red) from 5° to 165° galactic longitude |
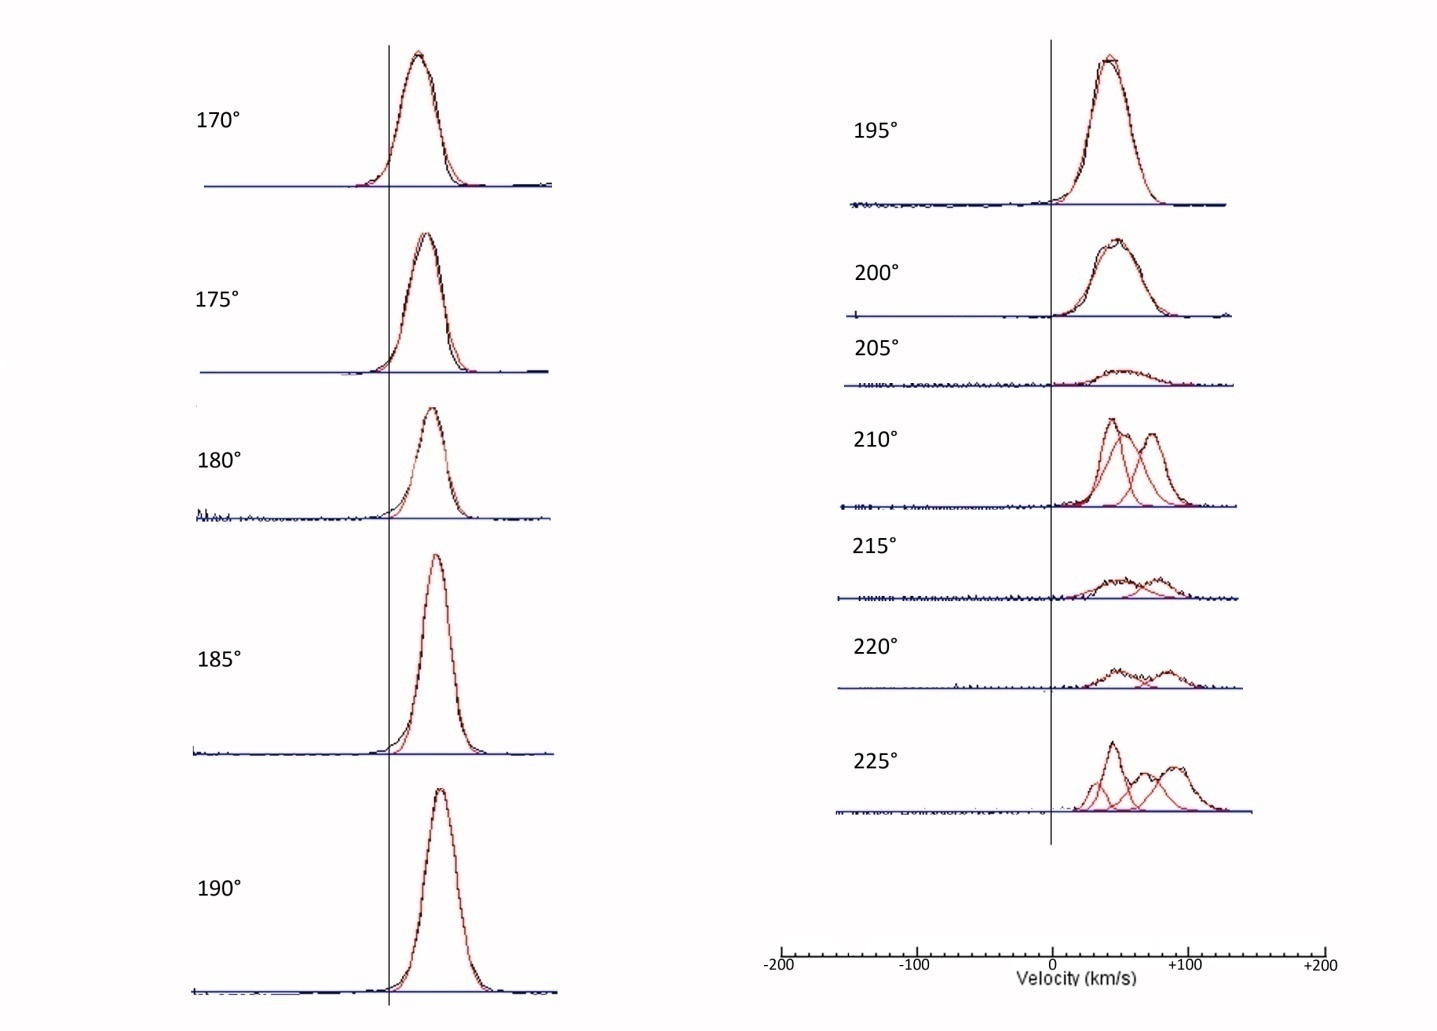 | Figure 4. Base line corrected (blue line) and Gaussian fitted line profiles (red) from 170° to 225° galactic longitude |
5. Result
Gaussian fit allows calculating the central velocity for each peak of the spectrum, which then used to calculate the values of R for different longitudes using the equation 12. Then they were used to find the values of r followed by the equation 14. Here each values of r are examined for validity. Then they were used to calculate the position of the hydrogen clouds in Cartesian coordinate system from equation 15 & 16.Table 1. Example of Some Values calculated using the reduced equation found from the observation
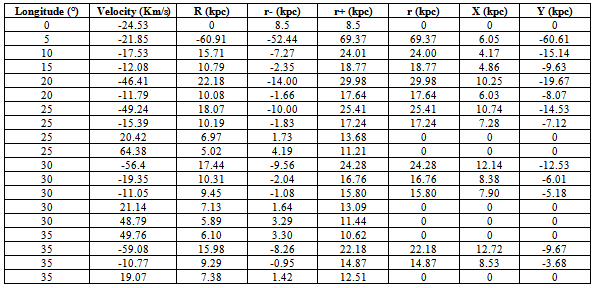 |
| |
|
Thus the structure of the Milky Way was plotted as shown in Figure 5. The Perseus arm and the outer arm are well detectable in the map. The Orion spur is merged with a small part of Perseus arm. The position of the Sun is to be in (0, 8.5) coordinate.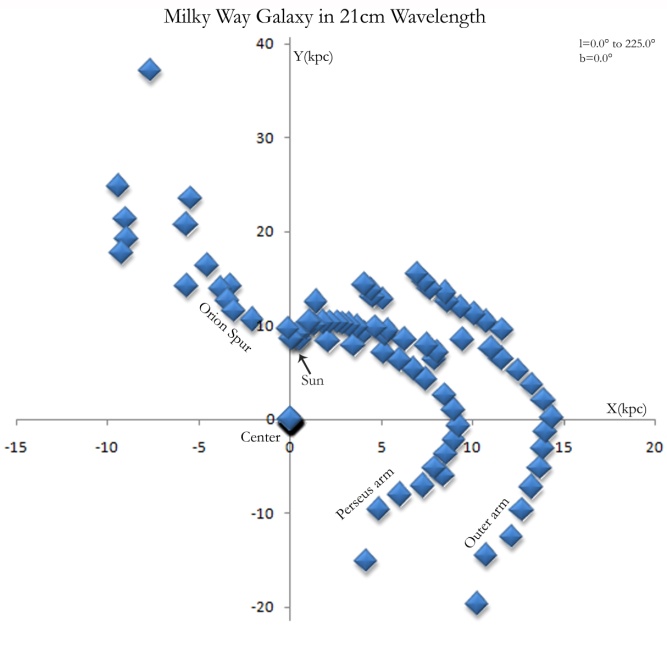 | Figure 5. Position map of the Hydrogen Clouds in the Milky Way observed in 21cm wavelength |
6. Errors and Limitations
The diameter of the antenna is small which causes lesser sensitivity of the radio telescope. But it is covered by using a sensitive receiver. Small diameter of the antenna also causes to get lower resolution. There was a great possibility to miss the weaker HI emission from lower density hydrogen clouds. It was not possible to observe above 225° galactic longitude because of the geographical position of the radio telescope. For this reason some parts of the Perseus arm and outer arm could not be observable. There may some errors in calculating central velocities from the spectra.
7. Conclusions
Observation of the hydrogen clouds to make the map of the Milky Way galaxy is performed successfully. The observation was carried out from galactic longitude 0° to 225° for the geographic limitation of the observation site. The position of the spiral arms and the overall structure matches with the previous works. From the map the galactic center, position of the Sun in the galaxy and the spiral arms are nicely detectable. In future we will observe the full structure (0° to 360°) of the galaxy including upper and lower latitudes to plot the three dimensional structure of the Milky Way using of a larger diameter antenna with advanced receiving system.
ACKNOWLEDGEMENTS
We are very grateful to Cathy Horellou, Professor of Chalmers University of Technology, Onsala Space Observatory. Special thanks to Daniel Johansson Dahlin and Mitra Hajigholi of Chalmers University of Technology, helping us to operate the radio telescope and providing useful information. Last but not least we would like to thank Amateur Radio Naimul Islam Opu (S21AO), who encouraged us through the whole experiment.
References
| [1] | C J Bakker, H C van de Hulst, 1945, Radiogolven uit het wereldruim, s-Gravenhage: Martinus Nijhoff. |
| [2] | Ewen, H.I., Purcell, E.M., 1951, “Radiation from galactic hydrogen at 1420 Mc./sec,” Nature 168, 356. |
| [3] | Muller, C.A., Oort, J.H., 1951, “The interstellar hydrogen line at 1420 Mc/s and an estimate of galactic rotation,” Nature 168, 357. |
| [4] | W.N. Christiansen, J.V. Hindman., 1952, “A preliminary survey of 1420 Mc/s. line emission from galactic hydrogen,” AuSRA, 5, 437C. |
| [5] | H.C. van de Hulst, Muller, C.A., Oort, J.H., 1954, “The spiral structure of the outer part of the galactic system derived from the hydrogen emission at 21-cm wavelength,” BAN. 12, 117. |
| [6] | C.A. Muller, G. Westerhout, 1957, “A catalogue of 21-cm line profiles,” BAN,13,151M, XIII, 475. |
| [7] | D. J. Griffiths, 2005, Introduction to Quantum Mechanics, Upper Saddle River, New Jersey: Pearson Prentice Hall. |
| [8] | http://brage.oso.chalmers.se/salsa/sites/default/files/radiosweden.pdf |
| [9] | http://brage.oso.chalmers.se/salsa/?q=node/10 |
 Abstract
 Reference
 Full-Text PDF
 Full-text HTML