-
Paper Information
- Paper Submission
-
Journal Information
- About This Journal
- Editorial Board
- Current Issue
- Archive
- Author Guidelines
- Contact Us
International Journal of Astronomy
p-ISSN: 2169-8848 e-ISSN: 2169-8856
2012; 1(5): 101-104
doi:10.5923/j.astronomy.20120105.04
Time Series Analysis of Variance of Sunspots in January till September 2010 and Correlation with Sunspots Areas
 Abstract
 Reference
 Full-Text PDF
 Full-text HTML
Z. S. Hamidi1, N. N. M.Shariff1, F. N. Zainal Ulum2, Z. Z. Abidin1, Z. A. Ibrahim1
1Department of Physics, Faculty of Science, University of Malaya, Lembah Pantai, 50603, Kuala Lumpur, Malaysia
2School of Physics and Material Sciences, Faculty of Applied Sciences, Universiti Teknologi MARA, Shah Alam, 40450, Selangor, Malaysia
Correspondence to: Z. S. Hamidi, Department of Physics, Faculty of Science, University of Malaya, Lembah Pantai, 50603, Kuala Lumpur, Malaysia.
| Email: |  |
Copyright © 2012 Scientific & Academic Publishing. All Rights Reserved.
This paper analyzed theoretically the short period variability of the sunspot activity beginning from January 2010 till September 2010. Sunspot data are taken from Solar Influences Data Analysis Center (SIDC). We focused on the number of sunspots each month and correlate it with sunspot are aparameter. From the analysis, it is found that there is a little correlation between the amplitude of a cycle. The pattern shown an almost linear relationship between both parameters. It also showed that the highest sunspot number per day that has been recorded is in May. The Sun was found to be most active in August and passive in April according to the number of sunspots. Uniquely, there is also no sunspot at all in a day. This study gives some interesting and potentially important clues especially in understanding the physical processes responsible for the solar activity and the solar cycle phenomena. Based on our analysis, we found that the average relation between sunspot number, R and sunspot area, A is A = 5.179R.
Keywords: Sun,Sunspots, Time Series Analysis, Solar Activity
Cite this paper: Z. S. Hamidi, N. N. M.Shariff, F. N. Zainal Ulum, Z. Z. Abidin, Z. A. Ibrahim, Time Series Analysis of Variance of Sunspots in January till September 2010 and Correlation with Sunspots Areas, International Journal of Astronomy, Vol. 1 No. 5, 2012, pp. 101-104. doi: 10.5923/j.astronomy.20120105.04.
1. Introduction
- The Sun is currently in its most quietest phase of the 11 year solar activity cycle. Based on this phenomenon, the Sun produces its unique effect on the earth’s magnetic field due to the low levels of solar activity. Sunspots are classified as a temporary phenomena occur on the photosphere of the Sun with a temperature of roughly 3000–4500 K that appear visibly as dark spots compared to surrounding regions.The sheaf of magnetic flux tubes standing in the photosphere, filling with umbra and fanning out above where the first recognized evidence of Sun’s intriguing complexity. It is widely known that the total area of all sunspots visible on the solar hemisphere is one of the fundamental indicators of solar magnetic activity. Meanwhile,it is believed that magnetic indicators play a fundamental role because intrinsic variations of the solar brightness on a time scale of days to decades. According to our current understanding, this phenomenon is caused by changes in the magnetic field at the solar surface[1,2,3,4,5]. Based on a consistent measurement since 1874, sunspot data provide a proxy of solar activity over more than 130 years that is regularly used to study the solar cycle or to reconstruct total and spectral irradiance at earlier times[6,7,8,9,10].Based on previous studies, the relationshipbetween total corrected sunspot area, A (in millionths of the visible solar hemisphere) and sunspot number R is not particularly good for daily values, although it has often been stated that the relationship becomes better when using an average of monthly or yearly. In fact, the claim has been made that for monthly or yearly averages the average relation between A and R is simply described as A = 16.7 R[11]. It was observed that in some cases, the scatter is significantly higher in such cycles, large areas are observed while R remains low when studying the relationship between A (sunspot area) and R (sunspot number) for individual cycles [12]. Consequently, the average size of sunspots or the average number of sunspots per group (or active region) would have been different in cycles 21 and 22 than in previous cycles [13].The variation of nine (9) months period of sunspot number and sunspot area is discussed on the basis of daily sunspot number in the 23rd solar cycle. In this work we examine: 1) the short term variability from January 2010 till September 2010 of sunspot number and sunspot area; and 2) investigate the correlation between both parameters and identify the unusual condition that might happen in solar activities.
2. Data Analysis
- Sunspot data from Solar Influences Data Analysis Center (SIDC) are used in this study. This catalogue holds records including date, sunspot number, sunspot area and class of association solar flare events. It also has compiled the longest and most complete record of sunspot areas. The SIDC includes the World Data Center for the sunspot index and for space weather forecasting. Averaged of latitudes and longitude of each sunspot group are employed to get the mean sunspot area. Area of the sunspot can be represented as the following equation:
 | (1) |
 | (2) |
3. Results and Analysis
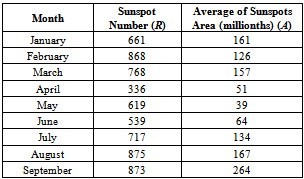
- For analysis and theoretical purposes, we selected data that were periodically collected from the NOAA SWPC website for a total of nine (9) months. Daily observation and analysis were made throughout this period. Table 1 showed the average value of sunspot average number, R and sunspot area (millionths), A of each month. We analyzed the data early of January till end of September 2010.
|
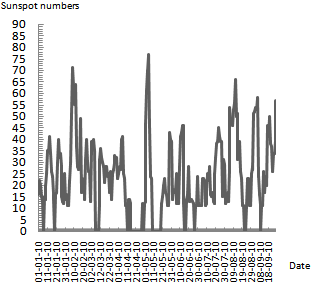 | Figure 1. The variability of sunspot numbers within nine (9) months |
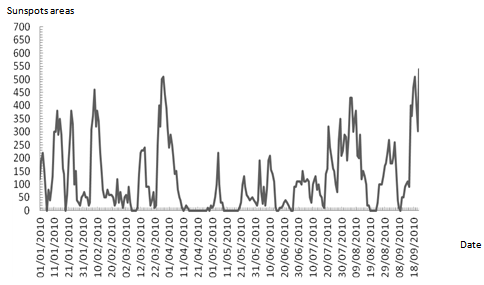 | Figure 2. The variability of sunspot area within nine (9) months |
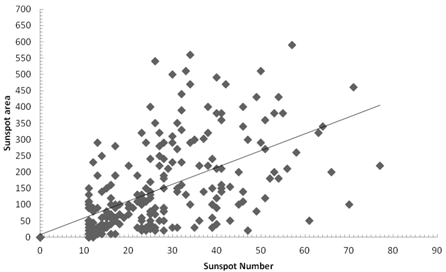 | Figure 3. The relationship between sunspot number and sunspot area within nine months |
4. Conclusions
- With regards to possible future work, the work presented in this paper has confirmed that correlation between sunspot number and sunspot area can predict solar and geomagnetic activity levels since eruptive events (solar flares, and sometimes coronal mass ejections which cause geomagnetic activity). One project in particular is to look at a number of sunspots from the beginning of the evolution which have corresponding on the significant pattern to try and understand the kind of similarity and compare the distribution and classify it so that it will could produce such a source/hint and whether the same cycle or not. As the new solar cycle commences we are bound to find a whole host of new and interesting events to study and new questions that need answered. In the near future we would like to continue this work by measuring the characterizations of sunspots in one cycle period by using Fourier analysis or wavelet analysis to investigate the daily, monthly and yearly sunspot number. Long term project also can be done and focus on the behavior of hemispheric sunspot number.We believe that our work is far from complete and we need to improve our understanding of the behavior of the Sun in order to predict the sunspot evolution patterns.
ACKNOWLEDGEMENTS
- The author would like to acknowledge The Ministry of Science, Technology and Innovation for supporting this work under Excellence Fund UiTM and PPP UM PV071/2011B grants. Sunspot analysis is a project of cooperation between UniversitiTeknologi MARA (UiTM) and University Malaya (UM). Also, we are grateful to the Solar Influences Data Analysis Center (SIDC) from which all of the data used in this paper were taken.