-
Paper Information
- Next Paper
- Paper Submission
-
Journal Information
- About This Journal
- Editorial Board
- Current Issue
- Archive
- Author Guidelines
- Contact Us
International Journal of Astronomy
p-ISSN: 2169-8848 e-ISSN: 2169-8856
2012; 1(5): 73-80
doi: 10.5923/j.astronomy.20120105.01
Study of High Energy Cosmic Ray Anisotropies with Solar and Geomagnetic Disturbance Index
 Abstract
 Reference
 Full-Text PDF
 Full-Text HTML
C. M. Tiwari, D. P. Tiwari
Dept. of Physics A. P. S. University, Rewa (M.P.) 486003, India
Correspondence to: C. M. Tiwari, Dept. of Physics A. P. S. University, Rewa (M.P.) 486003, India.
| Email: |  |
Copyright © 2012 Scientific & Academic Publishing. All Rights Reserved.
An inter-comparison of the first two harmonics has been made so as to understand the basic reason for the occurrence of cosmic ray anisotropies during the period 1989-2004 and 1991 – 2004 using the Neutron monitor data from and Haleakala Neutron Monitoring Stations. The annual average values of the first two (daily) harmonic amplitudes and phases for neutron monitor data due to the change in the annual average magnitudes of the sunspot number and Ap index. Significant positive correlations among diurnal amplitude of both stations with Rz and Ap index have been found. The largest amplitudes are observed during the declining phase of solar activity. The semi-diurnal amplitude for Kiel and Haleakala neutron monitor stations have been found negatively correlated with sunspot number and Ap index, while the semi-diurnal phase is positively correlated with sunspot number and Ap index.Examinations and analysis of simultaneous variations in cosmic ray anisotropies along with solar and geomagnetic disturbance index has lead us to identify possible mechanism in producing significant correlations.
Keywords: Cosmic Ray Daily Variation, Sunspot Number , Geomagnetic Disturbance Index Ap Parameters
Cite this paper: C. M. Tiwari, D. P. Tiwari, "Study of High Energy Cosmic Ray Anisotropies with Solar and Geomagnetic Disturbance Index", International Journal of Astronomy, Vol. 1 No. 5, 2012, pp. 73-80. doi: 10.5923/j.astronomy.20120105.01.
1. Introduction
- The anisotropic variations in cosmic ray intensity which are observed only in the helio-sphere can be easily detected by the ground based detectors,[1-8]. The short-term as well as long-term cosmic ray modulation studies which have been continuing for almost more than eight decades were widely investigated by number of researchers[9- 13]. The short-term periodic variations (diurnal and semi-diurnal) of cosmic rays intensity indicate that large changes occur in interplanetary space for continuous periods, which are associated with the spatial distribution of cosmic ray intensity as well as geomagnetic disturbances. The amplitudes and phases of first two harmonics of cosmic ray daily variation and their average characteristics have been particularly emphasized by researchers[14-16]. The observed diurnal variations, even on a day-to-day basis, have been successfully explained (for more than 80% of the days)[17- 20].. Since the realization of “in situ” observations; the convection-diffusion and the interplanetary magnetic field (IMF) gradient as well as curvature drift phenomena in galactic cosmic ray particles; all together manifest itself as a time variation in the count rate of the monitor, a phenomena called solar daily variation or cosmic ray anisotropies[21-22]. The geomagnetic field is usually disturbed when the magnetized solar plasma with specific characteristics flows through the vicinity of the earth. These are usually represented by various indices derived from the continuous records of the geomagnetic components. One such disturbance index representing the mid-latitude geomagnetic disturbances is Ap or Kp index. Ap is based on linear scale. In fact, Ap index has been found to be a good proxy for the interplanetary disturbances, which should also be reflected in the daily variation of cosmic rays. Since it has been already seen within heleo-sphere, by earlier researchers, that solar variability parameters are responsible to affect directly or indirectly the interplanetary and geomagnetic activities. Thus in the light of recent data and literature further analysis is needed to review this work. In this paper we have collected the data of diurnal and semi-diurnal amplitudes and phases of cosmic ray anisotropies for the period 1989 – 2004 of Kiel neutron monitor (a mid- latitude) station and for the period 1991 – 2004 of Haleakala (a low latitude) neutron monitor stations and correlated with solar index (Rz) and geomagnetic index (Ap) covering the previous solar cycle 22 and solar cycle 23.
2. Data and Plots
- During the period 1989 to 2004, covering the major portion of solar cycles 22 and 23, the amplitudes and phases of the first two harmonics of the daily variation of high energy cosmic rays have been obtained on a day-to-day basis by using the pressure corrected hourly data of neutron monitors, well distributed particularly in latitudes, to cover different cut-off rigidities. Such data enable us to study the rigidity dependent variations. These observational results for first and second (diurnal and semi-diurnal) harmonics have been compared with the solar and geomagnetic disturbance parameters. The hourly pressure corrected cosmic ray neutron monitor data of Kiel (a high latitude station with low cut-off rigidity)and Haleakala (a low latitude station with high cut-off rigidity)neutron monitoring stations have been obtained from the website www.cosmic ray neutron monitor data NGDC/WDC STP, Boulder-Cosmic Rays. The amplitudes and Phases (time of maximum) of the anisotropic variation of cosmic rays have been derived from these data by simple harmonic analysis. The annual average is calculated from individual daily vectors after rejecting the days with universal time (UT) associated cosmic ray variations. The daily values of solar and geomagnetic disturbance parameters have been taken from Solar Geophysical Data Books.The figures 1 and 2 show the effect of annual average values of the first harmonic amplitudes and phases for Kiel and Haleakala neutron monitor data due to the change in the annual average magnitudes of the sunspot number, for the interval 1989-2004 for Kiel and 1991-2004 for Haleakala. These figures depict significant positive correlations for both the stations. The correlation coefficient is r = 0.72 for Kiel and r = 0.84 for Haleakala neutron monitor stations for diurnal amplitude, and r = 0.67 for Kiel and r = 0.74 for Haleakala neutron monitor stations for diurnal phase, which are all quite significant. The crossplots in figure 3 and figure 4 show the yearly mean Ap vs first harmonic annual average amplitude and phase respectively for Kiel (1989-2004) and for Haleakala (together), for the period of 1991-2004. Both stations show significant positive correlation for the diurnal amplitude vs Ap index (correlation coefficient r = 0.53 for Kiel station and r = 0.51 for Haleakala station). Similarly figure 4 again shows good positive correlation with Ap index. (Correlation coefficient r = 0.60 for Kiel station, and r = 0.65 for Haleakala neutron monitor stations respectively. These two sets of figures very clearly show, which are also in support of our earlier findings, that both the amplitude and phase are significantly smaller during low sunspot activity period as well as during low Ap (quiet) periods. In a similar manner, the correlations for the semi-diurnal amplitude and phase with sunspot number have been depicted in figure 5 and 6 for the period 1989 – 2004 for Kiel and 1991 to 2004 for Haleakala neutron monitors. Here again a significant positive correlation is evident for the semi-diurnal phase with sunspot number (Fig. 6, correlation coefficient r = 0.84 for Kiel station and r = 0.53 for Haleakala station). However, an indication of negative correlation is observed in case of semi-diurnal amplitude (Fig. 5). In figure 6 the semi-diurnal phase scale is from 8 to 15 hours, whereas the maximum value is expected to be only 12 hours (in 360). Since the semi-diurnal variation is distributed on both sides of the zero hour, of the lower values has been added by 12 to better represent their correlations. The negative correlations of the semi-diurnal amplitudes with sunspot number (Kiel r = -0.57 and for Haleakala r = -0.31) signify that during maximum sunspot activity periods the semi-diurnal amplitudes have least magnitudes.
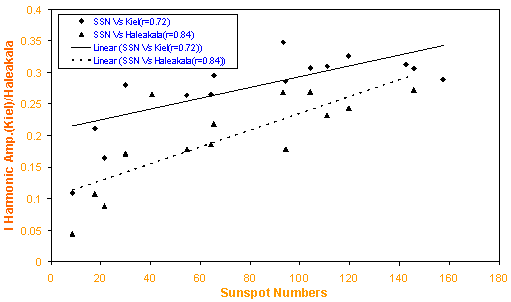 | Figure 1. Shows the crossplot between the first harmonic (diurnal variation) annual average amplitude (for Kiel as well as for Haleakala in %) with sunspot numbers for the interval 1989-2004 for Kiel and 1991-2004 for Haleakala. The best fit lines are also shown |
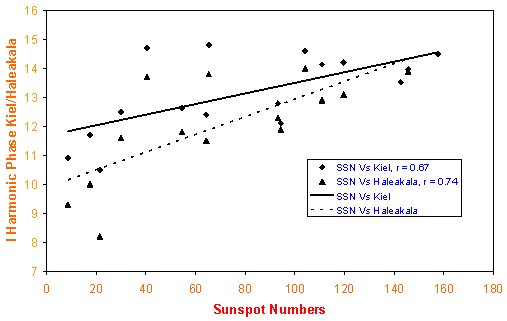 | Figure 2. Shows the crossplot between the first harmonic(diurnal variation) annual average phase values (in hours ) for (Kiel/Haleakala) neutron monitor with sunspot numbers for the interval 1989-2004 for Kiel and 1991-2004 for Haleakala. The best fit lines are also shown |
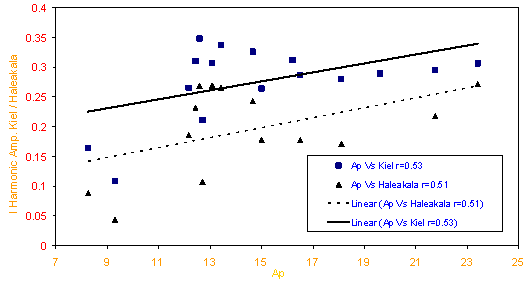 | Figure 3. Shows the crossplot between the yearly mean Ap index vs. first harmonic (diurnal variation) annual average amplitude (%) for Kiel as well as for Haleakala, for the period 1989-2004 for Kiel and 1991-2004 for Haleakala |
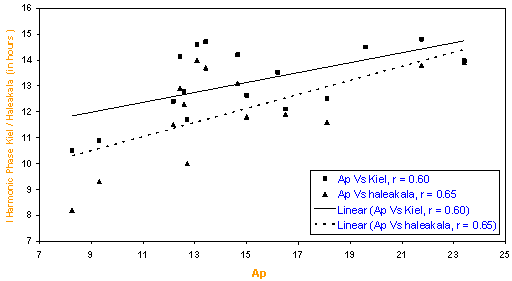 | Figure 4. Shows the crossplot between the yearly mean Ap index vs. first harmonic (diurnal variation) annual average phase (hours) for Kiel as well as for Haleakala, for the period 1989-2004 for Kiel and 1991-2004 for Haleakala |
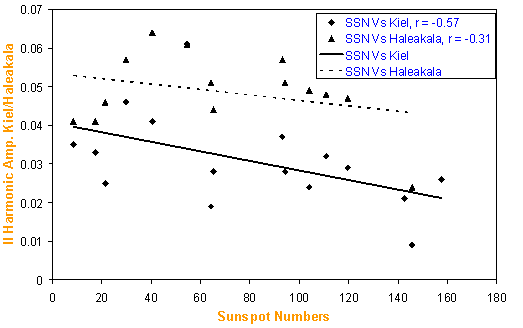 | Figure 5. Shows the crossplot between the second harmonic (semi-diurnal variation) annual average amplitudes in (%) for Kiel/Haleakala neutron monitor with sunspot numbers, for the interval 1989-2004 for Kiel and 1991-2004 for Haleakala. The best fit lines are also shown |
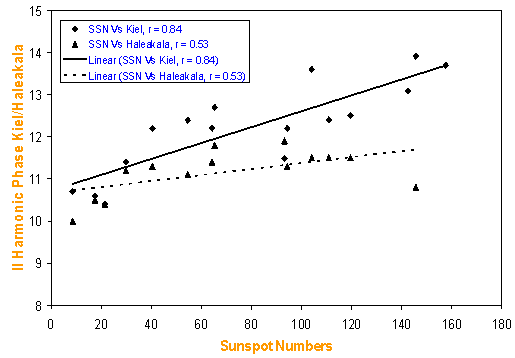 | Figure 6. Shows the crossplot between the second harmonic (semi-diurnal variation)annual average phase values (in hours) for Kiel as well as for Haleakala neutron monitor station with sunspot numbers for the interval 1989-2004 for Kiel and 1991-2004 for Haleakala. The best fit lines are also shown |
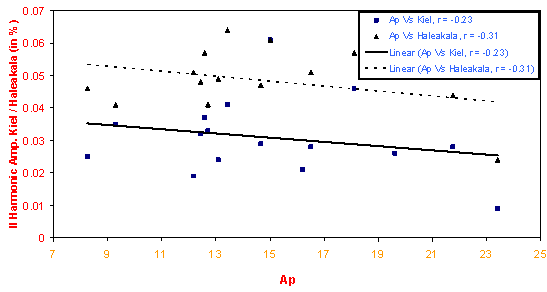 | Figure 7. Shows the crossplot between the yearly mean Ap index vs. second harmonic (semi-diurnal variation) annual average amplitude (%) for Kiel as well as for Haleakala neutron monitor, for the period 1989-2004 for Kiel and 1991-2004 for Haleakala |
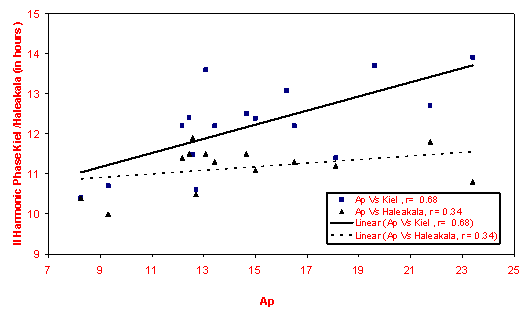 | Figure 8. Shows the crossplot between the yearly mean Ap index vs. second harmonic (semi-diurnal variation) annual average phase (hours) for Kiel as well as for Haleakala neutron monitor, for the period 1989-2004 for Kiel and 1991-2004 for Haleakala |
- For the case of semi-diurnal variation of cosmic rays, figure 7 reveals that the semi-diurnal amplitude is somewhat negatively correlated with annual Ap index values. (The correlation coefficient r = -0.23 for Kiel station and r = - 0.31 for Haleakala station are not very significant). Similar correspondence has been found for the phase changes, though of reverse nature. The semi-diurnal phase (time of maximum) has been observed to shift to earlier hours during low sunspot activity periods, whereas the correlation with Ap index is also positive and quite satisfactory at least for Kiel station (figure 8; correlation coefficient r = 0.68 for Kiel station, and r = 0.34 for Haleakala station). The correlation coefficient of Kiel station is observed to be quite large as compared to low values for the Haleakala station. The best fit line (trend line) for station Kiel also reveals similar behavior as compared to only moderate increase seen at Haleakala station.
3. Conclusions and Discussion
- The solar activities play the significant role in modulating the cosmic ray intensity. It modifies interplanetary and geomagnetic parameters. The cosmic ray daily variations which are due to spinning motion of the earth are particularly described in this analysis. In fact, the largest amplitudes are observed during the declining phase of solar activity. In other words, in general we infer that the semi-diurnal amplitude for and Haleakala neutron monitor stations are negatively correlated with sunspot numbers, which is opposite to that found for the diurnal amplitudes. Nevertheless, the semi-diurnal phase i.e. the time of maximum for and Haleakala is positively correlated ( r = 0.84, Haleakala r = 0.53) with sunspot number, as was also the case for the diurnal phase,[20] and[15]. Earlier investigators have also used the criteria that the disturbances in the interplanetary magnetic field can be generally represented by the geomagnetic disturbance index Ap. They have reported that the intensity of such a disturbance is largely associated with the changes in cosmic ray diurnal variation,[6, 7, 11and 20] the results which are in support of our results presented here for the most recent periods. There are various ways to derive the standard error of the mean. One easy and accurate method for the standard error of the mean is to derive it separately for the amplitude and phase of the harmonics of the daily variation. In fact, if the derived standard errors of the mean is also plotted for each of these observed annual average values, one would find that the standard error of the mean is quite large in the later sets of cases (about 10% of the actual vector for the semi-diurnal and about 25% for the tri-diurnal cases). In other words, it is a pertinent way to judge the significance of the average; or it is a way out to assess the low scatter of the daily vectors of the observed amplitudes and/or the phase values. We have found that the typical values of the standard error of the mean for the diurnal variation calculated from the observed daily vectors are of the order of 0.02% but many a times the error has extreme values in between 0.01% to 0.04% for the diurnal variation during the eleven year period. Nevertheless, instead of considering vectors, if only each day values of the diurnal amplitudes are considered, then the standard error of the annual mean diurnal amplitude is observed to be ≈ 0.01% only for most of the years. That is why one can easily conclude that the annual average diurnal vectors are always significant even with more than ten-sigma level. We have also found that the semi-diurnal annual averages are significant at five to six sigma levels. 1. During the period of 1989-2004, the maximum solar activities occurred in the year 1990 and 2000, whereas the minimum activity occurred in the year 1996. The next minimum is expected in the year 2006. In the year of minimum solar activity period, the diurnal amplitude as well as phase, show deep minima on long term basis.2. Significant positive correlations of amplitudes and phase for both the stations as well as for both the parameters (Rz and Ap) have been found for diurnal variation. Moreover, it is observed that the diurnal amplitude and phase show a significant correlation with sunspot activity and geomagnetic disturbance index Ap. The first harmonic of daily variation was found to be maxima in the year 1989 while the minimum values of these parameters were achieved in the years 1986 and 1997. 3. The amplitude as well as the time of maximum of the diurnal wave has been found to increase with the increase of sunspot numbers, i.e. diurnal amplitude as well as phase is generally high during high solar activity period. The negative correlations of the semi-diurnal amplitudes with sunspot number and Ap (Kiel r = -0.57 and for Haleakala r = -0.31) signify that during maximum sunspot activity periods the semi-diurnal amplitudes have least magnitudes.4. The semi-diurnal amplitude for Kiel and Haleakala neutron monitor stations are negatively correlated with sunspot number and Ap index, which is opposite to that found for the diurnal amplitudes.5. Nevertheless, the semi-diurnal phase i.e. the time of maximum for Kiel and Haleakala is positively correlated (Kiel r = 0.84, Haleakala r = 0.53) with sunspot number, as was also seen in the case 0f the diurnal phase. 6. The amplitude and phase of diurnal variation remain constant for the year 1992 to 1995 while the amplitude and phase of semi-diurnal variation show maxima in the years 1993 and 1994. Thus the amplitude and phase are found significantly smaller during low sunspot activity period as well as during low Ap (quiet) periods. 7. The semi-diurnal amplitude is negatively correlated with annual value of geomagnetic disturbance index Ap (the correlation coefficient r = -0.23 for Kiel station and r = - 0.31 for Haleakala station. 8. Even though the semi-diurnal time of maximum shifts to earlier hours during low sunspot activity periods, whereas the correlation with Ap index is found positive during the period 1989 – 2004, at both the stations. 9. In the year of minimum solar activity period, the diurnal amplitude as well as phase, show deep minima on long-term basis. The amplitude of diurnal variation remains constant during the period 1992 to 1995. The amplitude of semi-diurnal variation shows maxima in the years 1993 and 1994. On a long-term basis, the semi-diurnal amplitude shows minima in the years 1990 and 1991while, the diurnal phase is seen to be progressively decreasing since 1989 with some recovery during the years 1989 to 2000. The phase of the semi-diurnal variation practically remains constant from the period 1985 to 1989. After 1991 the phase of the semi-diurnal variation decreases.Based on convection-diffusion theory, the theoretical explanations for the observed changes may come out from the careful examination of the solar wind parameters, which include fluctuations in the interplanetary magnetic field. For this purpose, the years 2005 and 2006 may be considered for detailed investigations, on short-term basis, as these years larger anomalies are expected.
ACKNOWLEDGEMENTS
- The authors thank the World Data Center of Solar Terrestrial Physics, Boulder, Colorado, USA for supplying the data. The authors are also very much thankful to Prof. S. P. Agrawal, Ex _Vice-chancellor, A.P.S. University, Rewa (MP) for his helpful discussion and suggestions.