-
Paper Information
- Next Paper
- Paper Submission
-
Journal Information
- About This Journal
- Editorial Board
- Current Issue
- Archive
- Author Guidelines
- Contact Us
Archaeology
p-ISSN: 2332-838X e-ISSN: 2332-841X
2021; 9(1): 1-6
doi:10.5923/j.archaeology.20210901.01

Thermoluminescence Properties of Calcium Sulfates of Various Hydration Levels
 Abstract
 Reference
 Full-Text PDF
 Full-text HTML
Konstantinos Chartomatzidis1, Paul Konstantinidis1, Lamprini Malletzidou2, Ioanna K. Sfampa1, George Kitis1
1Nuclear Physics Laboratory, Aristotle University of Thessaloniki, Thessaloniki, Greece
2Solid State Physics Section, Aristotle University of Thessaloniki, Thessaloniki, Greece
Correspondence to: Konstantinos Chartomatzidis, Nuclear Physics Laboratory, Aristotle University of Thessaloniki, Thessaloniki, Greece.
| Email: |  |
Copyright © 2021 The Author(s). Published by Scientific & Academic Publishing.
This work is licensed under the Creative Commons Attribution International License (CC BY).
http://creativecommons.org/licenses/by/4.0/

Calcium sulfate -a common constituent of artifacts- can be found in three different hydration levels, namely anhydrate, hemihydrate and dihydrate. The study of the thermoluminescence properties of calcium sulfates is essential for using them as dosimeters, especially in archeological and geological dating methods. In this study, we used natural and commercial samples of those materials. The three following experiments were applied for each sample. a) Sensitivity test b) Dose response and c) Heating rates test. The applied experiments showed an excessive increase in the TL intensity after each cycle on the dihydrate calcium sulfate. Furthermore, a linear correlation was observed between the irradiation dose and the TL intensity in the dose response measurement in all samples. Finally, a decline of TL intensity was observed, for heating rates higher than 2 °C/s, for the two of the samples that contain water in their structure, namely hemihydrate and dihydrate.
Keywords: Thermoluminescence, Calcium Sulfate, Hydration Levels
Cite this paper: Konstantinos Chartomatzidis, Paul Konstantinidis, Lamprini Malletzidou, Ioanna K. Sfampa, George Kitis, Thermoluminescence Properties of Calcium Sulfates of Various Hydration Levels, Archaeology, Vol. 9 No. 1, 2021, pp. 1-6. doi: 10.5923/j.archaeology.20210901.01.
Article Outline
1. Introduction
- Calcium sulfate is a common component of artifacts, such as sculptures, easel paintings, icons, reliefs and either monolithic formations. A study of the thermoluminescence properties of calcium sulfates is essential for using them as luminescence dosimeters. Artificial dosimeters based on calcium sulfate doped with various components already exist and they are widely used in medical applications [1,2]. The aim of this project is to examine whether natural -i.e. undoped- calcium sulfates of different hydration levels can be also used as dosimeters, as there are very few studies on the luminescence behaviour of gypsum for dating purposes [3,4]. Moreover, calcium sulfate-based materials could be used for different archaeometry purposes [5,6], such as dating of archaeological or geological findings, and as well as a means of authenticity testing of various archaeological artifacts [7].Based on their characterization [8], calcium sulfate can be found in three different hydration levels, namely anhydrate (anhydrite, CaSO4), hemihydrate (bassanite, CaSO4∙1/2H2O) and dihydrate (gypsum, CaSO4∙2H2O). For the purpose of this study, the measurements were applied on an anhydrite natural mineral, which originated from Chihuahua, Mexico, on a commercial bassanite (#30766-1), which is produced by Sigma-Aldrich, and another natural mineral of dihydrate calcium sulfate, with origins from the mines of Lubin, Poland [9]. The reason for using a commercial bassanite, and not a natural mineral, is mainly because hemihydrate calcium sulfate is found very rarely in nature, but throughout history is commonly used as a product of dehydration of gypsum.Generally -in art and especially in painted artifacts-, the use of a ground/plaster layer is essential as a preparatory layer, before the application of the painting layers. Plaster containing gypsum was mainly used in paintings, and more rarely to other artifacts, like sculptures [7]. Many plaster recipes consist of dihydrate calcium sulfate, which was heated and then mixed with water. Using luminescence techniques could possibly determine the age of this hemihydrate formation and, moreover, minimum quantities of sample are adequate, in agreement to art conservation guidelines [5]. In addition to dating the production of the materials mentioned before, it is also feasible to date the act of painting itself, which is one of the most important aspects in order to specify the age of the artefact and hence reinforce the authenticity of it. In this case, calcium sulfate is used as a ground layer in a painting, and while this layer is exposed to sunlight during its preparation and application, the electron traps that are sensitive to optical stimulation are bleached. From the moment that this plaster layer is no longer exposed to sunlight and covered by another layer -that of paint-, the electron traps are filled by electrons excited by natural irradiation. Consequently, thermoluminescence (TL) dating methods on calcium sulfate ground layers would reveal the date that it was covered by a layer of paint.While a study focused on the optimization of OSL/IRSL parameters of CaSO4 samples was conducted in 2020 [10], the present study focuses on three aspects of the TL properties [11,12] of calcium sulfates. Firstly, the sensitization of the sample is examined along with each repetitive cycle of irradiation and readout. Also, a dose response experiment is applied, where various irradiation doses are used to study the correlation between irradiation dose and TL intensity. Finally, the effect of different heating rates on TL intensity is examined, while considering the various hydration levels of the samples under study.
2. Instrumentation and Methods
- All TL measurements consist of an irradiation phase, and a heating phase where the TL signal is recorded. Irradiations were carried out through a 90Sr/90Y beta radiation source, which is surrounded by a lead shielding. The recordings of the glow-curves were performed by means of a Harshaw-3500 TLD Reader, through heating the samples in a nitrogen environment, in order to avoid any unintended chemical stimulation [13]. Both the radiation source and the TLD reader are in a laboratory dim lighted, to avoid optical stimulations [14].For the purpose of the present study, the samples were in powder form; the commercial hemihydrate was purchased as such, but for the samples of mineral origin, an agate mortar was used in order to achieve grain size of around 40-60 μm. The samples were mounted, then, on stainless steel cups. Additionally, the characterization of the hydration level of each sample was performed beforehand in a previous study [9].Additionally, each specimen was heated up to 400°C before further experimental measurements, for the recording of the natural glow-curve; in this case, all electron traps were assumed as empty [14], so that the artificial irradiation during this study was the only dose that the samples were exposed to.
3. Experimental Procedures
- For the purpose of this project, three experimental procedures were performed -based on the thermoluminescence standards [11,12,15]-, namely sensitivity test, dose response and heating rate test. As a first step, the characterization of the glow-curves of each sample was performed.
3.1. Glow-Curve and Peaks Characterization
- 1. Recording the Natural glow-curve up to a maximum temperature of Tmax = 400°C, by a heating rate (HR) of 2 °C/s.2. Irradiation of the sample with a test dose of 3.8 Gy.3. Recording the glow-curve within the same temperature limits and HR, as in the first step.
3.2. Sensitivity Test
- 1. Heating the sample up to 400°C to record the natural glow-curve (NTL).2. Irradiation of the sample with a test dose of 3.8 Gy.3. Recording the TL intensity by heating the sample up to 400°C with 2 °C/s HR.4. Repeat steps 2 and 3 for four more cycles.
3.3. Dose Response
- 1. Heating the sample up to 400°C to record the NTL.2. Irradiation of the sample with a dose Di. 3. Recording the TL intensity by heating the sample up to 400°C with 2 °C/s HR.4. Repeat steps 2 and 3 for different Di. (Di =1.9 Gy, 3.8 Gy and 5.7 Gy)
3.4. Heating Rates Test
- 1. Heating of the sample up to 400°C to record the NTL.2. Irradiation of the sample with a dose of 3.8 Gy.3. Recording the TL intensity by heating the sample up to 400°C with HRi.4. Repeat steps 2 and 3 for different HRi. (HRi = 1 °C/s, 2 °C/s, 4 °C/s, 7 °C/s and 10 °C/s)
4. Results and Discussion
4.1. Glow-Curve and Peaks Characterization
- The analysis of the glow-curves was performed according to the Curve Deconvolution method, which suggests that the glow curve is composed of many singular peaks [15,16,17].In Figures 1, 2 and 3, the recorded glow-curves are presented, along with the curve deconvolution analysis. This analysis provides a glance at the peaks that the glow-curve consists of. The experimental data are presented with black circles, the peaks are presented by various colored lines, and the fitting curve -that approximates the glow-curve- is presented by a red line. The sufficiency of the curve-fitting approximation is determined by calculating the Figure of Merit (F.O.M.) [18].First of all, Figure 1 reveals that the glow-curve of the anhydrous calcium sulfate consists of 5 peaks. It should be mentioned that the first two peaks -namely Peak 1a and Peak 1b- are highly overlapped and their discrimination is difficult to be determined. For this reason, they are presented as one by the sum of their integrals. Additionally, Peak 4 which is observed in high temperature, presents remarkably low TL intensity. Consequently, this peak usually is overlapping with background radiation and is also difficult to discriminate it. For that reason, this peak is considered as negligible and is not described further in the present analysis.In the same direction, Figure 2 reveals that the glow-curve of the hemihydrate sample contains 3 dominant peaks. Peak 1 corresponds to the highest TL intensity. However, it is found in exceptionally low temperatures, and -as a result- it could be affected by room temperatures. Peak 2 is observed around 150°C and is the second highest in intensity peak. The last and the lowest peak is Peak 3, around 200°C.Finally, Figure 3 presents a representative glow-curve of the dihydrate calcium sulfate glow-curve, which consists mainly of 4 peaks. Peak 1 is centered in exceptionally low temperature, thus making it negligible in certain TL experiments. Peaks 2 and 4 are the more intense and are present in temperatures around 150°C and 280°C, respectively. Moreover, Peak 4 may be affected from the background signal. Peak 3 -at about 200°C- is of lower intensity in comparison with Peaks 2 and 4. This peak is both not affected by room temperatures and does not interfere with background radiation, making it worth for further study.
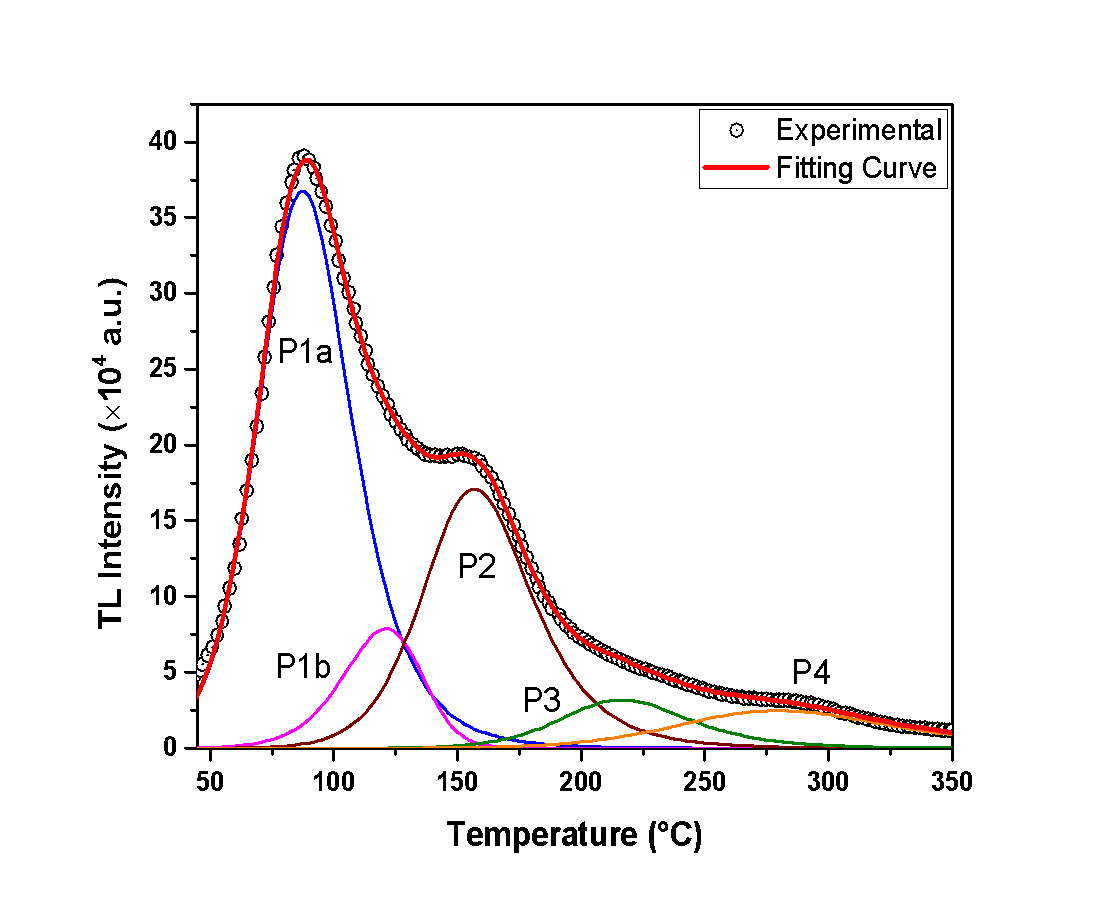 | Figure 1. The anhydrous calcium sulfate glow-curve along with the curve deconvolution analysis |
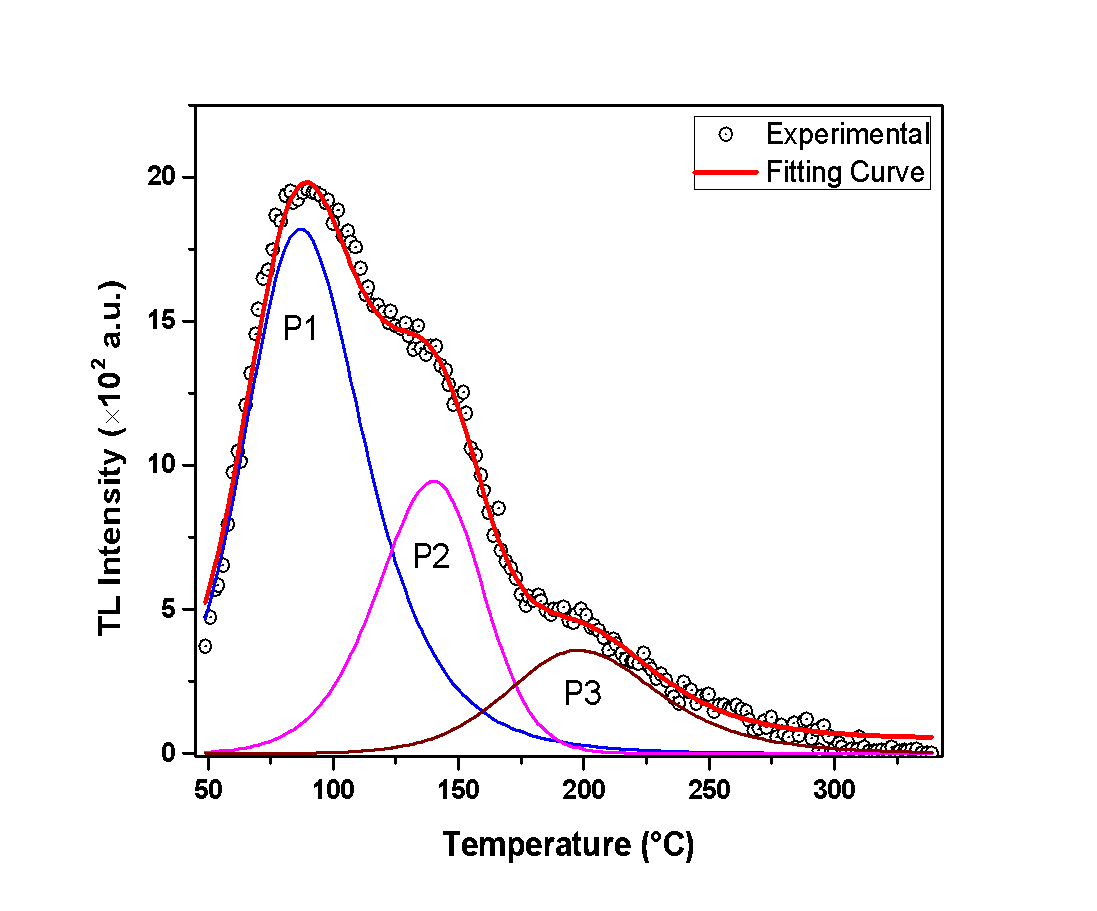 | Figure 2. The hemihydrate calcium sulfate glow-curve along with the curve deconvolution analysis |
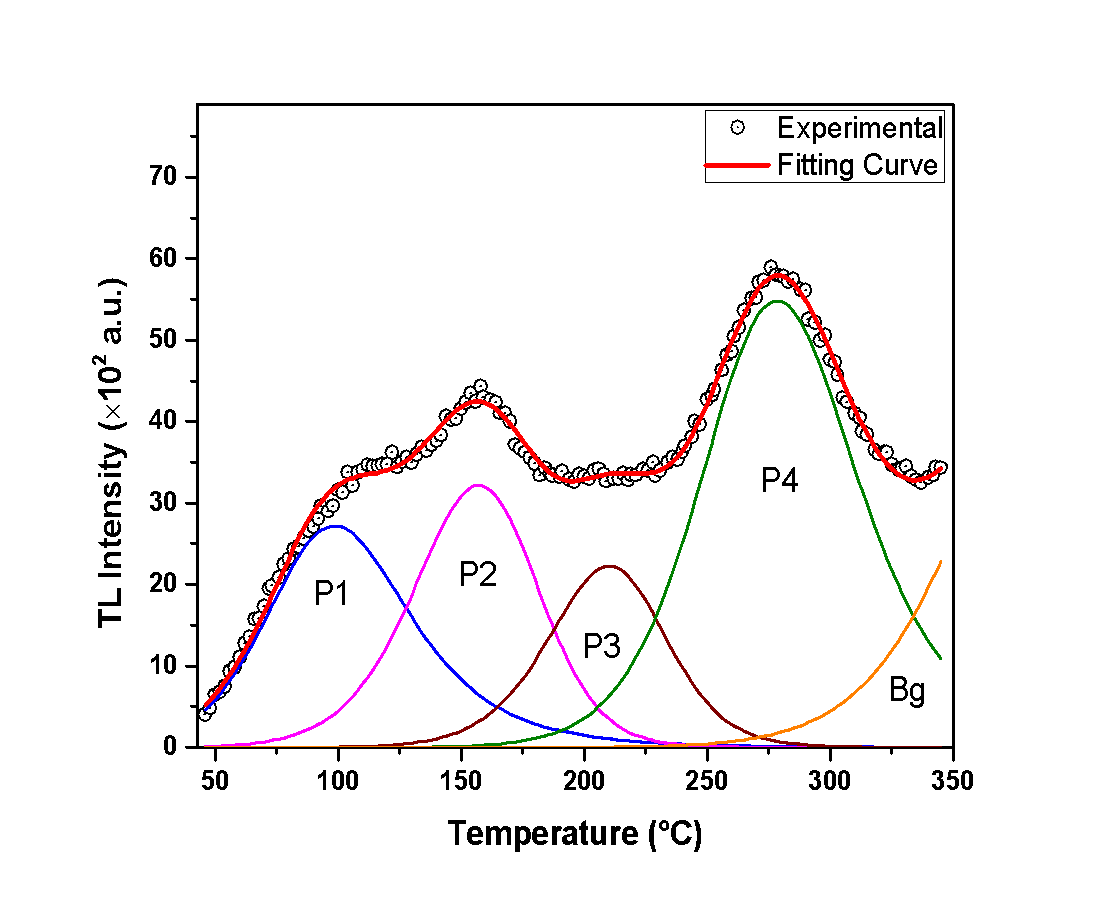 | Figure 3. The dihydrate calcium sulfate glow-curve along with the curve deconvolution analysis |
4.2. Sensitivity Test
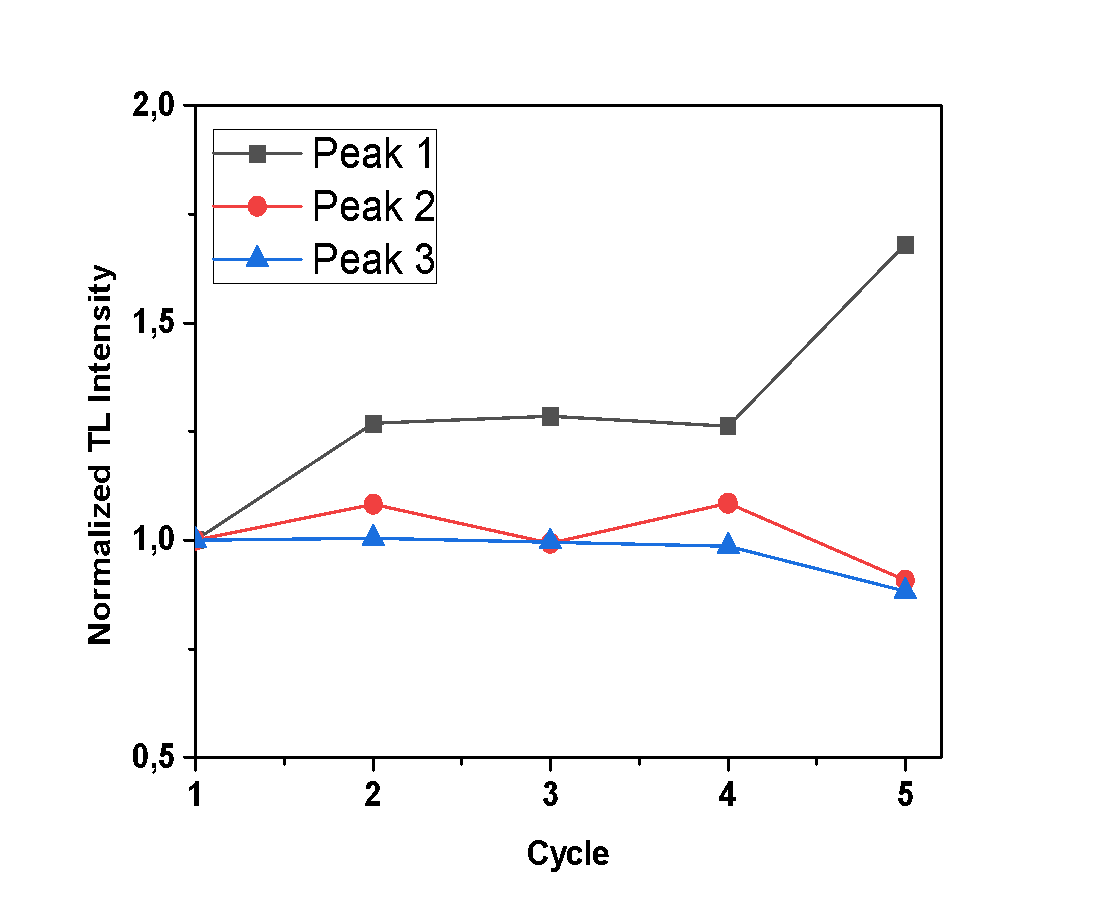
- For the purposes of this experiment, repetitive measurements were performed, all with the same irradiation and heating parameters, to examine the sensitization of the samples under study. In case that any increase of TL signal is observed, along with each cycle of irradiation-measurement, it implies that the sample is sensitized. The glow-curves which were observed, along with each peak’s TL intensity (calculated by the integral of the peak’s curve), are presented in Figures 4, 5 and 6, where the x axis represents the irradiation-measurement cycle. Also, the TL intensity of each peak is normalized so that the sensitization is clearer.Anhydrous calcium sulfate shows a small increase of TL intensity along with each successive cycle, as presented in Figure 4. Specifically, this increase is more intense for Peaks 2 and 3, which after 5 cycles are 1.85 and 1.45 times greater than their initial recordings, respectively. Peak 1 is mostly stable. The hemihydrate sample shows a negligible increase of TL intensity only for the first peak, as presented in Figure 5, which after five cycles of measurements is 1.7 times higher than the initial recording. Finally, dihydrate calcium sulfate shows an excessive sensitization, as shown in Figure 6, and especially Peak 4, which after five repetitive measurements has a TL intensity 11.7 times higher than the initial recording.
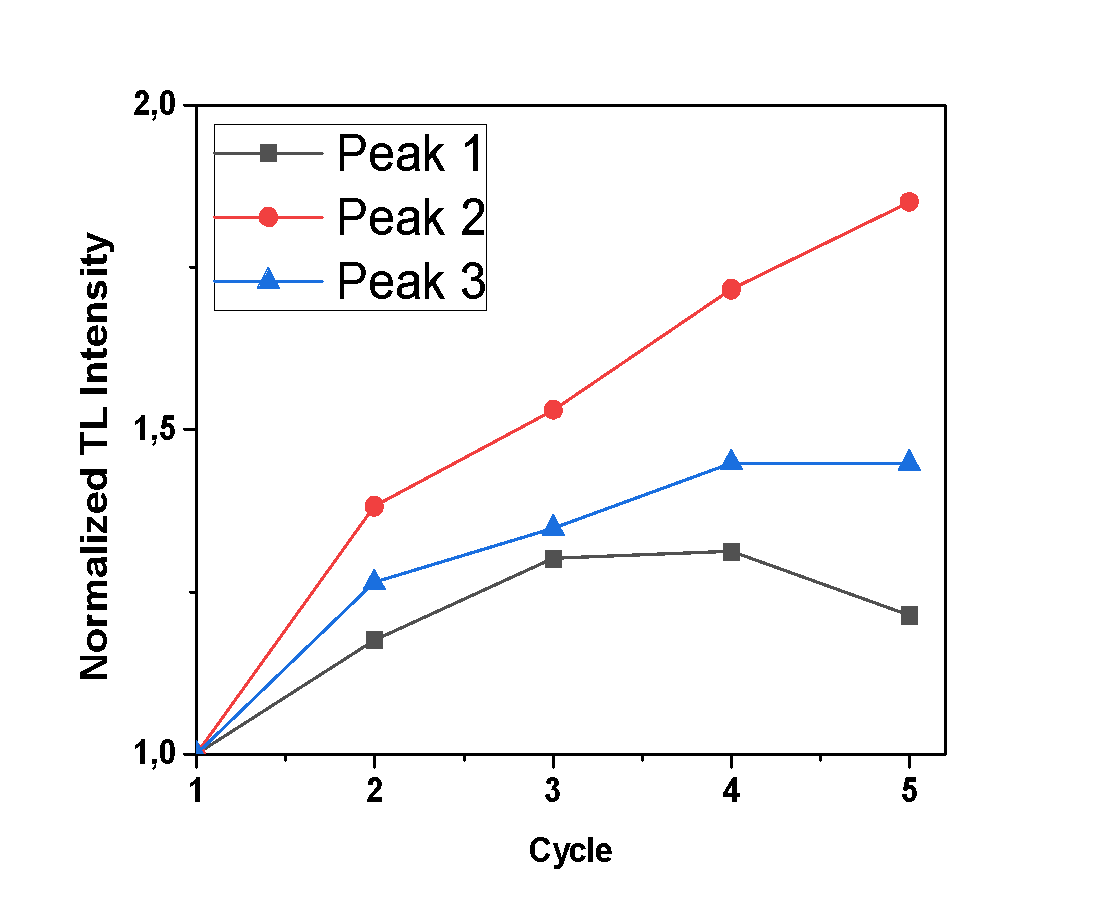 | Figure 4. Normalized TL intensity of each peak of the anhydrous sample after successive cycles of irradiation measurements |
 | Figure 5. Normalized TL intensity of each peak of the hemihydrate sample after successive cycles of irradiation measurements |
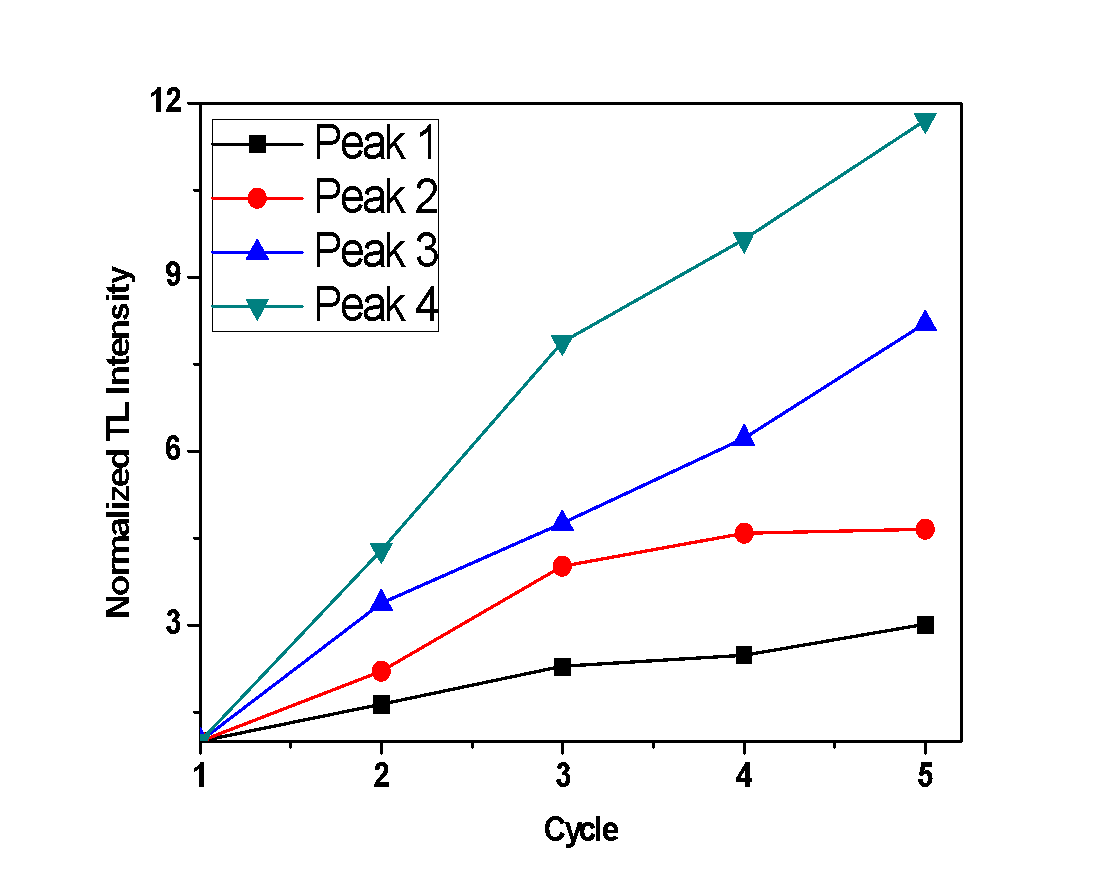 | Figure 6. Normalized TL intensity of each peak of the dihydrate sample after successive cycles of irradiation measurements |
4.3. Dose Response
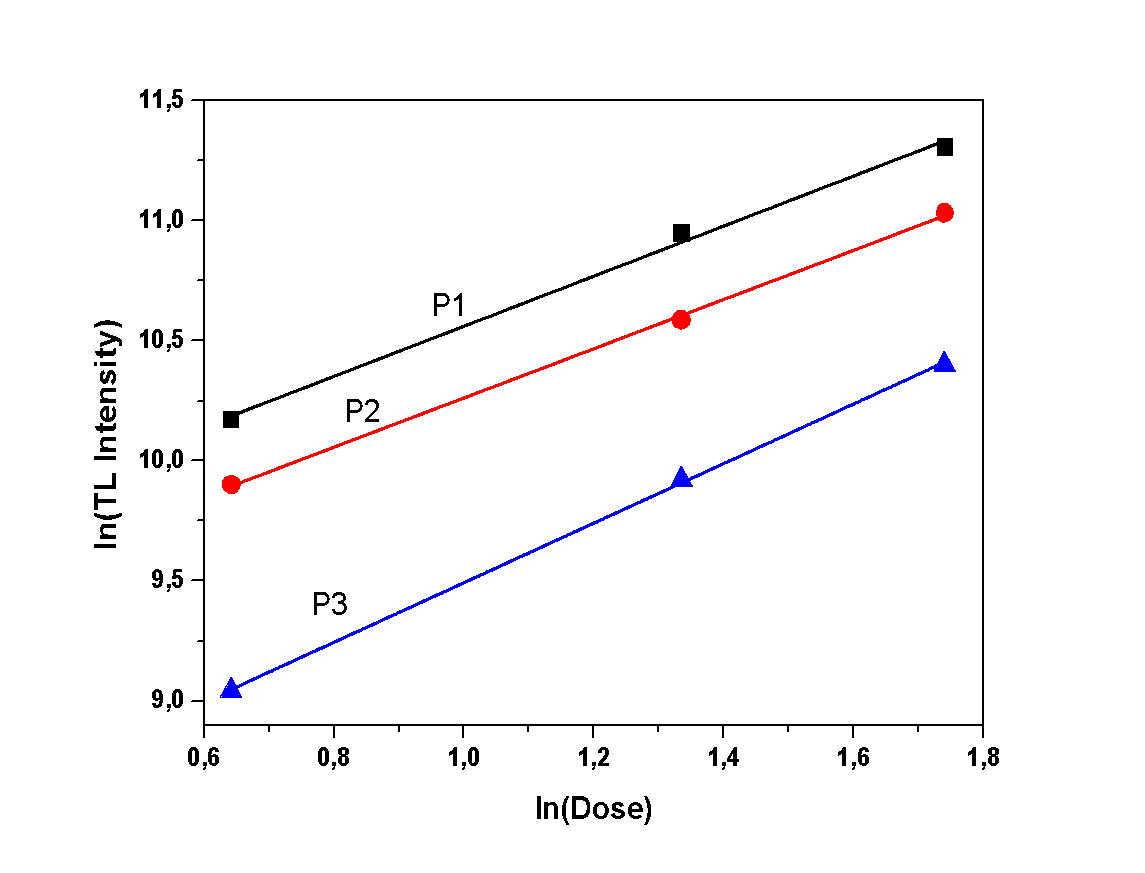
- During this experiment, measurements of various irradiation doses were performed, in order to study the correlation between irradiation dose and TL intensity. The TL intensity of each peak, as a function of the different doses, is presented in Figures 7, 8 and 9. All samples present a linear correlation between TL intensity and irradiation dose. The only sample that seems to deviate from that linearity is the dihydrate calcium sulfate, as shown in Figure 9. However, this deviation should be considered as trivial, taking into account the excessive sensitization that was observed in the previous experiment regarding sensitivity. This minor deviation can be attributed to the repetition of irradiation-measurement cycles, according to the applied protocol, since this particular protocol is applied to single aliquot.
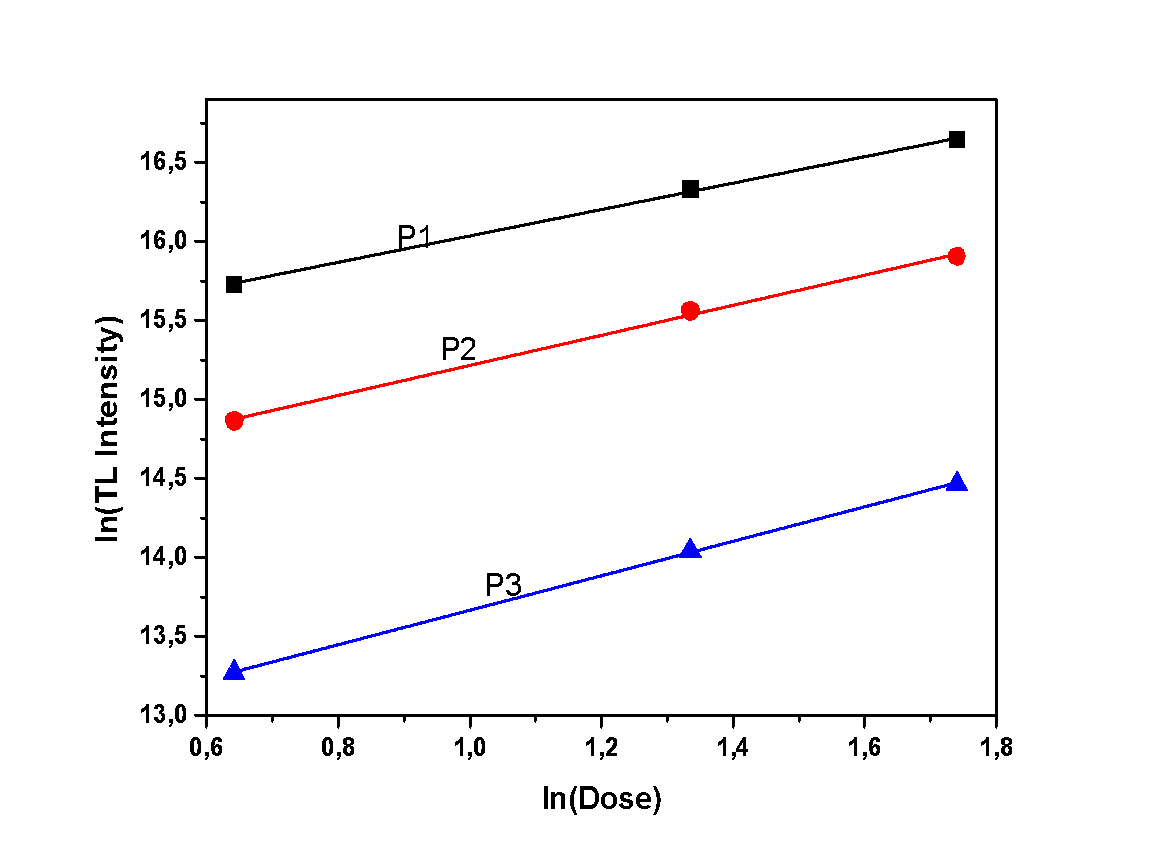 | Figure 7. Dose response of the anhydrous sample |
 | Figure 8. Dose response of the hemihydrate sample |
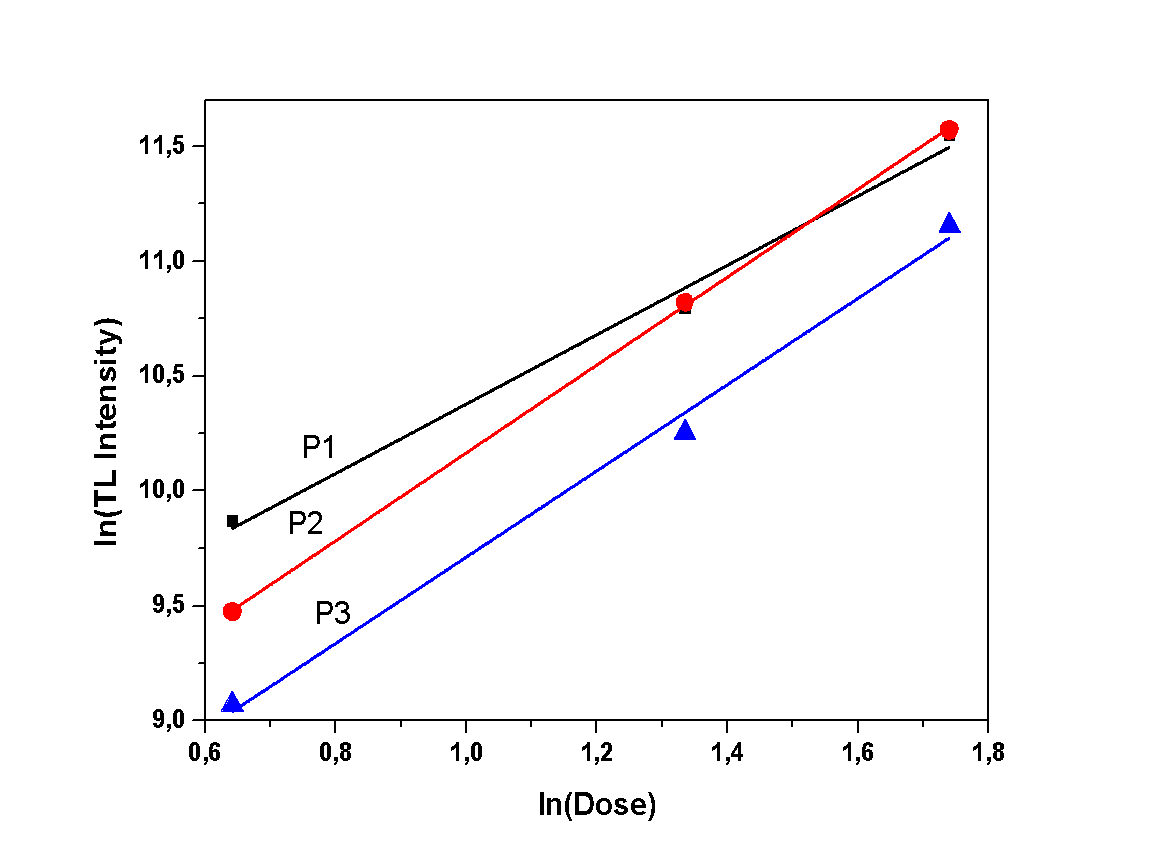 | Figure 9. Dose response of the dihydrate sample |
4.4. Heating Rate Test
- The aim of this experiment is to determine whether the heating rate and the hydration level of the calcium sulfates under study affect the TL intensity. Therefore, measurements with various heating rates were performed in order to record the TL intensity of each glow peak. In Figures 10, 11 and 12, the TL intensity of each glow peak is presented, for all the different HR applied to samples. The TL intensity of each peak is normalized to the first measurement for clarification reasons.Peak 1 of anhydrous calcium sulfate seems to be unaffected by the different applied HR, as it is shown in Figure 10, while Peaks 2 and 3 show an increase in intensity. This increase can be associated with the sensitization of the sample. Hemihydrate sample presents a decline on the TL intensity, for all of the peaks and for heating rates higher than 2 °C/s, as presented in Figure 11. Finally, dihydrate calcium sulfate also shows a decline of TL intensity with increasing heating rate. Specifically, Peaks 3 and 4, decline for heating rates higher than 2 °C/s, while Peaks 1 and 2 decline for heating rates higher than 4 °C/s, as presented in Figure 12.
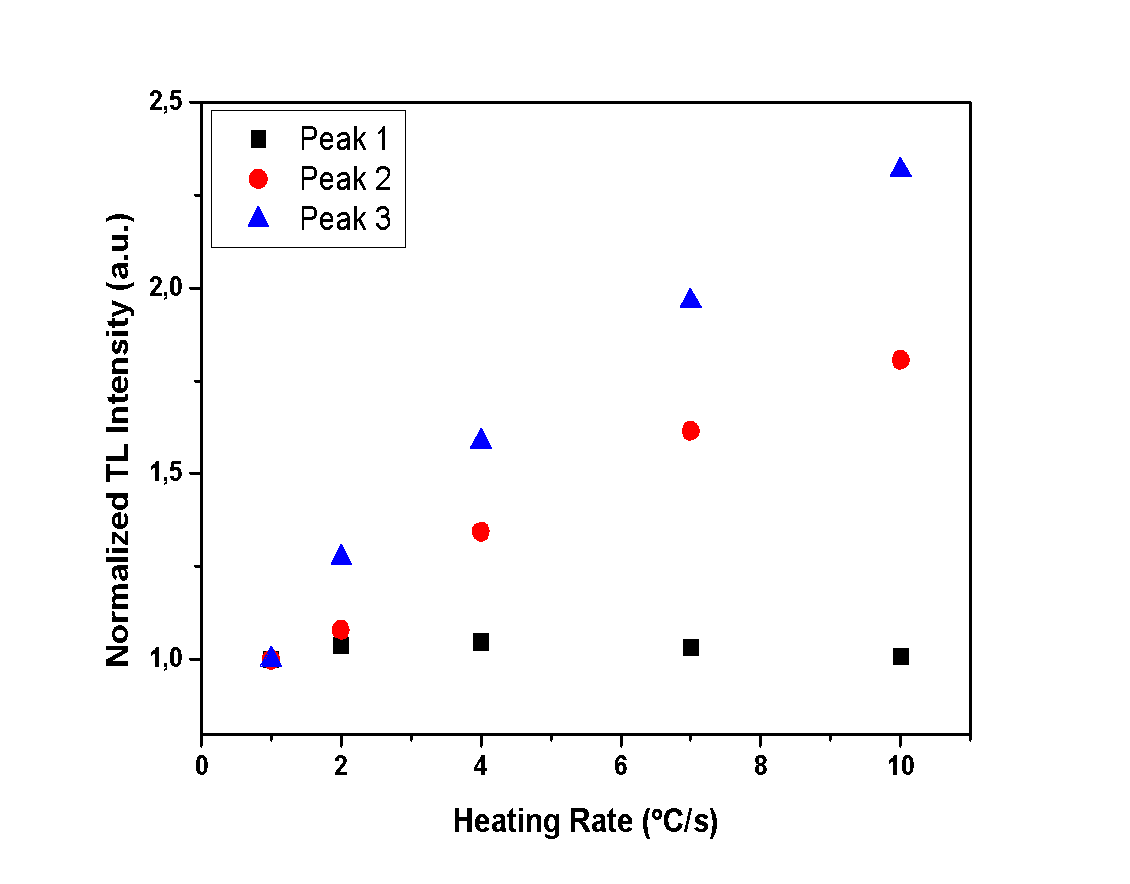 | Figure 10. Normalized TL intensity of each peak for all different heating rates of the anhydrous sample |
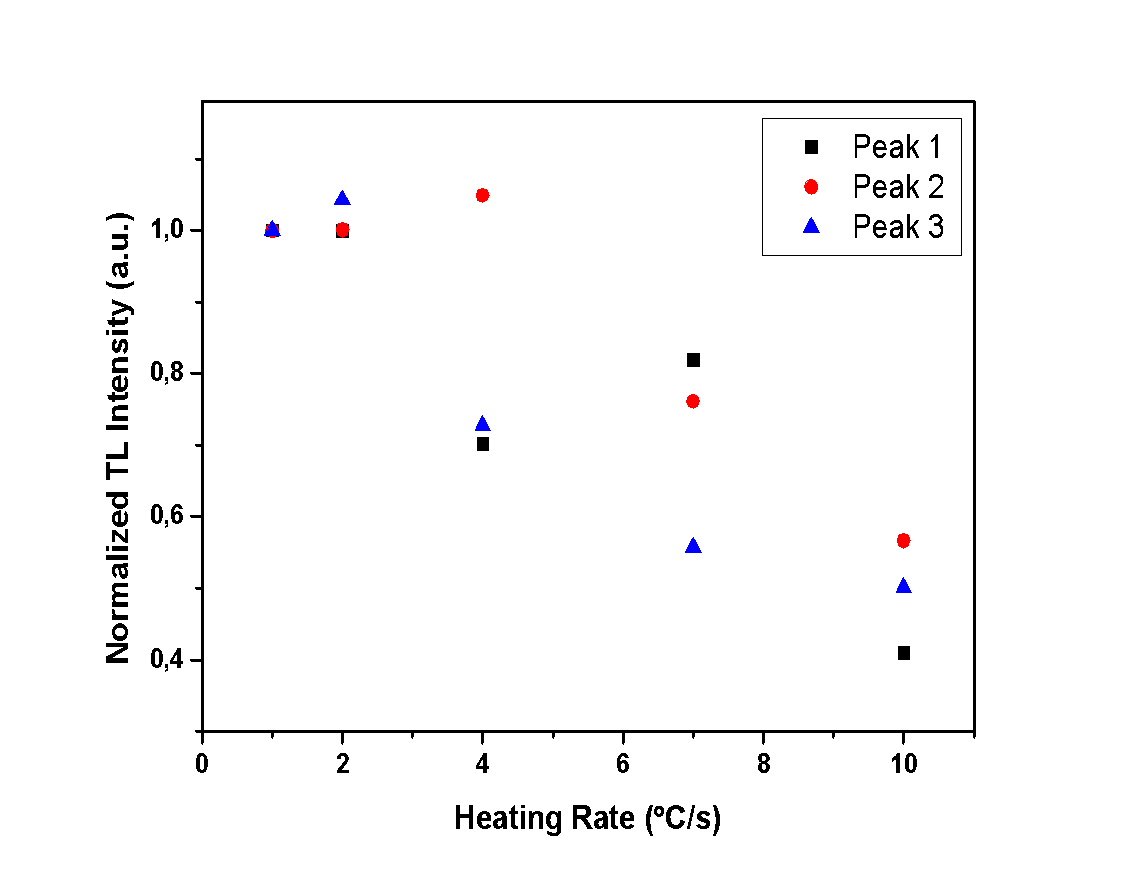 | Figure 11. Normalized TL intensity of each peak for all different heating rates of the hemihydrate sample |
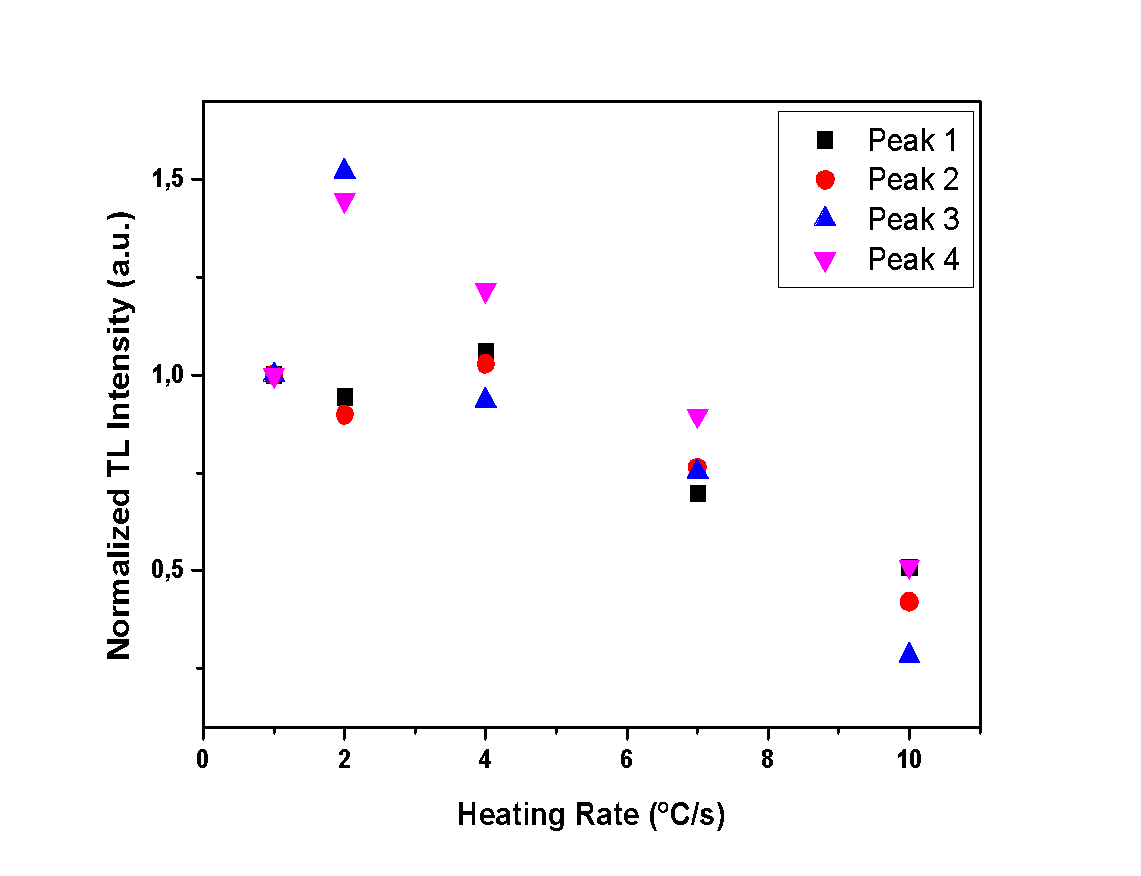 | Figure 12. Normalized TL intensity of each peak for all different heating rates of the dihydrate sample |
5. Conclusions
- Three different samples were studied, each one corresponding to the three hydration levels of calcium sulfates. The TL properties that were studied for the purposes of this work were sensitization and dose response. Also, the effect of various heating rates on the TL intensity was examined, in order to define the effect of the hydration level of the samples.Firstly, the most remarkable result of the sensitivity test is the excessive sensitization that was observed on the dihydrate sample. The other samples showed a minor sensitization and only for specific peaks. Namely these peaks are Peak 2 and Peak 3 of the anhydrous sample, and just Peak 1 of the hemihydrate. The rest of the TL peaks are mostly stable. This means that in the case of thermoluminescence study of dihydrate and hemihydrate calcium sulfates, the appropriate correction because of sensitization must be applied, whereas anhydrous calcium sulfate is mostly unaffected.Additionally, the dose response experiment yielded to a linear correlation for all three samples, between TL intensity and irradiation dose. This is the most important characteristic of a TL dosimeter. Consequently, it can be considered that calcium sulfate is a candidate suitable for TL dosimetry, but certainly after taking into consideration the need of applying corrections for sensitization, where required.Furthermore, the effect of heating rate was examined on all of the samples. Peak 1 of anhydrous calcium sulfate seems to be unaffected by the heating rate. On the contrary, the increase that both Peaks 2 and 3 present, could be allocated to sensitization. However, the other two samples showed a decline of TL intensity for heating rates higher than 2 °C/s. Taking in consideration that anhydrous sample is stable and that the only samples that are affected by heating rate are the ones that contain water in their molecule, we can conclude that this decline in TL intensity is a result of water loss, leading to the modification of the crystal structure and, consequently, of the electron traps. In conclusion, calcium sulfates present appropriate TL properties to be used as dosimeters in TL applications. In addition, the heating rates experiment showed that HR of 2 °C/s or less are appropriate for recording the glow-curves of the samples that contain water in their molecules. Moreover, the abovementioned properties imply that artifacts containing calcium sulfate could be characterized by thermoluminescence, in order to date and/or declare authentication. Further work should include a multi-aliquot experiment procedure or, in case of single-aliquot, further corrections of the TL signals attributed to the sensitization of the samples because of their hydration level. Moreover, further properties, such as anomalous fading and initial rise tests should also be examined, so that the precise activation energy of each electron trap is calculated.