Archaeology

2012;  1(1): 1-6

doi: 10.5923/j.archaeology.20120101.01

3D ERT Survey to Reconstruct Archaeological Features in the Subsoil of the “Spirito Santo” Church Ruins at the Site of Occhiolà (Sicily, Italy).

Leucci G. 1, Greco F. 2

1Institute for Archaeological and Monumental Heritage (National Research Council), Lecce, 73100, Italy

2Istituto Nazionale di Geofisica e Vulcanologia (INGV) - Sezione di Catania, Osservatorio Etneo, Catania, 95125, Italy

Correspondence to: Leucci G. , Institute for Archaeological and Monumental Heritage (National Research Council), Lecce, 73100, Italy.

Email:

Copyright © 2012 Scientific & Academic Publishing. All Rights Reserved.

Abstract

Three-dimensional Electric Resistivity Tomography (ERT) was undertaken at the archaeological site of Occhiolà (Sicily, Italy) a medieval village, located on the north western part of a hill named “Terravecchia” at 491 m above sea level. The survey was carried out inside the ruins of “Spirito Santo” Church. This paper presents the geophysical results of the 2004 campaign that aimed at exploring the buried extension of the possible crypt and/or tombs inside the church. ERT survey was performed by means of Molisana Apparecchiature Elettroniche (MAE) system with 31 active electrodes. The dipole-dipole array was selected for measurements. Resistivity variations are known to correlate well with the lithological nature of the earth materials, thus providing important information in order to locate buried archaeological remains. The electrical data were visualised in a three-dimensional space by using the iso – resistivity surface. This allowed the three-dimensional position of the anomalies evidenced in the single electrical section in a more effective manner. The results obtained in the survey highlight the presence of regular shape structures probably due to features of archaeological interest.

Keywords: Archaeology, Electrical Resistivity Tomography, 3D Visualization

1. Introduction

The application of geo-archaeological and geophysical methods changed the starting point of scientific approaches toward archaeological investigations in the 20th century. Traditional methods used in archaeology gave limited or sometimes no information on unexcavated subsurface archaeological features. The application of geophysics to archaeology dates back to the early 1950s. The rapidly evolving technology over the past 20 years has made the geophysical approach a reliable investigative tool, both before and during excavation. Geophysical prospecting allows the physical parameters of the subsoil to be mapped in large-scale reconnaissance surveys. In specific cases, it can provide useful information on the depth and shape of buried structures of anthropogenic origin and may help detect individual artefacts. One of the most commonly applied techniques of geophysical surveying is the electrical resistivity tomography (ERT) that provide the measurement of the specific electrical resistance of soil (Mol and Preston, 2010; Papadopoulos and Sarris, 2011; Tsourlos and Tsokas, 2011).
ERT method is suitability in detecting walls, cavities and other structures at differing depths (Monteiro and Senos Matia 1987; Ponti et al. 1996; Thacker and Ellwood 2002; Dogan and Papamarinopoulos 2003; Senos Matias 2003; Leucci 2006; Papadopoulos et al. 2006; Gaffney, 2008; Leopold et al., 2010; Papadopoulos et al., 2010; Leopold et al. 2011).
The use of resistivity in identification of walls has long been a common practice (Sarris and Jones 2000; Drahor et al., 2008; Tsokas et al., 2008; Tsokas et al., 2009; Berge et al., 2011).
This paper shows the results of a geoelectrical survey performed in a high earthquake risk area inside the village of Occhiolà (Sicily Region, south Italy; Fig. 1), where the imposing ruins of a castle and part of the original urban plan, are still presents (Fig. 1).
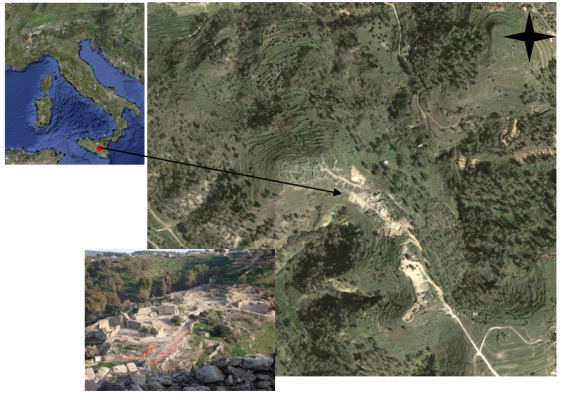
Figure 1. Map showing the location of Occhiolà village (Sicily, Italy).
Occhiolà (Sicily region, Italy) is a medieval village, located on the north western part of a hill named “Terravecchia” at 491 m asl, on the margin north-west of the Hyblean Plateau, in southeastern Sicily (Fig. 1). The Hyblean Plateau is characterized by a continental crust overlain by thick Mesozoic to Quaternary carbonate sequences (mostly of formations to granulometria from sandy to rough, melted or cements, often containing many fossilifer rests) and represents the emerged foreland of the Neogene-Quaternary Maghrebian thrust belt (Bianca et al., 1999). The uppermost metres of soil surrounding the Occhiolà village are comprised mainly of a surface weathered zone and calcareous sands weakly cemented.
This region, one of the most seismically active in the Mediterranean, is affected by WNW-ESE regional extension producing normal faulting of the southern edge of the Siculo-Calabrian rift zone (Bianca et al. 1999).
In 1693, the Occhiolà village was severely damaged and abandoned after violent earthquakes. The first event, on January 9, alarmed the population and caused widespread damage (I=VII-VIII MCS), but it was the stronger earthquake occurring two days later (11th January) that destroyed the village entirely. Buildings, weakened by the previous shock, were completely raised to the ground (I = XI MCS; Mw ~7; Boschi et al. 1995; Postpischl 1985); half of population (ca. 1470 people) died under the pile of ruins. Prince Carlo Maria Carafa Branciforte di Butera rebuilt the town, with the name of Grammichele, in a site located on the plain a few kilometres from the old one.
A programme of extensive and intensive geophysical field surveys was undertaken with the aim of exploring the buried extension of the village. To this end, the present geophysical study was planned to help the archaeologists in their planning of any future excavation and show if the previously cleared sites still contained considerable remains underneath. With these objectives, an initial geophysical survey campaign was undertaken in 2003 whose results were published in Leucci et al. 2007.
A second geophysical survey campaign was performed in 2004 in the eastern part of the site inside the ruins of the “Spirito Santo” Church. Geoelectrical methods were used to obtain a map of the subsurface, to find evidence of buried structures, more precisely voids (related to the presence of crypts and/or tombs) and to delimit these structures.
The following sections describe the survey plan and methodology, illustrate the features of the contoured resistivity data, and then show the location and shape of an anomaly source as highlighted by three-dimensional tomography imaging, commenting on its archaeological significance.

2. ERT Survey Planning and Method

The ERT investigation was carried out using a multi-electrode resistivity system with a dipole–dipole array along a total of 10 profiles. The dipole-dipole array was chosen because, as is well known, it is very sensitive to horizontal changes in resistivity and is therefore appropriate in mapping vertical structures (Loke 2009).
Parallel profiles at a mutual distance of about 1 meter were arranged (Fig. 2). A 31-electrode layout with a dipolar spread of 1 meter was used for the E3,…E8 profiles, with a total length of the profiles equal to 30 meters. A 23-electrode layout with a dipolar spread of 1 meter was used for the E1, E2, E9 and E10 profiles, with a total length of the profiles equal to 22 meters. A3000-E, resistivity-meter from M.A.E. (Molisana Apparecchiature Elettroniche) instruments in multi-electrode configuration was used to collect the apparent resistivity data.
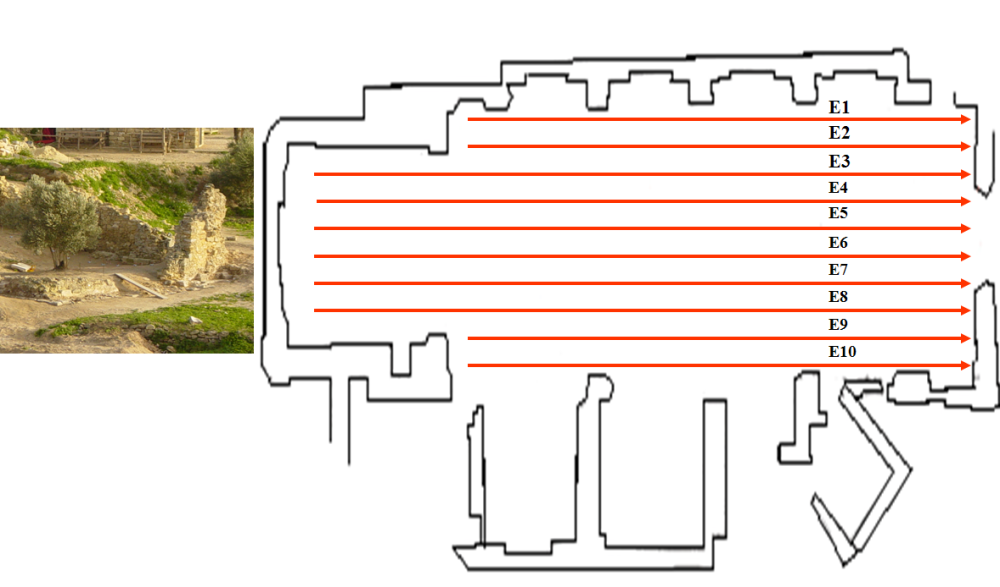
Figure 2. Surveyed area. The imposing ruins of the Santo Spirito Church are shown in the photo. On the right the plant of the church.
In the ERT method, the distribution of the electrical resistivity of the subsoil is obtained by injecting electrical current into the ground and measuring the potential difference at two determined points of the surface. The suitability of the method lies in the fact that buried structures can be detected as contrasts or anomalies in the electrical properties of the medium. Then, if an electrical tomography of the subsoil can be obtained, the probable location of the structures can be delimited.
The method is based on the application of Ohm’s law:
(1)
where ρa is the apparent resistivity (Parasnis 1997), k is a geometric constant that depends only on the reciprocal positions of the current and potential electrodes; ΔV is the measured potential difference, and l is the intensity of the injected current. The apparent resistivity values depend on the true resistivity distribution.
The true resistivity distribution in the investigated medium can be estimated by an inversion procedure based on the minimization of a suitable function. This function is generally the sum of the squared difference between measured and calculated apparent resistivities. The investigated medium is discretized in a 2D (or 3D) grid of cells, where each cell is assigned an initial resistivity value. A finite-difference (Dey and Morrison 1979a,b) or finite-element (Silvester and Ferrari 1990) procedure computes the predicted apparent resistivity at the surface. The solution to the problem, as is well known, is not unique. For the same measured data set, there is a wide range of models that can give rise to the same calculated apparent resistivity values. To narrow down the range of possible models, normally some assumptions are made concerning the nature of the subsurface (i.e. geology of the subsurface, whether the subsurface bodies are expected to have gradational or sharp boundaries) that can be incorporated into the inversion subroutine. The current method of solution minimizes the difference between measured and calculated apparent resistivities using the smoothness-constrained inversion formulation, which constrains the change in the model resistivity values to become smooth (Loke 2001). The “smoothness-constrained robust inversion” method has proved to be much more useful when the subsurface bodies have sharp boundaries (Loke 2001).

2.1. ERT Data Processing and Results

The first step in the data processing consists of obtaining a pseudo-section by plotting the apparent resistivity versus the depth for each midpoint of a given electrode configuration. The inversion of the data is carried out according to an iterative process which aims at minimising the difference between the measured pseudo-section and the calculated pseudo-section based on a starting model. This model is updated after each iteration until it reaches an acceptable agreement between measured and calculated data or until no further improvements are possible. The Res3dinv resistivity inversion software (Loke 2001) was used to automatically invert the apparent resistivity acquired data and to yield a three-dimensional resistivity model. The “smoothness-constrained robust” inversion method, presented by Loke and Barker (1996), was applied. This method, minimising the absolute value of the sum of differences, between measured and calculated resistivity values, produces models with fast transitions across areas of different electrical values, so that even if strong lateral or vertical resistivity variations occur (such as in an archaeological area) this method can be considered suitable.
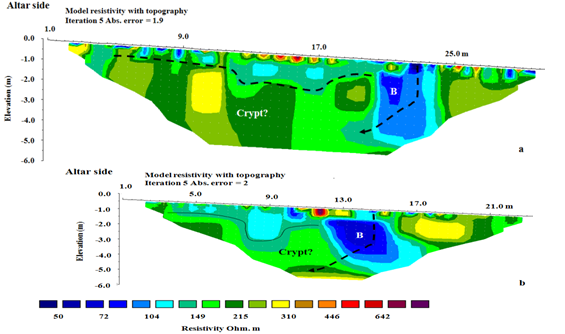
Figure 3. Pseudo-sections across the E8 (a) and E9 (b) profiles.
Figures 3a and b display the pseudosections across the E8 and E9 profiles, respectively. In order to enhance the resistivity contrasts, each pseudosections has been assigned the same colour scale by adapting the same colour sequence within the [resistivity,min, resistivity,max] interval of each set. Of particular interest is the anomaly with the lowest resistivity values (80 Ω m), visible from the surface until the bottom in the right sector of the pseudosections and labelled B. It appears near to a potentially high resistive block (150 Ω m < ρ< 300 Ω m). It was thought that this might well be the entrance to the crypt. The highly resistant block could correspond to the crypt remains.
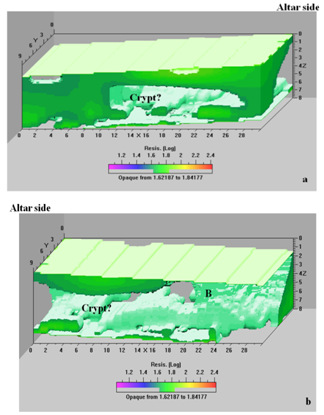
Figure 4. 3D contouring of iso-resistivity surfaces using a threshold value ranging from 40 to 65 Ω m.
Fig. 4a and b shows the 3D contouring of iso-resistivity surfaces. In this representation the transparency function is defined by two threshold values of the resistivity, ρ1 and ρ2 1 < ρ2). In the intervals ρ < ρ1 and ρ > ρ2, data is rendered as transparent, therefore only the data in the interval ρ1 < ρ < ρ2 is visualized. The threshold calibration is a very delicate task. In fact, by lowering the threshold value, not only the visibility of the main anomaly is raised, but also that of the smaller objects and noise increases. In Figure 4 the resistivity data set is displayed with iso-resistivity surfaces using a threshold value ranging from 40 to 65 Ω m. The highest resistivity anomalies were removed.
This kind of visualization allows the resistivity anomalies, already shown in Fig. 3, to be emphasized. The crypt is well visible and in the area where the B anomaly was found; a series of steps that could be related to the entrance of the crypt are clearly visible. Furthermore, Fig. 5 shows the iso-resistivity surfaces using a threshold value ranging from 50 to 125 Ω m. Some anomalous zones (A) assumed a regular shape and therefore can be related to buried anthropogenic remains (tombs?).
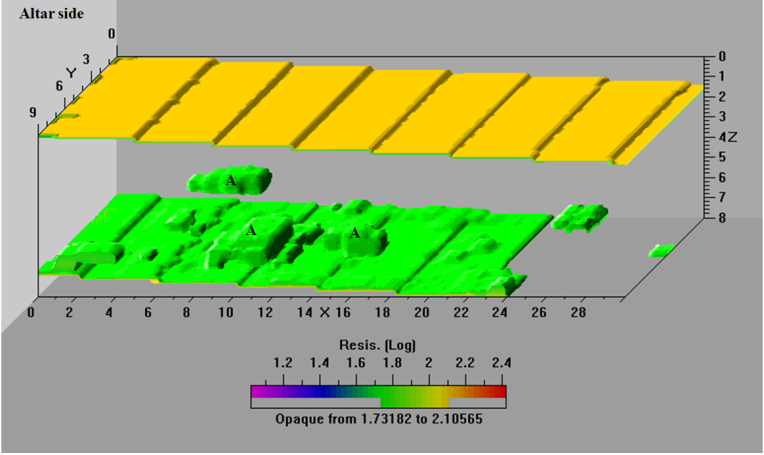
Figure 5. 3D contouring of iso-resistivity surfaces using a threshold value ranging from 50 to 125 Ω m.

3. Conclusions

The archaeological area of Occhiolà (Sicily region, Italy) includes clear evidences showing that the site has been occupied since the XI-X century b.C., until 11 January 1963, when a catastrophic earthquake that destroyed many towns of eastern Sicily occurred. In order to map the archaeological structures at the ruins of Occhiolà village, electrical resistivity tomography (ERT) method was used.
We have shown the results from an application of this geophysical method to a case study of great importance from an archaeological point of view, namely the Santo Spirito Church. As outlined in previous applications, the 3D ERT can be considered a self-sufficient procedure, useful to delineate location and shape of the anomalies detected from the ground surface.
Electrical surveys, effectively visualized as iso-resistivity surfaces, allow the localization of anomalies leading to buried archaeological remains (probably crypts and tombs) beneath the ruins of the church. Indeed, relatively high resistivity anomalies could be due to the collapsed crypt. It is likely that the 1693 earthquake caused the crypt collapse.
To date the three dimensional reconstructed source images cannot be compared with the available historical and archaeological information since systematic archaeological excavation was not applied at this site.
Therefore, a rapid scientific and non-destructive technique was needed to delineate any buried archaeological remains in order to rescue them from being lost forever. We hope that the results of this study could encourage future archaeological excavation.

ACKNOWLEDGEMENTS

This work is dedicated to a great friend and estimated colleague Dr Geologist Gaetano Alia (1962-2009), died prematurely.

References

[1]  M. Bianca, C. Monaco, L. Tortorici, L. Cernobori, 1999, Quaternary normal faulting in southeastern Sicily (Italy): a seismic source for the 1693 large earthquake. Geophysical Journal International, 139, (2), 370-394
[2]  M. Berge, M. Drahor, 2011, Electrical Resistivity Tomography Investigations of Multilayered Archaeological Settlements: Part II – A Case from Old Smyrna Höyük, Turkey Archaeol. Prospect. (2011) Published online in Wiley Online Library (wileyonlinelibrary.com) DOI: 10.1002/arp.423
[3]  E. Boschi, G. Ferrari, P. Gasperini, E. Guidoboni, G. Smriglio, G. Valensise, 1995, Catalogo dei Forti Terremoti in Italia dal 461 a.c, al 1980, Istituto Nazionale di Geofisica, S.G.A., Roma
[4]  Dey, H.F. Morrison, 1979a, Resistivity modelling for arbitrary shaped two-dimensional structures. Geophysical Prospecting, 27, 1020-1036
[5]  Dey, H.F. Morrison, 1979b, Resistivity modelling for arbitrarily shaped three-dimensional shaped structures. Geophysics, 44, 753-780
[6]  M. Dogan, S. Papamarinopoulos, 2003, Geoelectric Prospection of a City Wall by Multi-electrode Resistivity Image Survey at the Prehistoric Site of Asea (Southern Greece). Archaeological Prospection, 10, 241–248
[7]  M. G. Drahor, M.A.Berge,T.O .Kurtulmus, M. Hartmann, M. A. Speidel, 2008, Magnetic and Electrical Resistivity Tomography Investigationsin a Roman Legionary Camp Site (Legio IV Scythica) in Zeugma,Southeastern Anatolia,Turkey Archaeol. Prospect. 15, 159–186 (2008)
[8]  Gaffney, 2008, Detecting trends in the prediction of the buried past: a review of geophysical techniques in archaeology. Archaeometry 50(2): 313–336
[9]  M. Leopold, E. Gannaway, J.Volkel, , F. Haas, M. Bechtt,T. Sheckmann, M. Kuswestphal, G. Zimmer, 2011, Geophysical Prospection ofa Bronze Foundry onthe Southern Slope of the Acropolis at Athens,Greece, Archaeol. Prospect. 18, 27–41 (2011)
[10]  M. Leopold, T. Plockl, G. Forstenaicher, J.Volkel,. 2010, Integrating pedological and geophysical methods to enhance the effectiveness of archaeological prospection: the example of a Roman villa rustica near Regensburg, Germany. Archaeological Science 37(7): 1731–1741
[11]  G. Leucci, F. Greco, L. De Giorgi, R. Mauceri, 2007, Three-dimensional image of seismic refraction tomography and electrical resistivity tomography survey in the castle of Occhiolà (Sicily, Italy). Journal of Archaeological Science, 34, 233-242
[12]  G. Leucci 2006, Contribution of ground-penetrating radar and electrical resistivity tomography to identify the cavity and fractures under the main church in Botrugno (Lecce, italy). Journal of Archaeological Science, 33, 9, 1194-1204
[13]  M.H. Loke, R.D. Barker, 1996, Rapid least-squares inversion of apparent resistivity pseudosections using a quasi-Newton method. Geophysical Prospecting, 44, 131-152
[14]  M.H. Loke, 2009, Electrical imaging surveys for environmental and engineering studies. A practical guide to 2-D and 3-D surveys, RES2DINV Manual, IRIS Instruments,
[15]  www.iris-instruments.com
[16]  L. Mol, P. Preston, 2010, The writing’s in thewall:A review of new preliminary applications of electrical resistivity tomography within archaeology. Archaeometry 52(6): 1079–1095
[17]  A.J. Monteiro, M.J. Senos Matias, 1987, Uso de tecnicas de prospeccao geofisica em arqueologiad Villa Cardilio e Centum Cellae. Arqueologia, 15, 122-128
[18]  N.G. Papadopoulos, P. Tsourlos, G.N. Tsokas, A. Sarris, 2006, Two-dimensional and three dimensional resistivity imaging in archaeological site investigation. Archaeological Prospection, 13, 163–181
[19]  N. Papadopoulos, A. Sarris, 2011, Integrated geophysical survey to characterize the subsurface properties below and around the area of Saint Andreas church (Loutraki,Greece). Proceedings of the 14th International Congress ‘Cultural Heritage and New Technologies’; 643–652. ISBN 978-3-200-02112-9
[20]  N. Papadopoulos, M.Y. Yi, J.H. Kim, G.N. Tsokas, P. Tsourlos, 2010, Two-dimensional and three-dimensional resistivity imaging in archaeological site investigation. Journal of Applied Geophysics 70: 192–205
[21]  D.S. Parasnis, 1997, Principles of Applied Geophysics, fifth ed., Chapman and Hall, London
[22]  N. Ponti, G. Fanton, A. Imhof, S. Pastore, 1996, Investigaciones geoelectricas con fines arqueologicos en Santa Fe La Vieja, Provincia de Santa Fe, Republica Argentina. Jornadas de Antropologıa de la Cuenca del Plata II, 128-130
[23]  Postpischl, 1985, Catalogo dei Terremoti Italiani Dall’anno 1000 al 1980, CNR, Progetto Finalizzato Geodinamica, Graficoop, Bologna
[24]  Sarris, R. Jones, 2000, Geophysical and related techniques applied to archaeological survey in the Mediterranean: a review. Journal of Mediterranean Archaeology, 13, (1), 3–75
[25]  M.J. Senos Matias, 2003, Electrical methods in archaeological exploration. Bollettino di Geofisica Teorica ed Applicata. 44, 193-207
[26]  P.P. Silvester, R.L., Ferrari, 1990, Finite Elements for Electrical Engineers, second ed., Cambridge University Press, Cambridge
[27]  G.N. Tsokas, P.I. Tsourlos, G. Vargemezis, M. Novack, 2008, Non-destructive electrical resistivity tomography for indoor investigation: the case of Kapnikarea Church in Athens. Archaeological Prospection 15: 47–61
[28]  G.N. Tsokas, P.I. Tsourlos, A. Stampolidis, D. Katsonopoulou, S. Soter, 2009, Tracing a major Roman road in the area of Ancient Helike by resistivity tomography. Archaeological Prospection 16: 251–266
[29]  P.I. Tsourlos, G. N. Tsokas, 2011, Non-destructive Electrical Resistivity Tomography Survey at the South Walls of the Acropolis of Athens, Archaeol. Prospect. 18, 173–186
[30]  P.T. Thacker, B.B. Ellwood, 2002, Detecting palaeolithic activity areas through electrical resistivity survey: an assessment from Vale de Obidos, Portugal. Journal of Archaeological Science, 29, 563-570