-
Paper Information
- Paper Submission
-
Journal Information
- About This Journal
- Editorial Board
- Current Issue
- Archive
- Author Guidelines
- Contact Us
Architecture Research
p-ISSN: 2168-507X e-ISSN: 2168-5088
2023; 13(3): 85-95
doi:10.5923/j.arch.20231303.01
Received: Dec. 5, 2023; Accepted: Dec. 20, 2023; Published: Dec. 23, 2023

Analysing Street Qualities, Copresence and Retail Shop Density in Kisumu City, Kenya
 Abstract
 Reference
 Full-Text PDF
 Full-text HTML
Peter Maluki Samburu, Fredrick Omondi Owino, Naomi Apali Mogoria
Spatial Planning and Design, Jaramogi Oginga Odinga University of Science and Technology, Bondo, Kenya
Correspondence to: Peter Maluki Samburu, Spatial Planning and Design, Jaramogi Oginga Odinga University of Science and Technology, Bondo, Kenya.
| Email: |  |
Copyright © 2023 The Author(s). Published by Scientific & Academic Publishing.
This work is licensed under the Creative Commons Attribution International License (CC BY).
http://creativecommons.org/licenses/by/4.0/

This study examines the relationship between street qualities, copresence and retail density in cities. The study was based on a cross-sectional survey design and focused on selected planned and unplanned settlements in the city of Kisumu. Data was collected using closed-ended questionnaires and was analysed using analysis of variance (ANOVA). The retail density of the four neighbourhoods was around 50% in Manyatta, 24.4% in Migosi, 16.6% in Arina and 8.9% in Nyalenda. Results on the association between selected street qualities and retail shop density showed a significant association between street width (F=7.589, p=.000); street amenities (F=4.064, p=.007); street safety (F=22.479, p=.000), therefore the null hypothesis was rejected. However, there was a non-significant association between retail shops and street lighting (F=1.389, p=.246); and spatial competition (F=1.157, p=.326) accepting the null hypothesis. The results of the relationship between street qualities and customer co-presence indicated a significant association between street width (F = 20.681, p = 0.000); street safety (F=17.409, p=0.000); street amenities (F=9.837, p=0.000); and street lighting (F=3.777, p=0.011) rejecting the null hypothesis. However, a non-significant relationship ensued with spatial competition (F=2.385, p=0.069) accepting the null hypothesis. Therefore, improving street width, lighting, safety and quality of amenities would affect the number of customers a retailer serves daily. The study recommends addressing street qualities by providing necessary amenities, lighting, and widths.
Keywords: Street Qualities, Copresence, Retail Shop Density
Cite this paper: Peter Maluki Samburu, Fredrick Omondi Owino, Naomi Apali Mogoria, Analysing Street Qualities, Copresence and Retail Shop Density in Kisumu City, Kenya, Architecture Research, Vol. 13 No. 3, 2023, pp. 85-95. doi: 10.5923/j.arch.20231303.01.
Article Outline
1. Retail Dynamics
- Retail shops are a vital part of any urban landscape, providing goods and services to local communities. The location of these shops is influenced by several factors, including the quality of the surrounding roads. In particular, location and retail density were described as a function of the ability to maximize profits at each location. Therefore, profit is at the heart of any commercial enterprise. Likewise, the location decision is one of the most pivotal strategic decisions that a retailer must make to succeed in the long term and ensure maximum returns (Turhan, 2013). Understanding the market dynamics and road quality of a shop is a valuable tool that allows investors or retailers to predict its performance. Strategic locations enable easy accessibility, attract many customers and increase retail sales potential. In a highly competitive retail environment, even small differences in location can have a significant impact on retail shop profitability and the resulting density (Sevtsuk, 2014).Therefore, location patterns are likely to change over time, as uncertainties initially make locations considered desirable and profitable initially undesirable and unprofitable. For example, Ghosh and Craig (1983) explained that population characteristics related to composition and density affect retail density change over time. As such, retailers should consider the dynamic retail environment, such as the dynamic competitive landscape. This requires knowledge of how factors affecting shop performance, such as profitability in a given market area, change over time. In addition, demographic change leads to heightened uncertainty about how effectively to meet consumers' needs and wants (Ingene & Lusch, 1980). In addition, road safety influences the choice of retail location. Investigations by Putrik et al. (2019) indicate that customers are more likely to visit shops in safe areas and retailers may avoid areas with high crime rates or safety concerns. Factors that affect safety include street lighting, police patrol quality, and the overall crime rate in the area. Retailers should also consider employee safety, especially when opening late.According to Turhan, Akalin and Zhir (2013), the location and ultimately the customer co-presence and retail density depend on factors such as population characteristics, competition and shop characteristics. When modelling retail shops' economic performance, it is critical to understand the demographics in which the shop is located. So far, this has been studied using various measures such as income, age, gender, travel patterns and shopping habits (Flagg, Bisakha, Kilgore & Locher, 2014). For example, customers with relatively low incomes carefully plan what to buy on shopping trips due to financial constraints (Du & Kamakura, 2008). In terms of gender, studies have shown that male consumers are more likely to compare prices to female consumers (Duffett & Foster, 2018). Moreover, research indicates that travel patterns influence shopping habits. For instance, people who travel more often tend to be more aware of the prices of products in different stores. They strive to find the most affordable deals. Furthermore, age has been identified as a significant factor in shopping behaviour, with elderly customers more likely to make purchases based on convenience, while younger customers are more inclined to base their decisions on price.Consequently, compared to women, men consider low prices an important purchasing criterion for products (Williams, 2002). Therefore, men show a higher tendency towards external reference prices. Conversely, women are more likely to use internal reference prices as they already know the prices and availability of different brands. Therefore, female consumers can circumvent the need to compare prices (i.e., external reference prices) as they typically do grocery shopping and dominate purchasing decisions about which foods they buy (Tariq, DSouza & Allaway, 2016). This is likely because women are the primary grocery shoppers, so they become familiar with the prices of different brands and items. As a result, they can make purchase decisions without having to compare prices at different stores. This is in contrast to men, who may not be as familiar with prices and may need to compare prices to get the best deal. However, it is pertinent to note that not all women are the primary grocery shoppers in their households. In some cases, men may be the primary grocery shoppers. In addition, even when women are the primary grocery shoppers, they may not always make purchase decisions. Men may also be involved in purchase decisions.The profitability of a retail business is the goal of every entrepreneur. As a result, retailers are locating their shops in areas that guarantee maximum sales and customer contact, affecting density (Samburu, Owino & Mogoria, 2023). However, finding an ideal location that meets these criteria is never easy. Studies have examined the location behaviour of companies in terms of social, political, economic and environmental factors (Hoogendoorn, Zwan & Thurik, 2019). The results suggest a statistically significant association between these factors and overall business location patterns. However, the contribution of street quality to customer co-presence and retail density is not yet clear - in terms of the impact of street width, safety, lighting and amenities on business performance.Therefore, when analysing potential location areas for guaranteed maximum profits, retailers must describe the purchasing habits of customers who live and/or work there (when they shop, frequency of purchase, how far they travel, their shopping preferences, hours of operation and location). Consequently, several factors such as the number of households, population size, population density, population growth rate, customer size and density, age, gender, education, occupation, marital status, household size, travel time or distance, rents, social class, cultures, and buying habits can be used to define characteristics of a population living in a proposed retail shop (Turhan, Akalin, & Zhir, 2013). These factors can help retailers gain a better understanding of the buying behaviour of the population, the potential demand for the products they are selling, and the type of customers they can expect to serve. This enables them to tailor their product offering and pricing strategies to meet the needs of the local population.A retail shop’s profit is also determined by the degree of competition with other companies. Therefore, retailers can consider proximity to other businesses when choosing the location of their shops. Retailers may prefer to locate near other businesses that attract similar or complementary customers. For example, a clothing shop might be near a shoe shop, or a coffee shop might be near a bookshop. This can create a sense of synergy between businesses as customers are more likely to visit multiple shops in the same area. A study by Kaunyangi (2014) found that competitive factors account for most differences in retail density between locations.In direct competition, a new retail shop is forced to compete with existing shops offering the same products to gain more market share (Grand, 2007). As for indirect competition, retailers offering unrelated products are also viewed as potential competitors for new entrants as they compete for the same consumer money. Each retailer competes with other retailers to take a portion of the spending from residents in each area. For a business to be successful in a competitive environment, retailers need to understand what happens when competitive factors are involved in the business's economic performance. Therefore, when deciding on a retail location, factors such as distance between retail shops, size and shops of several competitors, shopping alternatives, location with competitors, relative competitive strength and sales volume of competitors should be recorded and analyzed (Turhan, Akalin & Zhir, 2013).Customer presence and retail shop density are closely related to shop-specific characteristics such as ease of access, shop image characteristics and costs (Hosseini, Jayashree & Malarvizhi, 2014). Therefore, foot traffic is considered to be one of the most important factors that retailers consider when choosing a location. Retailers need to be located in high foot traffic areas to attract potential customers. This is especially true for retailers that rely on impulse buying, such as convenience shops or fast-food restaurants. Several factors can affect pedestrian traffic on a given street. For example, streets near public transportation hubs or tourist attractions tend to have higher pedestrian traffic. Likewise, streets near schools or universities can attract large numbers of students, which can represent a valuable customer segment for retailers. In addition to customer frequency, retailers also consider the accessibility of a given location when choosing a location for their business. These include factors such as the availability of parking spaces, the quality of public transport and the accessibility of the surrounding area. Retailers that rely on car traffic may prefer locations with ample parking, while retailers that rely on public transit may prefer locations near bus or subway stations (Parmar, Das & Dave, 2020). Additionally, retailers may be looking for locations in areas with well-maintained sidewalks and pedestrian crossings, which can make it easier for customers to access their shops.Likewise, shop image attributes such as shop layout, brand, quantity and quality of products are believed to explain the significant differences in retail performance. Branding and improving shop appearance through better layout affects not only revenue streams but also expenses (Schwager & Meyer, 2007). Therefore, retailers should consider the impact on shop profits before deciding to make any change to improve the shop's image. Finally, retailers should consider factors such as room size, construction costs, rent and renovation of the physical shop (Samburu, Hayombe & Owino 2019). On the other hand, the visual attractiveness of a street can also affect the location of retail shops. Retailers may prefer to locate in areas with attractive architecture, manicured streetscapes, and other visually appealing features. This can include factors such as the presence of public art, the quality of street furniture, and the cleanliness of the area. Retailers can also consider the general vibe of a particular street, including the presence of other businesses, noise and activity levels, and the general vibe of the area. There is also a relationship between retail density and income levels related to education and work. For example, a study by Su and Heshmati (2013) examined the determinants of income and the income gap between urban and rural China using ordinary least squares (OLS), conditional quantile regression, and blinder-Oaxaca decomposition methods. Results showed that individual characteristics such as job type and education were the most influential factors in determining income levels. Consequently, the research pointed to gender pay gaps, with men earning more than women. However, age, marital status, and household size indicated inconsistent and insignificant effects on income levels. In addition, Kazal, Rahman, and Hossain (2017) found that low-income levels are relatively higher among households characterized by landlessness, large families, lack of durable assets, poor housing and sanitation, wage labour, and illiteracy. Income can also vary by geographic location (Rahman, 2015). For example, income is likely to be higher in large settlements closer to the capital than in secondary urban cities further from the capital and scattered across the country (Rahman, 2017). While most studies have examined retail shop density based on population characteristics (Duffett & Foster, 2018), competition (Kaunyangi, 2014), and shop characteristics (Samburu, Hayombe & Owino 2019), the impact of street qualities in terms of street width, street lighting, safety, competition and amenities have been understudied in the context of planned and unplanned settlements in developing countries. It is worth noting that streets have historically been the locus for some of the highest levels of human activity and social interaction. They increase customer presence and the ultimate success of businesses. However, a street’s ability to support movements is influenced by certain qualities such as safety, width, amenities and infrastructure, and aesthetic values. Therefore, this study examines the perceived impacts of street qualities on customer copresence and retail shop density. For instance, street widths influence the freedom of movement of pedestrians, the presence of sidewalks, and the ability to accommodate outdoor retail space. Wider streets often allow for more foot traffic, which can result in higher retail density. A study by El-Geneidy, Grimsrud, and Wasfi (2012) found that wider streets in Montreal, Canada, are associated with greater retail density and increased economic activity. In addition, pedestrian-friendly streets with safe sidewalks, adequate lighting, and attractive streetscapes tend to attract more pedestrians and promote retail density. A study by Cervero, Sandoval, and Landis (2011) examined the relationship between walkability and retail density in San Francisco, USA, and found a positive association between the two factors. In summary, the location of retail shops is influenced by several factors, including the quality of the surrounding roads. Retailers consider factors such as foot traffic, accessibility, safety, aesthetics and proximity to other businesses when choosing a location. The influence of these factors can vary depending on the type of retail establishment and the location of the street. However, by considering these factors, retailers can select a location that maximizes their potential for success and provides valuable service to their customers.Similarly, urban processes affect the spatial distribution of retail shops within the city by changing the attractiveness of neighbourhoods relative to each other (Samburu, Owino & Mogoria, 2023). Above all, housing typologies primarily characterize the spatial distribution of retail through the differentiation of property and residential values in the settlements. This differentiation reflects differences in housing quality, length of housing, accessibility, amenities, public services and local population composition (Rosenthal & Ross, 2015). Moreover, there is a gap in defining the relationship between retail density and urban structure to control and minimize social and economic inequalities. Consequently, there is a research gap on how street qualities such as width, lighting, amenities and space competition affect customer co-presence and ultimately retail shop density in settlements. Therefore, this study addressed this gap by examining how the above factors influenced retail density in the selected study areas.
2. Methodology
2.1. Study Area
- The research was conducted in planned and unplanned settlements of Kisumu City, Kenya as shown in Figure 1. The settlements were chosen based on their location and the type of streets, which were divided into regular and irregular streets. Migosi Estate and Arina Estates are typical settlements with regular street structures, while Nyalenda and Manyatta have irregular street structures.
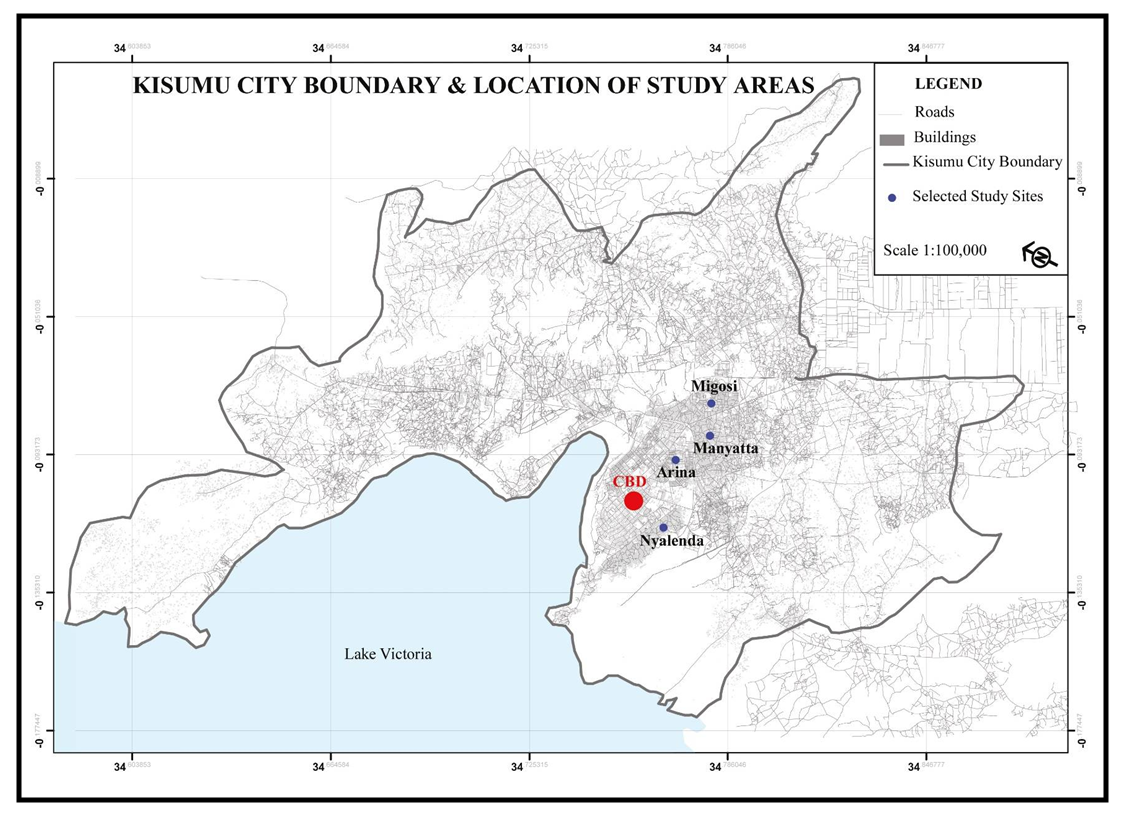 | Figure 1. Location of the Study Sites |
2.2. Target Population
- Asiamah, Mensah and Oteng-Abayie (2017) define the target population as a population whose results are generalized. It is also the total collection of all elements in any field of study (Kothari, 2004). The target group of this study are retailers of Migosi, Arina, Manyatta and Nyalenda. At the time this study was conducted, no documented statistics on retailers and their respective locations were available in any of the selected study areas. Therefore, the study conducted an inventory survey in each study area to determine the number of retailers and their locations. The term inventory refers to mapping and is often used for data collection (Rew, Radosevich & Pokorny, 2006). As part of the survey, a total of 1,434 retailers were recorded using the Global Positioning System (GPS) and thus represent the overall target group of this study.
2.3. Sampling and Sample Size
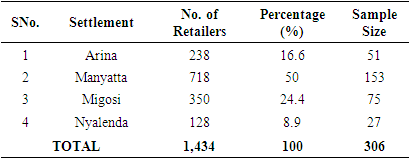
- The study used a multi-stage sampling technique to select the study areas and sample size. First, the informal settlements were compared with their respective number of households, recorded by Karanja (2010) as Bandani (2,402), Obunga (6,600), Manyatta (12,694), and Nyalenda (9,985). Settlements with the highest number of households were chosen as this would provide a larger sample size for more comprehensive and statistically significant results, allowing for a better generalization and representation of the population (Kothari, 2004). In this case, the informal settlements of Manyatta and Nyalenda were chosen. On the other hand, formal settlements were conveniently chosen for their proximity to the selected informal settlements to facilitate comparison. Formal settlements included the Migosi and Arina estates. An inventory survey was conducted from each settlement to determine the location of the retailers. This approach allows the researcher to move along a section of the study area and search for all relevant information about a given phenomenon (Navarro & Díaz-Gamboa, 2015). Subsequently, systematic random sampling was used to extract a representative number of retailers at regular intervals without biases (Lohr, 2019). Moreover, the sample size determination table by Krejcie and Morgan (1970) was used to extract the sample size of 306 retailers and shops. This number was then distributed proportionally to each settlement as shown in Table 1. The Nth term was obtained by dividing the total number of retailers by the sample size of each selected study area. The result of each case was five (5) after rounding to the nearest whole number.
|
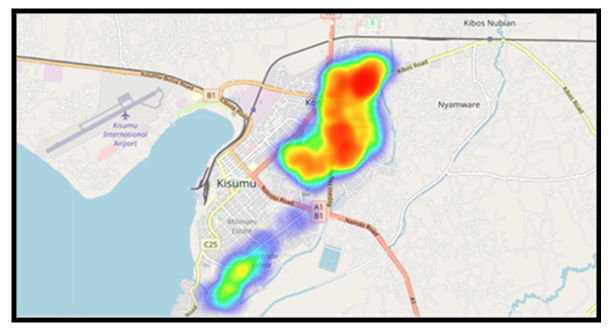 | Figure 2. Heat Map of the Respondents |
2.4. Methods of Data Collection and Analysis
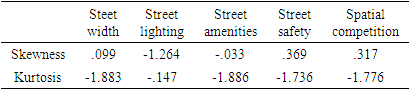
- The study used a questionnaire as a survey tool to collect information from individuals about themselves or a social unit such as a household (Kabir, 2016). In addition, they allow the collection of basic descriptive information from broad samples (Kothari, 2004). The method was used for objective three: To examine selected street qualities and their association with customer copresence and retail shop density. The questions were mostly closed. Sreejesh, Mohapatra, and Anusree (2014) found that closed-ended questions are easy to use and simplify the process of tabulation and analysis because they limit respondents to the choices offered.In this study, the KoBoCollect toolkit was used for data collection instead of printed questionnaires. Dauenhauer et al. (2019) showed that surveys using printed questionnaires are limited in terms of cost, require physical distribution, processing, and return of survey results, and have a high potential for error. Therefore, in this study, the KoBoCollect toolbox, an Android-based digital questionnaire tool, was used as an open-source field data collection facility to facilitate field data retrieval.The toolkit combines labour and equipment, such as paper questionnaires, GPS, cameras, audio recorders, and other tools, into a tool that connects to a smartphone (Nampa, Mudita, & Kaho 2020). In addition, this tool is easier to use as the data table is automatically generated and georeferenced points and heatmaps of the respondents are generated (Deniau et al., 2017). Map 3.6 is an example of the questionnaire management exercise heat map.Further, analysis of variance (ANOVA) was used to test the corresponding null hypothesis. According to Sawyer (2009), ANOVA is a statistical test to detect differences in group means when there is a parametric dependent variable and one or more independent variables. A central assumption of this method is that the data on the study variables must be normally distributed. Therefore, normality tests were performed by examining the skewness and kurtosis of data whose values should range from -3 to +3 for normally distributed data (Tabachnick & Fidell, 2007).
3. Results and Discussions
3.1. Normality Test on Street Qualities
- The normality of the data was assessed by examining their skewness and kurtosis. The results in Table 2 show that the variables are normally distributed and the values for skewness and kurtosis values range from -3.0 to +3.0. Therefore, further tests can be carried out.
|
3.2. Number of Customers Served in a Day (Customer Copresence)
- The study profiled the number of customers each retailer served in a day to determine the retail shop’s ability to attract customers. The results show that 23.1% of retailers served 51 customers and above; 22.7% (21-30 customers); 18.2% (41-50 customers); 16.6% (11 – 20 customers); 11.7% (31- 40 customers); and 7.8% (1-10 customers) in a day. Cumulatively, 75.7% of the retailers served more than twenty (20) customers a day. This means that retailers can guarantee a daily flow of customers in their shops.
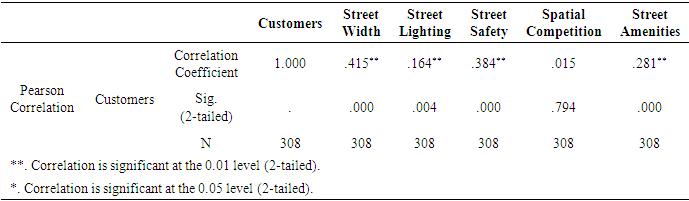
3.3. Correlation Between Street Qualities and Customer Copresence
- The study examined the correlation each street quality had with the number of customers served by the retail shops in the selected study areas by calculating Pearson’s correlation coefficients. The results of the correlation coefficients for street width and customer copresence were (r=.415, p=.000), street lighting and customer copresence (r=.164, p=.004), street safety and customer copresence (r=.384, p=.000), spatial competition and customer copresence (r=.015, p=.794), and amenities and customer copresence (r=.281, p=.000), as shown in Table 3.
|
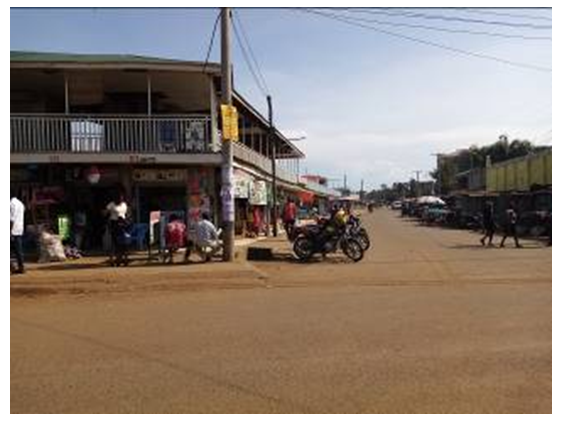 | Figure 3. Retail Shops along Kondele – Manyatta Road |
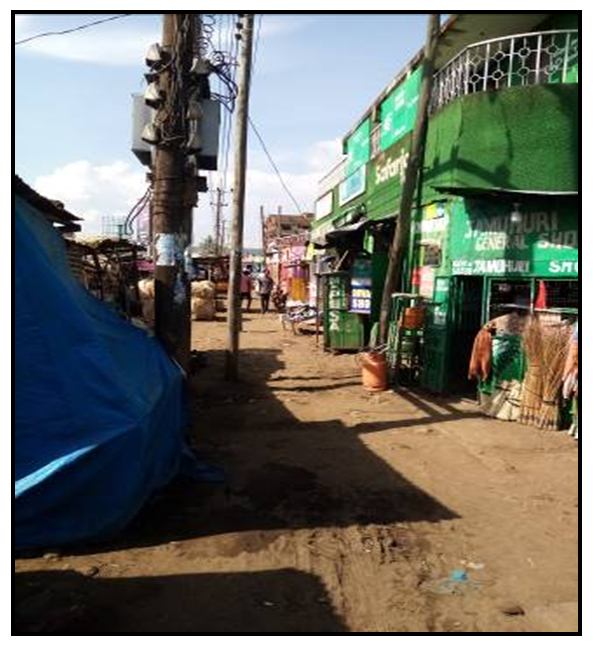 | Figure 4. Example of a Narrow Street |
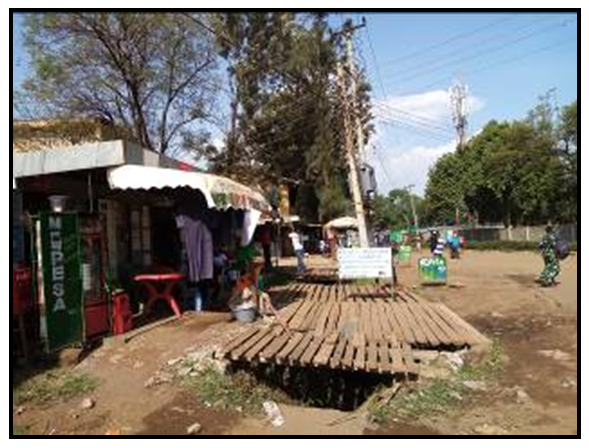 | Figure 5. Example of a Fabricated Wooden Drainage Cover |
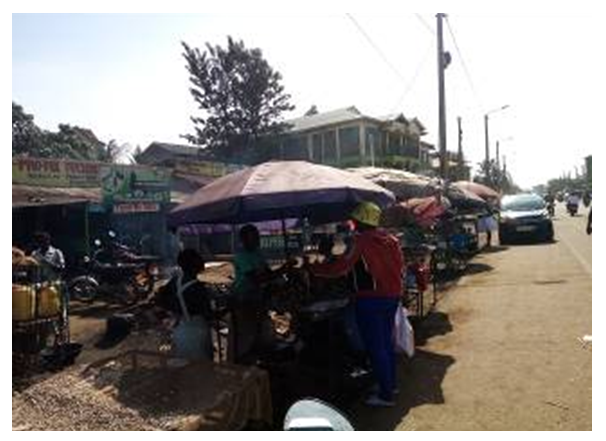 | Figure 6. On-street Spatial Competition of Retail Shop and other Vendors |
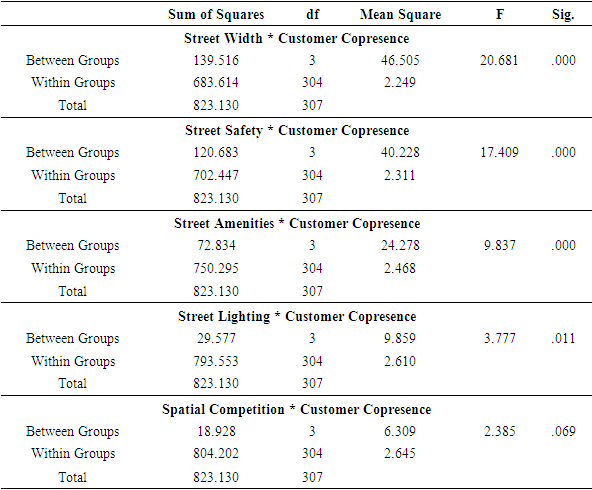
3.4. Test of Hypothesis on Street Qualities and Customer Co-presence
- Hypothesis: H01: There is no significant association between selected street qualities and customer copresence.The null hypothesis was tested using analysis of variance (ANOVA). The results of the relationship between street qualities and customer co-presence were: street width (F = 20.681, p = 0.000); street safety (F=17.409, p=0.000); street amenities (F=9.837, p=0.000); street lighting (F=3.777, p=0.011); and spatial competition (F=2.385, p=0.069), as shown in Table 4.
|
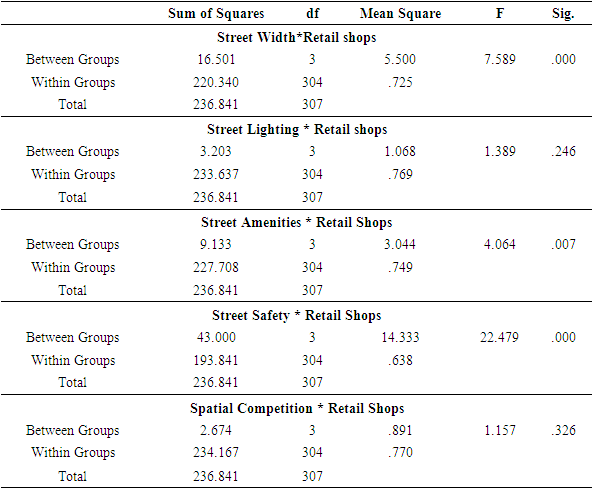
3.5. Test of Hypothesis on Street Qualities and Retail Shop Density
- The study sought to establish whether the selected street qualities had an association with retail shop density. The corresponding hypothesis was that “there is no significant association between the selected street qualities and retail shop density”. Consequently, this hypothesis was tested using a one-way analysis of variance. The results shown in Table 5, showed a significant association between retail shops and street width (F=7.589, p=.000); street amenities (F=4.064, p=.007); street safety (F=22.479, p =.000), therefore, the null hypothesis was rejected. However, there was a amenities non-significant association between retail shops and street lighting (F=1.389, p=.246); and spatial competition (F=1.157, p=.326) accepting the null hypothesis.
|
4. Conclusions
- In conclusion, this study delved into the intricate interplay between street qualities, copresence, and retail density in the context of Kisumu's planned and unplanned settlements. Employing a cross-sectional survey design and utilizing closed-ended questionnaires, the research uncovered noteworthy insights into the relationships between various street qualities and both retail shop density and customer copresence.The findings revealed that street width, street amenities, and street safety exhibited significant associations with retail shop density, indicating that these factors play pivotal roles in shaping the retail landscape. Conversely, street lighting and spatial competition were found to have non-significant associations with retail shops, suggesting that these aspects may not be as influential in determining retail density.Moreover, the study shed light on the relationship between street qualities and customer copresence. Street width, street safety, street amenities, and street lighting emerged as significant factors influencing customer presence, underscoring the importance of these elements in attracting and retaining customers for retailers. On the other hand, spatial competition exhibited a non-significant relationship with customer copresence, implying that it may have a lesser impact on the presence of customers in retail spaces.The implications of these findings are crucial for urban planning and development. The study advocates for the improvement of street width, lighting, safety, and the quality of amenities as effective strategies to positively influence both retail density and customer copresence. By addressing these aspects, city planners and policymakers can create environments that not only support thriving retail businesses but also enhance the overall urban experience for residents and visitors alike. This research contributes valuable insights that can guide future urban development initiatives aimed at fostering vibrant and sustainable cities.