Architecture Research

p-ISSN: 2168-507X    e-ISSN: 2168-5088

2023;  13(2): 59-83

doi:10.5923/j.arch.20231302.03

Received: Oct. 11, 2023; Accepted: Oct. 23, 2023; Published: Oct. 28, 2023


Urban Spatial Structure and the Density of Retail Shops in Cities

Peter Maluki Samburu, Fredrick Omondi Owino, Naomi Apali Mogoria

Spatial Planning and Design, Jaramogi Oginga Odinga University of Science and Technology, Bondo, Kenya

Correspondence to: Peter Maluki Samburu, Spatial Planning and Design, Jaramogi Oginga Odinga University of Science and Technology, Bondo, Kenya.

Email:

Copyright © 2023 The Author(s). Published by Scientific & Academic Publishing.

This work is licensed under the Creative Commons Attribution International License (CC BY).
http://creativecommons.org/licenses/by/4.0/

Abstract

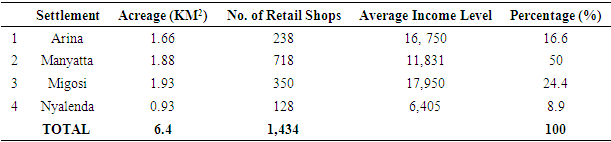
The variability of the location and retail shop density relative to the urban structure of informal and formal settlements are pervasive issues in many cities. Therefore, this study examines the relationship between street metric properties and retail shop density and the association between spatial intelligibility, synergy and retail shop density. The study was based on the space syntax theory and focused on selected planned and unplanned settlements in the city of Kisumu in Kenya. Data was collected through inventory surveys and analysed through spatial kernel density analytic estimation, axial line analysis and regression analysis. The retail density of the four neighbourhoods was around 50% in Manyatta, 24.4% in Migosi, 16.6% in Arina and 8.9% in Nyalenda. Results indicated a significant association between street metric properties and retail density in the study (Arina: F=3.41, p=0.012; Migosi: F=34.13, p=0.000; Manyatta: F=9.918, p=0.000; and Nyalenda: F=13.837, p=0.000), rejecting the null hypothesis at 0.05 significance level. Findings on synergy indicated a stronger relationship between local integration (R3) and global integration (Rn) in Manyatta (R2=0.6777) but not in Nyalenda (R2=0.4949), Migosi (R2=0.4881) and Arina (R2=0.3461). Intelligibility results showed relatively low scores in each settlement indicating poor navigability of the settlements. However, the informal settlements of Manyatta and Nyalenda showed better intelligibility (R2=0.3752 and R2=0.2496) than the formal settlements (Migosi and Arina), which showed R2=0.1380 and R2=0.1744, respectively. The study findings indicate that street metric properties vary across settlements and have different impacts on retail shop density, with informal settlements exhibiting stronger synergies compared to formal neighbourhoods. Additionally, all settlements lack intelligibility, suggesting that the street networks are not well connected, both locally and citywide. To address this issue, the study recommends improving citywide accessibility and ensuring interconnected streets to enhance settlement intelligibility.

Keywords: Urban Structure, Retail Density, Street Metrics, Intelligibility, Synergy, Space Syntax Theory

Cite this paper: Peter Maluki Samburu, Fredrick Omondi Owino, Naomi Apali Mogoria, Urban Spatial Structure and the Density of Retail Shops in Cities, Architecture Research, Vol. 13 No. 2, 2023, pp. 59-83. doi: 10.5923/j.arch.20231302.03.

1. Introduction

The spatial configuration of urban environments, including the layout of streets, buildings, and public spaces, can change over time. These changes can lead to uncertainties in predicting how urban structure and retail location variability will unfold in the future. As Foucault (1975) argues in his book, titled: “Discipline & Punish: The Birth of the Prison”, Urban spaces are not neutral; they are shaped by various actors and power structures. Foucault's examination of how power operates through surveillance, discipline, and normalization mechanisms can explain how power is exercised and negotiated in urban environments. The ambiguity, therefore, is that cities should not only be examined based on their morphological characteristics but also on power, spatial control and regulations, and norms of urban governance that shape their growth over time.
Further, reinforcing the dynamics discussed above, in her book, “The Architecture of Political Life" Sjöholm (2020) explores the intersection of Hannah Arendt's political philosophy and the architecture of the city. In the book, Sjöholm examines how Hannah Arendt's ideas can be applied to understand the architecture of political life in urban environments. She explores Arendt's concepts, such as the public realm, plurality, power, and action, and reflects on their implications for urban spaces and their design. Sjöholm investigates how the architecture of the city can facilitate or hinder political engagement, public discourse, and democratic processes. She discusses the importance of public spaces, such as squares, parks, and streets, as arenas for political action and the formation of public spheres. Sjöholm also examines the role of urban governance structures and institutions in shaping power dynamics and influencing the architecture of political life. By combining Arendt's political philosophy with architectural theory, Sjöholm offers insights into how the physical environment of the city interacts with political life, influencing social interactions, public engagement, and the formation of collective identities. The book provides a unique perspective on the relationship between urban spaces and the practice of politics, highlighting how architecture can shape and support democratic processes in the city.
Consequently, these dynamics manifest in the urban structure of most African cities through formal and informal settlements. It is worth noting at this point that informality varies from one country to another and what may be considered informal in Sweden or the USA is different from the Kenya perspective. The insights provided by Foucault (1975) and Sjöholm highlight universal variables of urban governance that dictate urban growth dynamics in cities.
Linking this to the economy of cities, Theurillat (2022) argues that urban governance affects how urban areas are spatially organised and, if done poorly, can obstruct economic growth and restrict access to retail businesses, particularly for residents living in marginalized or underserved communities. Poor governance and lack of planning result in settlements, which are characterized by densely populated areas, typically lacking basic amenities, infrastructure and order in retail establishments. Retail shops in unplanned areas are often unregulated and their locational patterns are unpredictable thus providing limited product choices and uncertain quality. The lack of planning for formal retail options contributes to social and economic inequalities experienced by residents in these settlements. The aesthetic appeal of buildings and overall infrastructure within which retails operate is pitiful.
The urban structure of informal settlements, such as narrow or unpaved streets, inadequate infrastructure, and limited public spaces, further complicates the establishment and operation of formal retail shops. Retailers face challenges related to logistics, accessibility, and security, making it unattractive or unfeasible to set up businesses in these areas. Previous studies have also associated the variability of the location and density of retail shops with demographics, competition, accessibility, market demand, costs, regulations, urban planning, and consumer preferences (Hoogendoorn, Zwan & Thurik, 2019). However, the influence of the underlying urban structure in terms of the street metrics of these settlements has been understudied.
Researchers have pointed out that the urban structure of settlements in terms of their spatial configuration and connectivity determines the variability of the location of retail shops in Cities (World Bank, 2019). The arrangement of streets, pathways, and public spaces within a city can affect the flow of people, the accessibility of economic hubs, and the formation of social networks. Areas with high connectivity and easy movement tend to attract more retail activities and investment, while areas with low connectivity and limited accessibility experience low investments, perpetuating economic disparities. Moreover, spatial segregation based on income and social status can reinforce variabilities in the location of retail shops.
Spatial planning and design have been used as a tool to formulate zoning regulations that define the urban structure and the economy of settlements in Cities (Ozuduru & Guldmann, 2013). However, most plans and designs are never evaluated to determine their implications on the overall accessibility in terms of intelligibility, synergy, connectivity, choice, integration, control and segregation of the street networks. As such, the street metric properties and how they influence the economy of cities are never investigated thoroughly resulting in failures of planned land uses. Similarly, the upgrading of informal settlements has majorly focused on establishing new roads, connecting missing links and improving the quality of infrastructure (World Bank, 2019). These interventions in most cases happen without an investigation of their underlying structure which often results in increased crime and failure of businesses. As such, this research investigates the urban structure of the formal and informal settlements and its influence on the density of retail shops in Kisumu City.
Retail shops in Kisumu are characterised by permanence and temporality depending on their premise of operation. Those with permanent attributes operate within established buildings that are either rented or owned and their locations are predictable with certainty. On the other hand, temporary retailers are unpredictable and operate along the streets often referred to as street vendors. The basis for accurately predicting the spatial patterns of retail shops, regardless of the type of settlements they operate in, is the concept of simple location. In his book, Whitehead (1925) “Science and the Modern World: The Eighteenth Century” explained that simple location means that, in expressing its spatiotemporal relations, is where something is, in a definite region of space, and throughout a definite finite duration of time, apart from any essential reference of the relations of that bit of matter to other regions of space and to other durations of time. He further argued that the concept of simple location is independent of the controversy between the absolutist and relativist views of space and time. In this sense, therefore, retail location can be regarded as spatiotemporal and studying requires the use of a cross-sectional survey research design which involves data collected from target items at a single point in time and space. Further to this, Sjöholm states that “… space or place, properly speaking, is not the city-state in its physical location; it is the organization of the people as it arises out of acting and speaking together, and its true space lies between people living for this purpose, no matter where they happen to be”. As such, this extract expounds on the concept of simple location including human presence (traffic) in space and time. This is so because retail performance depends on customer densities. These densities, however, vary in space and time.

1.1. Urban Structure and Retail Density

Retail is an integral part of modern cities' economy and fabric. The existence of a diverse business hierarchy indicates a city's status and prosperity (Jarah, Zhou, Abdullah, Lu & Yu, 2019). In addition, customer access to commercial transactions is considered a key indicator of a city's quality of life. The organization of the business sector has explicit spatial consequences. Commercial developments are indispensable in urban centres' formation and classification (Christaller, 1966). Agglomeration and spatial economic clusters are location strategies aimed at increasing business returns (Arentze, Oppewal & Timmermans, 2005). Retail shop density in urban areas reflects general demand conditions, population density, purchasing power, buying habits and easy accessibility (Maraschin & Krafta, 2013).
Consequently, retail clusters attract developments in their surroundings. This leads to residential densification, appreciation of real estate and land, improved infrastructure and services, and improved transport, among others. According to Longley et al. (2003), retail density in the city can be thought of as a co-evolutionary process, with changes in city-wide structures influencing changes in shopping trends. Because retail is essentially a demand-driven activity, businesses' failures or successes depend on their responsiveness and ability to adapt to changes in the city-wide environment. It is therefore essential for businesses to understand the changing dynamics of their local retail environment to stay competitive and successful. Longley et al. (2003) argue that the retail landscape is constantly changing and those who can identify and leverage these changes will be the most successful.
Spatially, these dynamics are reflected in the continuous emergence of diverse retail activities with different location strategies (Maraschin & Krafta, 2013). Commercial zones emerge and evolve, competing with others that serve consumer needs more efficiently. Initially, the emergence of new shopping centres within the city can be triggered by various factors: the concentration of the population in a new part of the city, the opening of additional streets, the location of some pioneering companies that attract others, the expansion of a shopping mall, etc. From inception, commercial zones may grow faster or slower (Ren, Guo, Zhang, Kisovi & Das, 2020). In addition, these areas can accommodate many premises or be stabilized in smaller quantities. Empirical evidence suggests that some business parks reach saturation levels before others and grow strongly over longer periods in terms of city development (Maraschin & Krafta, 2013). This implies that the development of commercial zones is an important factor in urban planning. It is essential to consider growth rates, saturation levels, and external factors to ensure successful commercial development.
In addition, urban structure and development have changed around the world with the growth of retail outlets and centres, sub-urbanization and new projects in cities. Housing and retail are the first activities to be decentralized, making them the most critical foundations of the built environment and the city economy, as Hutton (2008) pointed out in the context of the inner and boundless city. The retail sector is vital because it: provides goods and services to city dwellers and tourists; employs a significant part of the workforce; supports local development and property values; promotes a sense of the vitality of city life closely related to the flow of people in shopping areas (Theurillat, 2022); and influences the development of urban areas. Additionally, retail businesses provide a platform for innovation, entrepreneurship, and evolving business models. They also contribute to communities' economic health and well-being and are essential for local economic growth.
Cities have grown outward due to population growth, but the city centres' future is less certain. Urban planning and design plans have been implemented in certain areas, but in others, market forces have transformed the retail landscape. Retailers try to strengthen their adaptability through creative methods in these locations (Ozuduru & Guldmann, 2013). Retail significantly influences the local and global economy. The proportion of retail businesses is relatively high and is therefore increasingly used to generate property rental income. Local governments favour these developments due to the taxes involved and the ease with which retail sales can be tracked. This has led to a rapid increase in retail stores in cities all over the world. As a result, the retail sector is one of the most substantial economic drivers in many urban areas.
The fact that retail density reflects how much an area has expanded and urbanized, which is a sign of progress and advancement, is another reason why national governments favour it (Corpataux, Crevoisier & Theurillat, 2017). These businesses encourage the need to devote time to consumption in daily life, which coincides with the growth of consumer culture around the world. Compared to previous decades, the share of retail trade in the gross domestic product is now considered in many countries. Retail shops in these centres have special prospects due to the large-scale, international organization of retail trade. These companies benefit from the agglomeration economy, accessibility, marketing potential of larger areas and pedestrian traffic (Camagni, 2017). However, for city street shops, the situation is reversed and retailers face financial instability. Their adaptability is less predictable and their competitiveness is weaker. The independent incumbent retailers, which are the key players in the central business district, are limiting their ability to expand. This can lead to a decrease in the diversity of the retail offer, as well as an increase in vacancy rates in the city centre. As a result, the economic activity of the city is weakened.
Retail markets in inner-city neighbourhoods have been strengthened as policymakers seek to shorten routes to the market. One strategy is to support innovative retail models that take into account the surrounding pedestrian zones. The goal is to create a vibrancy that attracts greater retail density, which in turn creates more jobs and taxpayer money, improves the sense of place and community, and entices shoppers to visit other shops (Maraschin & Krafta, 2013).
Ongoing dynamics in the relationship between retail outlets and urban space pose different challenges to understanding them. There are theoretical limitations in identifying the rules that guide the evolution of the retail system and how retail density can be controlled. For retailers, making an inappropriate location decision is risky and difficult to reverse (Longley et al., 2003). This increases the importance of studies dealing with the dynamic development of retail centres in urban areas.
Over time, location theories have been formulated and debated to explain retail density in urban areas. For example, central-place theory explains the hierarchy, number, and location of settlements or businesses (Vionis & Papantoniou, 2019), while bid-rent theory discusses the impact of land values and associated transportation costs on land-use patterns (Chidi, 2019). Other theories have focused on industrial location (Weber, 1928) and spatial interaction (Reilly, 1931). Although there has been criticism of the reliability of these theories in explaining the spatiotemporal retail shop density, they provide a strong reference for space planning and design (Rodrigue, 2017). This study draws on the spatial syntax theory conceived by Hillier (2007) as a guide to explaining urban morphological features and their definition of the form, functionality and performance of buildings, roads, cities and even landscapes (Hillier, 2007). The theory underpins urban circulation attributes that measure, explore, predict and assess the strength of accessibility and the occurrence of activity using quantitative indicators (Samburu, Hayombe & Owino, 2019).
A comparative approach is taken to explain the locational differences between retail shops in formal and informal settlements. The approach enables an understanding of the differences or similarities between settlements based on urban structure attributes. In addition, it provides a basis for further discourse on the spatial character and organization of urban areas. Spatial intelligibility is the degree of correlation between road connectivity and integration (Kim, 2001). A well-understood spatial configuration shows a better correlation between spatial syntax measures and different behaviour (Hillier, 2007).
Similarly, other studies have compared retail shop density in planned settlements (Froy, 2016; Narvaez, Penn & Griffiths, 2015) and unplanned settlements (Samburu, Hayombe & Owino, 2019; McCartney & Krishnamurthy, 2018; Mohamed, Van Nes, & Salheen, 2015). The results indicate a significant association between street-related characteristics and retail shop location. However, in both contexts (planned and unplanned) there are different results on which attributes best predict retail density. The study, therefore, examines these street metric properties through a comparative approach of formal and informal settlements.
This study is based on the finding that spatial intelligibility and synergies of settlements, location and business performance are crucial indicators of urban sustainability in terms of income levels and quality of urban life (Ren, Guo, Zhang, Kisovi & Das, 2020). Income inequality in cities is reflected in the characteristics of formal and informal settlements, which remain a barrier to urban sustainability. As a result, urban systems are complex and multi-layered (Alalouch, Al-Hajri, Naser & Al Hinai, 2019). These layers are best described by Hillier (2007) who claims: that...the underlying structures in the city reveal the spatial form of a self-organized city as a superficial network of interconnected centres whose character reflects urban life and income levels. Therefore, this study examines urban morphological features and their association with retail density by examining street metric properties.
This research aims to improve the understanding of how the spatial attributes of cities change retail shop density and the socio-spatial organization of cities. The research addresses two questions: How do intelligibility and synergy of settlements affect retail shop density? The study compares retail dynamics in selected planned and unplanned settlements in the city of Kisumu, based on their changing composition and the development of their population. The study examines retail shop density using the space syntax theory. This new knowledge improves future urban planning and influences the planning of cities.
Understanding the relationship between intelligibility, synergy and retail shop density in cities provides a context in which design proposals can be evaluated to achieve the desired design goal (increasing or decreasing the navigability and vibrancy of an area), particularly by strengthening the relevant spatial properties that are inherited from the design itself (Bibri, Krogstie & Karrholm, 2020). In particular, the relationship between the intelligibility and synergy of an area and the ability of spatial attributes to predict the economy of cities is of substantial use in the context of evaluating urban design proposals for upcoming developments.
A study by Alaloucha, Al-Hajria, Naserb, and Hinaia (2019) investigated the impact of spatial attributes of space syntax on urban land use in Muscat. The study aimed to investigate whether “spatial intelligibility” affects the relationship between land use distribution and settlement spatial attributes. To examine the degree of intelligibility of the two neighbourhoods, a scatter plot between connectivity and integration was examined for each neighbourhood separately. Similarly, the Spearman correlation coefficient confirmed that there was a significant positive correlation between the two variables in Neighborhood A (r (77) = .890, p<0.001); whereas in Neighborhood B, the relationship was remarkably less strong (r (336) =0.240, p<0.001). This indicated that Neighborhood A was significantly more intelligible than Neighborhood B. Results suggest that the effect of spatial arrangement on land use distribution was more severe in highly intelligible spatial configurations. Therefore, comparing the intelligibility of settlements would provide a basis for highlighting disparities in infrastructural investments and consequently, profile economic base differentials.
This study investigates spatial intelligibility and synergy of settlements and their relationships with retail shop density. Spatial intelligibility and synergy play a central role in comparing and understanding land use variability in cities (Omer & Gabay, 2007). The density and scale of retail investments are strong indicators of economic performance and quality of life in urban areas (Turok & McGranahan, 2013). Moreover, accessibility impacts have been measured as part of Gross Domestic Product (GDP) at regional levels or as priced into retailers' income at the micro-level (DiPasquale & Wheaton, 1996). In addition, shifts in accessibility distributions associated with labour market changes have been studied (Geurs & Ritsema, 2001).
A study by Omer and Gabay (2007) examined the impact of spatial integration and intelligibility of city layouts based on street patterns on the homogeneity/heterogeneity of income distribution in six towns in Israel. This was done using a combination of social census data with Geographic Information Systems (GIS) and Space Syntax methods. The results showed that towns with higher levels of global integration and intelligibility had higher income distributions. The research concluded that towns with high spatial integration (between streets) and intelligibility in terms of income levels are integrated within a city. While this research does show a correlation between the two variables, many other factors could affect income distribution in a city. For example, the presence of industry, the number of jobs available, the cost of living in the area, etc. all play a role in income distribution and cannot be ignored.
Netto and Furtado (2017) studied the effects of spatial configuration, mobility, and location on the spatial and social behaviour of residents of social housing complexes in Rio de Janeiro, Brazil. The results justified the high dependence of mobility on income. First, the research suggested that social interactions are a product of the encounter circumstances. Second, cities are spatially structured to encourage interactions that are defined by location patterns and accessibility. Third, the vibrancy of places increases with the convergence of people who share common interests and mobility.
Finally, income levels play a crucial role in shaping mobility patterns in cities. Budget-strained people face further limitations on their mobility, increasing locality and reliance on proximity to enhance social life (Marques, 2015). As a result, the density of encounters and movement tends to increase as people use spaces within neighbourhoods to build and enhance relationships. This is because people living in densely populated areas have more opportunities to interact with each other. This increased proximity allows them to form more meaningful relationships and build social networks. Additionally, income levels can shape mobility patterns, as those with lower incomes may not be able to afford the same level of access to transportation, which limits their ability to move around the city and interact with people in other neighbourhoods.
In the reviewed literature, intelligibility and synergy were mainly used to study income and residential land use distributions. A research gap exists in examining the intelligibility and synergy of planned and unplanned neighbourhoods and their relationship with retail density in developing countries. Most research focuses primarily on intelligibility, with little or no reporting of synergy as a measure of urban vibrancy, as explained by Hillier (2007). This research gap provides an opportunity to further investigate the factors influencing retail density and vibrancy in the context of the intelligibility and synergy of different types of neighbourhoods. Hillier (2007) argued that urban vibrancy is a combination of two concepts: intelligibility, which is how easy it is to navigate a city or neighbourhood, and synergy, which is the social and economic relationships created when diverse elements of a city or neighbourhood interact. This research gap provides an opportunity to explore how the intelligibility and synergy of different neighbourhoods affect the retail density and vibrancy of the area.

1.2. The Space Syntax Theory

To explain the variability of the “location” and density of retail shops, in the context of informal and formal settlements, the research is premised on the Space Syntax Theory. This theory is a widely accepted and useful tool for understanding the spatial configuration of cities, the movement of people, and the formation of social networks in urban environments. Space syntax is a theoretical and analytical framework developed by Bill Hillier and his colleagues in the 1970s, which uses the spatial configuration of the built environment to explain the behaviour of people. It is based on the idea that spatial configuration has a direct impact on social and economic activities, and can be used to understand urban systems, particularly with retail location and spatial/social segregation (Netto & Furtado, 2017). It is a way of analysing and understanding the relationships between people and space. The theory is based on several key concepts: such as configurational analysis of the built environment, rather than just individual buildings or spaces. The theory is based on the idea that the spatial configuration of the built environment can be described using a set of mathematical algorithms, which can be used to model the movement of people through space (Alaloucha, Al-Hajria, Naserb, & Hinaia, 2019). This has a direct impact on the formation of social networks, and the behaviour of people within those networks.
Space syntax theory applies certain measures of centrality to determine the overall accessibility strength of a settlement. These include betweenness, integration, connectivity, and mean depth as explained below
1. Betweenness (Choice) Centrality: Explains the degree to which a street falls on the shortest path between others and therefore has a potential for controlling communication (Freeman, 1977). In other words, it is based on the idea that a link is central if it lies between many other nodes, and is traversed by many of the shortest paths connecting other nodes (Wang & Fu, 2017). It describes the influence that a link has within a neighbourhood. Therefore, the larger the index, the more the number of the shortest path between any two nodes passing through that link in the network. The main advantage of betweenness is that it provides a simple cognitive model of how an urban movement pattern emerges, a model which is lacking in the integration measure (Dalton, 2010). Simply explained (Dalton, 2010) as follows: It can be assumed that the city has a large population engaged in moving from one building to another. Each resident considers the distance from their current location to their intended destination as the simplest cognitive model. If there is more than one equally short choice, half the population will choose one direction and half the other direction.
2. Integration Centrality: Describes the average depth of a link to all other links in the network. The links of a network can be ordered from the most integrated to the most segregated. Integration centrality values in street network modelling measure to what extent a certain link is near all the other links in a system along the shortest path. High-closeness (integrated streets) links have many connections within a short distance while low-closeness (segregated streets) will have few connections at a short distance (Sawarkar & Patil, 2019). In other words, integration centrality measures how accessible or connected a street is to all the other streets in the settlement (Al-Saaidy & Alobaydi, 2020).
Figure 1. An Axial Map (b) and Integration map (c) of a Settlement (a)
The fewer the changes of direction a given street has to all other streets in the system, the higher its integration, and thus its mutual accessibility. In short, the longer the axial line in an urban area, the higher its connection to other lines and the higher its integration value and vice versa. Therefore, high integration values indicate streets that are well connected, while low values indicate streets that have fewer connections with the other streets (Hillier, 2007).
3. Connectivity Centrality: This metric measure characterizes the local features of a network. In street network modelling, it reflects the number of streets or links that are directly connected to each respective street (Wang & Fu, 2017). Most links have about three to four adjacent links, and a few key links have higher connectivity. Links with high connectivity correspond to the city's key sites and major transfer sites (Al-Saaidy & Alobaydi, 2020). A node with 10 street connections would have a connectivity centrality of 10. A node with 1 edge would have a degree centrality of 1.
4. Control Centrality: It is the sum of the inverses of the parameter connectivity of all neighbours of the selected axial line. It measures the degree to which a given space controls access to all immediate neighbours of the axis line. It takes into account all alternative connections that these neighbours have (Jiang, Claramunt, & Klarqvist, 2013). This is a dynamic local measure. According to Al-Saaidy and Alobaydi (2020), a high index of control indicates that a space has a significant level of control or influence over movement patterns in the surrounding network. This means the space is strategically located and serves as a central point from which many other spaces can be easily accessed. This means the space has a strong potential for attracting pedestrians or vehicular traffic and may have a higher level of visibility, connectivity or functional importance compared to other spaces.
5. Intelligibility: Intelligibility is the ease with which individuals can navigate and understand the layout of a street network in an urban environment. It is about the legibility, clarity, and comprehensibility of streets and their connectivity, which have a significant impact on people's ability to orient themselves, navigate efficiently, and develop a sense of place within a city (Pindor, Skorupka & Szczpanska, 2011). It measures the extent to which the local properties of the urban circulation configuration are indicative of its global properties. In other words, it is the degree of correlation between local measures (connectivity) and global ones (integration) (Yamu, van Nes, & Garau, 2021).
6. Synergy: is the correlation between global integration (radius n) and local integration radius 3, which provides insights into the overall spatial coherence and efficiency of movement within a given environment (Wang & Fu, 2017).

2. Methodology

2.1. Study Area

The research was conducted in planned and unplanned settlements of Kisumu City, Kenya. The settlements were chosen based on their location and the type of streets, which were divided into regular and irregular streets. Migosi Estate and Arina Estates are typical settlements with regular street structures, while Nyalenda and Manyatta have irregular street structures. Figure 2 shows the location of study areas in Kisumu City.
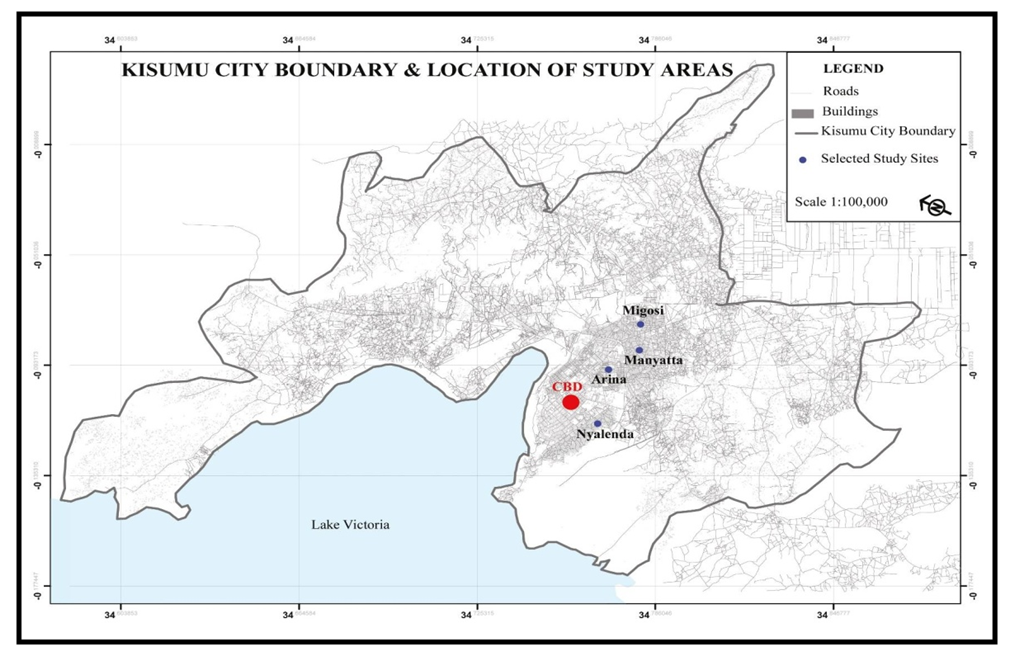
Figure 2. Location of Study Areas in Kisumu City, Kenya

2.2. Target Population

Asiamah, Mensah and Oteng-Abayie (2017) define the target population as a population whose results are generalized. It is also the total collection of all elements in any field of study (Kothari, 2013). The target group of this study are retail shops and streets in the settlements of Migosi, Arina, Manyatta and Nyalenda. At the time this study was conducted, no documented statistics on retail shops with their respective location characteristics were available in any of the selected study areas. Therefore, the study conducted an inventory survey in each study area to determine the number of retail shops and their locations. The term inventory refers to mapping and is often used for data collection (Rew, Radosevich & Pokorny, 2006). As part of the survey, a total of 1,434 retail shops were recorded using the Global Positioning System (GPS) and thus represent the overall target group of this study.

2.3. Methods of Data Collection and Analysis

The study used an inventory method of data collection that used geolocation technologies to determine the geographic location of retail shops and streets. The use of these technologies saves time and guarantees the accuracy of the data collected. Hence, GPS was used to locate spatial data. GPS technology provides reliable location information to help users make decisions (Abulude, Akinnusotu & Adeyemi, 2015). A GPS sends signals from space via satellites and provides a three-dimensional location (latitude, longitude, and altitude). High-resolution satellite imagery for each settlement was retrieved from Google Earth Pro using Universal Maps Downloader software and then displayed in ArcGIS 10.6.1. Finally, before analysis, the satellite images were overlaid with retail stops and street data to confirm their accuracy or variance.
Consequently, the data was analysed first by using the Kernel Density Analytic Estimation to establish retail density at the selected study sites. According to Batty, Strobl, Lin, Zhu, and Chen (2018), this method reveals spatial patterns and density by interacting with GPS data to transform, manipulate, and generate meaningful information. This was done using spatial analysis software (ArcGIS 10.6.1) that provides the ability to visualize and quantify spatiotemporal point data based on event frequency and intensity in the neighbourhood of a given point (Evangelista & Beskow, 2018).
Secondly, axial line analysis was conducted to quantify the configuration, patterns, and metric properties of street networks. The axial maps of all study areas were calculated and the total number of axials was determined using Depthmapx software. According to Hillier and Vaughan (2007), Depthmapx is a widely used street configuration analysis software tool. It provides researchers with a set of functionalities for Analysing and visualizing spatial networks. This includes the ability to import and process urban spatial data, create visibility charts, calculate various network metrics, and visualize the results (Turner & Penn, 2002). The maps represent streets as a metric network, considering each street as a metric link and each intersection as a node (Pinelo & Turner, 2010). Therefore, each settlement was represented by its respective metric properties. To visualize the street metrics of each settlement in a global context (Rn), the study areas were represented by a series of axial lines, each representing the axial spaces with their respective indices of integration, mean depth, choice, control, and connectivity. The metric properties of each settlement were calculated in two different ways: first, the study area in its global context (Rn); and second, the study area in the local context (R3). The interpretation of the spatial structure of a settlement is largely based on the results of axial analyses showing how metric values are distributed in this system and how they relate to each other (Pinelo & Turner, 2010). Finally, to determine the intelligibility and synergy of settlements, the relationships between connectivity and global integration (Rn) and local integration (R3) and global integration (Rn) were examined. This provided the basis for a systematic comparison of their relationships with retail density.
Finally, regression analysis R2 was calculated to check the correlation between study variables. In the Depthmapx software, this analysis was done using scatterplots that helped identify the nature of the relationship between two quantitative variables. For example, correlations between global and local integration scores relate to the concept of synergy of an urban system, while correlations between connectivity and global integration relate to intelligibility.

3. Results and Discussions

3.1. Retail Shop Density

Using a Spatial Kernel Density Analytic Estimation, the retail density in each of the settlements was determined, as shown in Figure 3. According to the analysis, the spatial distribution of retail shops and the cluster density varies from high to low in the study areas. The results showed that most shops are located at major street intersections. Low clusters can be seen on small streets connecting residential areas. As a result, the number of retail outlets increases from local streets to large intersections of important roads in each settlement.
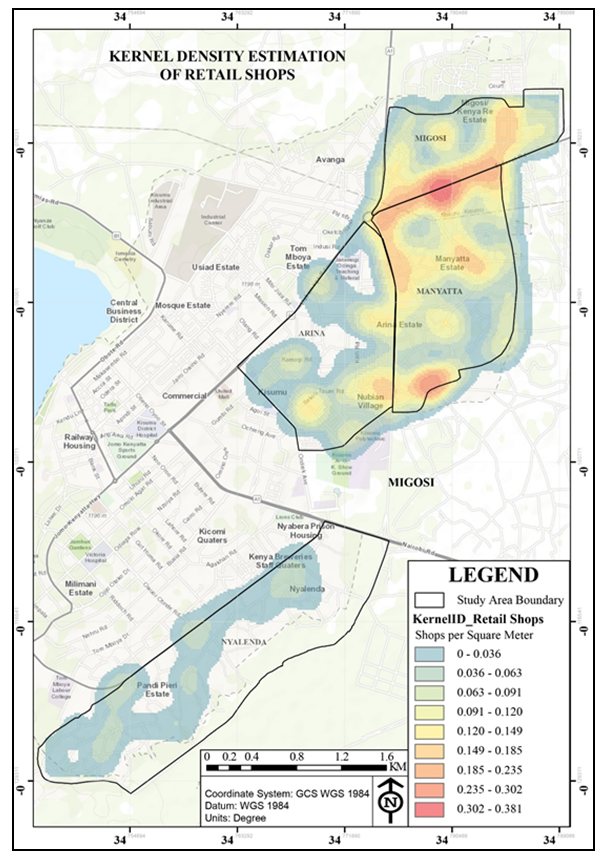
Figure 3. Kernel Density Estimation of Retail Shops
This is because street intersections provide retail shops with increased visibility and accessibility by customers. According to a study by Fancher and Fancher (2010), visibility plays a crucial role in consumer decision-making, and retail shops at intersections tend to benefit from greater exposure. In addition, main street intersections tend to have higher pedestrian traffic as people converge from different directions. This increased foot traffic presents a larger pool of potential customers for retail shops. Research by Keh, Lee, and Park (2006) found that retail establishments at street junctions had significantly higher pedestrian traffic than those on middle blocks.
Moreover, the study results revealed that most of the retail shops sprout up along streets, which serve as structuring elements for the resulting linear commercial zones. This provides convenient access for customers who are already in the vicinity or are passing through. A study by Ibrahim, Baharum and Radzi (2012) found that convenience shops located along streets were perceived by customers as more convenient. In addition, the presence of numerous retail outlets along the streets leads to a concentration of commercial activity. This clustering effect can attract customers who prefer to visit multiple shops at once or make comparison purchases. According to research by Jansson, Backstrom and Karlsson (2012), the co-location of complementary businesses can create a positive synergy that leads to more customer visits and sales for all businesses involved.
In addition, the research results presented in Figure 3 showed differences in retail shop density across the four settlements. Initial examination of the map provided insights into how the street affected the distribution of retail shops in the study areas. The street networks of the settlements of Arina and Migosi were approximately symmetrical, while Nyalenda and Manyatta were asymmetrical. Major clusters of retail density were established in Manyatta and Migosi neighbourhoods with the highest estimated density (0.302 - 0.381 shops per square meter) being centrally within their shared boundary along Kondele – Car Wash Road. Relatively, Manyatta and Migosi recorded a higher number of retail counts compared to Arina and Nyalenda.
In particular, Manyatta and Migosi share common spatial attributes defined by their boundaries and Kondele – Car Wash Road, resulting in higher retail density. According to Birkin, Clarke and Clarke (2002) neighbouring settlements often have a similar market catchment consisting of the population and potential customers within a given distance or travel time. This similarity in the market catchment area results in comparable retail density as the shops serve the same customer base. In addition, the settlements are about 4.5 km from the CBD. Therefore, shops offer convenient retail services at a reasonable distance rather than commuting to the central business district, which often involves transportation costs.
Relatively low concentrations in the settlements of Nyalenda and Arina are due to the presence of shopping complexes in their vicinity and proximity to the central business district. For example, Nyalenda is adjacent to the Quick Mart Supermarket and about 1.8 km from the CBD. Arina, on the other hand, is 2 km from the CBD and has United Shopping Mall and Naivas supermarket nearby. Consequently, housing developments within walking distance of a central business district attract little retail density as they are often associated with high property costs and competition for space (Caragliu, Del-Bo & Nijkamp, 2011). The CBD offers a variety of shopping opportunities, including bulk and one-stop shopping, compared to far-flung settlements (Ross, 2011).
Table 1. Retail Shop in Arina, Manyatta, Migosi and Nyalenda
     
The results showed that the retail density of the four neighbourhoods was about 50% in Manyatta, 24.4% in Migosi, 16.6% in Arina and 8.9% in Nyalenda, as summarised in Table 1. First of all, the distribution Map in Figure 3 shows that most retail shops are located in easily accessible areas. In addition, the distribution of retail shops by percentages shows that the informal settlement of Manyatta, located 4.5 km from the CBD, has a higher number of retail shops than Nyalenda, located 1.8 km from the CBD. These informal settlements are characterised primarily by low-income earners whose ability to shop in high-end shopping malls is limited. Previous studies found that the average monthly income for Manyatta and Nyalenda was Ksh. 11,831 and Ksh. 6,405 respectively (Smith, 2017).
In contrast, there were comparatively fewer retail outlets in Migosi and Arina (24.4% and 16.6% respectively). Overall, formal settlements accounted for 41% of the total number of retail shops recorded, while informal settlements accounted for 59%. The average monthly income of Migosi and Arina was estimated at Ksh. 17,950 and Ksh. 16,750, respectively (Wagah, Onyango & Kibwage, 2010). In this case, formal settlements with higher income levels attracted most of the retail business.
Thus, the higher the average income level of a settlement, the higher the number of retail shops. Higher average income typically indicates increased purchasing power of the residents. This, in turn, leads to higher demand for a variety of goods and services. According to Maraschin and Krafta (2013), retailers are more likely to establish shops in areas where there is a potential customer base with sufficient purchasing power.

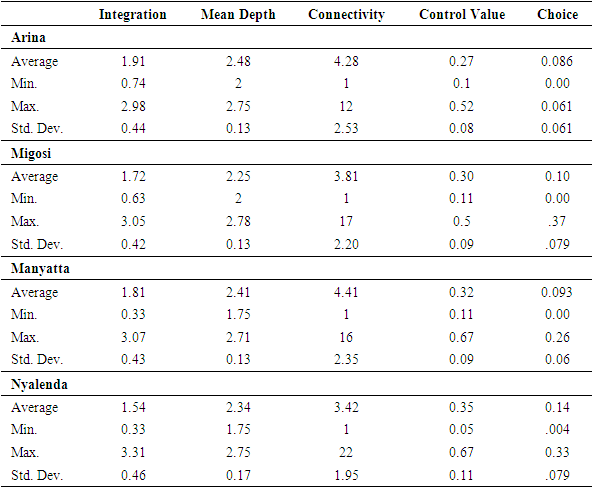
3.2. Street Metric Properties

The street networks of all study areas were analysed with the Depthmapx software and represented as axial line maps. The values of the spatial attributes of all streets in each neighbourhood were averaged to examine the differences between the street metric properties of the four neighbourhoods as a whole. The results in Table 2 showed differences in integration (Arina = 1.91, Migosi = 1.72) and control (Arina = 0.27, Migosi = 0.30). This finding suggests that Arina is more accessible than Migosi but offers slightly less visual control over the spatial network.
Table 2. Average Street Metrics for the Settlements
     
Conversely, the informal settlement of Manyatta has better integration (1.81) and lower control values (0.32) than Nyalenda (integration =1.54, control = 0.35). This means that compared to the informal settlement of Nyalenda, Manyatta is more accessible but offers less visual control over the spatial network. Whereas the results of Jiang, Claramunt and Klarqvist (2002) established that settlements with high control indices are associated with axial lines showing high integration scores, this study suggests otherwise. However, the mean control differences in the settlements are not enormous.
Compared to the planned neighbourhoods, informal settlements had comparatively better control indices, suggesting that they are frequently traversed and act as important channels of movement. Research by Cutini, Pinto, Rinaldi, and Rossini (2019) argued that informal settlements may have high indices of control in some cases, due to their dense and interconnected spatial layouts. These settlements often develop organically, with narrow pathways and intricate street patterns that encourage pedestrian movement and create efficient shortcuts. The lack of formal planning in informal settlements can result in a more complex and interconnected network, that can facilitate movement and contribute to higher indices of control.
Additionally, the results show that all neighbourhoods have relatively high standard deviations in connectivity metrics. For instance, Arina had a coefficient deviation from the mean of 59.1% (SD = 2.53; mean = 4.28), Migosi 57.7% (SD = 2.20; mean = 3.81), Manyatta 53.3% (SD = 2.35; mean = 4.41), and Nyalenda 57% (SD = 1.95; mean = 3.42). The mean depth varies by 5.2% (Arina), 5.8% (Migosi), 5.4% (Manyatta) and 7.3% (Nyalenda). In addition, deviations in the mean of 23.03%, 24.42%, 23.76%, and 29.87% are found in the integration metrics, respectively. This shows that the streets of the settlements are less segregated and more integrated as shown in Table 2.
The results show the variations in the street metric qualities between Arina, Migosi, Manyatta, and Nyalenda. The highest integration values in the Arina are found at the central roads, but in Migosi, they are found at the site border next to Manyatta, based on a visual examination of the axial maps. Likewise, the boundary of Manyatta is where the integration values are highest, while in Nyalenda the values are evenly distributed throughout the settlement.

3.3. Street Metric Properties and Retail Shop Density

The study sought to establish the relationship between street metric properties and retail shop density. Therefore, the study examined the number of axial lines from each settlement that attracted the location of retail shops. The Study results yielded a total of 1027 axial lines from all study areas as shown in Table 3. Out of 1027 axial lines, only 25.6%, that is 263 axial lines, attracted the location of retail shops. The informal settlements of Manyatta and Nyalenda had the highest number of axial lines at 320 and 329, respectively. This indicated a high degree of irregularity in urban structure (straightness). Migosi had fewer axial lines (165) than Arina, where there were 213. Therefore, compared to the other settlements, Migosi has better straightness of the streets.
Table 3. Axial Lines and the Distribution of Retail Shops
     
The results support Hillier and Hanson's (1984) claim that informal settlements are often spontaneous and develop through incremental growth and self-organization, resulting in a more organic layout compared to planned settlements. This organic growth allows for a higher degree of connectivity and a greater number of axial lines within the settlement. Furthermore, Ghonimi (2021) reinforced this argument by pointing out that the relationship between spatial configuration and social interactions within informal settlements tends to exhibit more complex and interconnected layouts, due to the spontaneous nature of their development, resulting in a higher number of axial lines compared to planned settlements.
In terms of the ability to attract retail shops, the proportional change in the total number of axials versus the total number that attracted retail shop locations was calculated. The results showed that out of 165 axial lines only 68 representing a percentage change of 41.2%, attracted retail shops in Migosi. Axial lines in Arina recorded a percentage change of 20.1% out of a total of 213. On the other hand, out of a total of 320 axial lines in Manyatta, only 103, representing a percentage change of 32.2%, attracted retail shops. Nyalenda had 329 axial lines, of which only 45 attracted retail shops’ locations, with a percentage change of 13.7%. Therefore, further statistical analysis focused only on axial lines denoting the location of retail shops in each of the selected settlements.
The variations in retail location can be a result of the axial line’s connectivity and ability to attract pedestrian movements. A study by Jabbari, Fonseca, and Ramos (2021) found that streets with high foot traffic and good accessibility from adjacent areas are more desirable for retail establishments. Axial lines with poor pedestrian access or limited foot traffic may not provide retail businesses with the customer base they desire. Additionally, retail shops often seek locations with good visibility and exposure to attract potential customers. Axial lines that are not visible due to physical barriers, obstructions, or poor urban design may be less attractive to retailers. A study by Kim, Kim, and Kim (2018) highlighted that retail shops on more visible and prominent streets tend to have higher sales performance. Therefore, axial lines with limited visibility may not attract retail businesses.

3.4. Normality Test

The Shapiro-Wilk test was used to determine whether the distribution of the variables (Retail Shops, Integration, Control, Connectivity, Mean Depth, and Choice) was normally distributed before performing the statistical test. This step was necessary to facilitate the selection of the appropriate correlation coefficient that best describes the relationships between the variables in the dataset. It is noteworthy that not all streets within the selected study areas contained retail shops. Hence, the syntactic analysis was based on streets attracting the location of retail shops. Notably, the informal settlements had fewer than fifty streets that attracted retail shops.
In this case, Bland (2015) recommends using the Shapiro-Wilk normality test. The test results presented in Table 4 indicate that the variable distributions are normally distributed. In one such case, Field (2013) recommended using the parametric Pearson correlation coefficient to assess the relationships between the variables in the four neighbourhoods.
Table 4. Normality Test of Street Metric Properties and Retail Shops
     

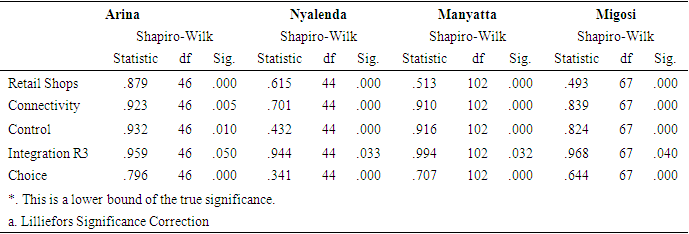
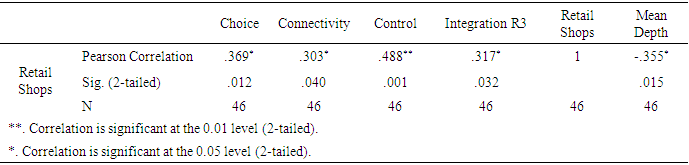
3.5. Correlation Coefficients for Street Metric Properties and Retail Shops

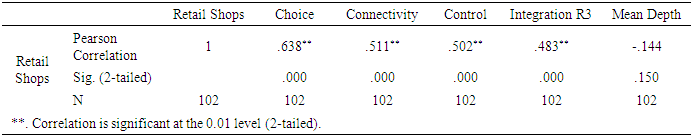
A) Arina Settlement: The settlement has a symmetrical shape of street networks which are patterns of organised development. The results of the relationship between retail shops and choice were (r=.369, p= .012); retail shops and connectivity (r=.303, p=.040); retail shops and control (r=.488, p=.001); and retail shops and integration R3 (r=.317, p=.032) as shown in Table 5. The results revealed a significant and moderate positive relationship between retail shops, choice, connectivity, control and integration R3. However, there was a moderately significant negative association with mean depth (r=-.355, p=.015). Results suggest that street control best-predicted retail shop density in the settlement compared to connectivity, choice, integration R3, and mean depth.
Table 5. Street Metric Properties and Retail Shop Density in Arina
     
A significant positive relationship means that there is a clear statistical relationship between the variables examined. In this case, this suggests that as the settlement increases in choice, connectivity, control and integration, retail density also increases. In addition, the results suggest that retail density increases as mean depth decreases. Furthermore, the strength of these relationships is neither too weak nor too strong. This suggests that the variables are correlated to a reasonable extent, but not to the extent that one variable can be used to accurately predict the other.
The results in Figure 4 show the axial lines, street metrics and retail shops in Arina. Because the settlement is located 2 km from the CBD which has multiple shopping destinations, street metric properties were modest in predicting retail shop density. This is because most of the pedestrian traffic passes by as it commutes further from the city to various residential neighbourhoods on the outskirts. Therefore, streets with stronger control values would attract retail shop locations better than other metric properties.
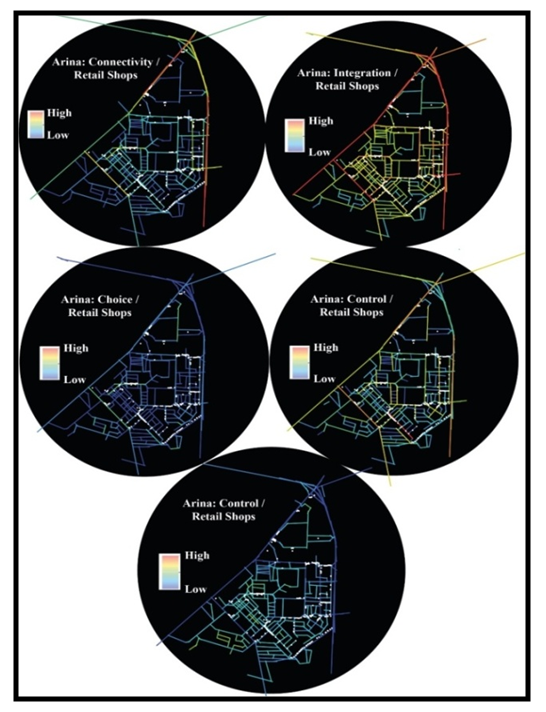
Figure 4. Street Metric Properties and Retail Shop Density in Arina
There weren't that many shops on the inner streets of the settlement; Therefore, the integration was not so significant in predicting retail density. The results are consistent with those of Ozuduru and Guldmann (2013), who indicated that neighbourhoods within walking distance of a central business district or an established shopping area nearby attract less local retail activity. This is because buyers have better alternative trading areas available for bulk buying than the on-site options offered.
B) Migosi Settlement: The settlement is characterised by regular street patterns. The results for retail shops and connectivity were (r=.803, p=.000); retail shops and choice (r=.791, p=.000); retail shops and control (r=.761, p=.000); and retail shops and integration R3 (r=.600, p=.000), as shown in Table 6. The results showed that there is a significant and strong positive association between connectivity, choice, control, integration R3 and retail shops. However, there was a moderately significant negative association with mean depth (r=-.362, p=.003). These results suggest that street connectivity has the greatest impact on retail shop density compared to control, choice, integration R3, and mean depth. A significant positive correlation means that as the settlement increases in choice, connectivity, control and integration, retail density also increases accordingly. In addition, the results suggest that retail shop density increases as mean depth decreases. Moreover, the strength of relationships between retail shops, choice, connectivity, control and integration is strong. This suggests that the variables are correlated and can be used to accurately predict retail shop density. However, the association between mean depth and retail shops is moderate, meaning that the variables are reasonably correlated, but not to the extent that one variable can be used to accurately predict the other.
Table 6. Street Metric Properties and Retail Shop Density in Migosi
     
The results in Figure 5 show the street metric properties and retail shops in Migosi. Because the neighbourhood is 4.5km from the CBD, findings of its metric properties differed from those of Arina. Within the settlement, local metric properties (connectivity and choice) performed best. The control metric equally affected retail density as the settlement connected other neighbouring settlements. The ability of the streets to accommodate ‘to movements’, (integration R3) determined the retail density since there were a large number of shops in the inner streets of the settlement. According to Bibri, Krogstie and Kärrholm (2020), neighbourhoods on the outskirts of a city tend to be compact and self-sufficient, with shopping areas serving local commercial needs. This reduces the travel distance in search of goods and services. Furthermore, the results are consistent with those of Alaloucha, Al-Hajria, Naserb, and Hinaia (2019) who found that connectivity and choice are the best predictors of retail shop density in settlements with regular street networks.
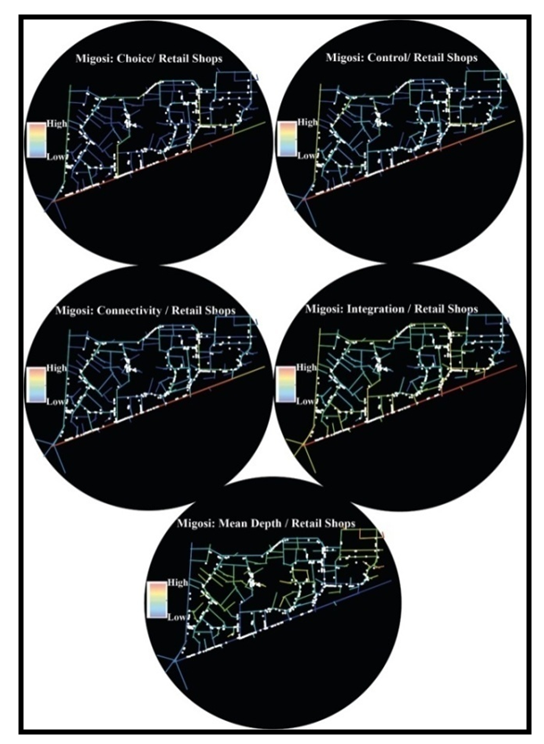
Figure 5. Street Metric Properties and Retail Shop Density in Migosi
C) Manyatta Informal Settlement
The settlement has an asymmetrical street network layout. The results of Manyatta informal settlement on the relationship between retail shops and choice were (r=.638, p=.000); retail shops and connectivity (r=.511, p = .000); retail shops and control (r=.502, p=.000); retail shops and integration R3 (r=.483, p=.000) as shown in Table 7. The correlation coefficient (r) of 0.638 between retail shops and choice suggests a moderately strong positive association.
Table 7. Street Metric Properties and Retail Shop Density in Manyatta
     
Retail shops and connectivity yielded a correlation coefficient (r) of 0.511 indicating a moderately positive association between retail shops and connectivity. The results from retail shops and control showed a correlation coefficient (r) of 0.502, suggesting a moderately positive relationship between retail shops and the control. The correlation coefficient (r) of 0.483 indicates a moderately positive relationship between retail shops and integration. In each case, the p-values were 0.000 indicating that the relationship was statistically significant. Thus, one unit increase in choice, connectivity, control and integration would increase retail shop density in the informal settlement of Manyatta.
However, for the relationship between retail shops and mean depth, the correlation coefficient (r) of -0.144 indicates a weakly negative relationship between the two variables. The p-value of 0.150 indicates that this relationship is not statistically significant at the conventional significance level of 0.05. In this case, the weak negative relationship and lack of statistical significance suggest that there is no clear or meaningful relationship between retail shops and mean depth. This implies that changes in mean depth are not reliably associated with changes in retail shop density. Relatively, choice best influences retail density compared to connectivity, control and integration. The results in Figure 6 show the axial lines of the settlement, street metrics and retail shops.
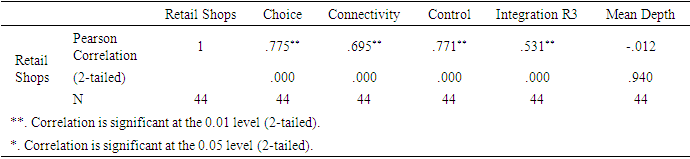
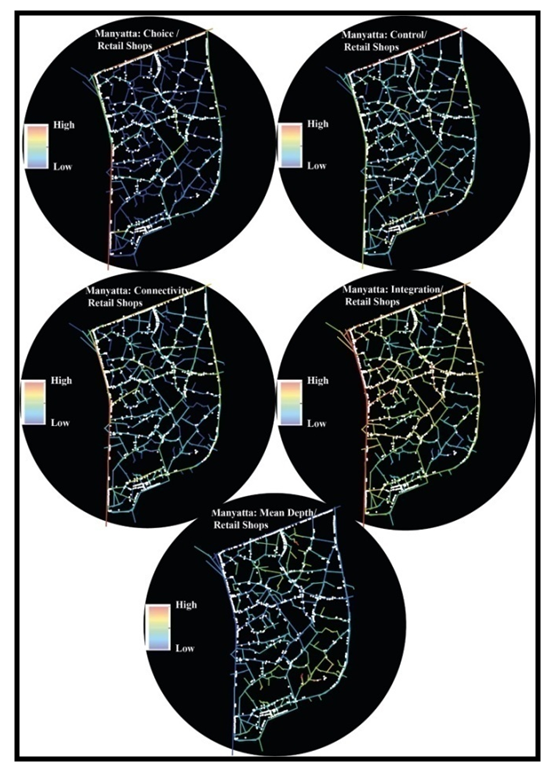
Figure 6. Street Metric Properties and Retail Shop Density in Manyatta
The results are consistent with the findings of Samburu, Hayombe and Owino (2019) who found that choice was the best predictor of retail density in the informal settlements. Furthermore, it is consistent with the statements of Porta, Strano, Lacoviello and Messora (2008) who found that retail shops and service enterprises tend to be concentrated in areas with better street choices and less well with integration. However, the results differ from those of Mohamed, Van Nes, and Salheen (2015) who found that spatial integration predicted the location of commercial land uses better than other measures of street centrality in three informal settlements in Cairo.
D) Nyalenda Informal Settlement
The results for Nyalenda on the association between retail shops and choice were (r=.775, p=.000); retail shops and control (r=.771, p=.000); retail shops and connectivity (r=.695, p=.000) retail shops and integration R3 (r=.531, p=.000), and retail shops and mean depth (r=-.012, p=.940) as shown in Table 8. The correlation coefficient (r) between retail shops and choice is 0.775. This indicates a strong positive relationship between the two variables. Likewise, the correlation coefficient (r) between retail shops and control is 0.771. indicating a strong positive relationship.
Table 8. Street Metric Properties and Retail Shop Density in Nyalenda
     
Retail shops and connectivity showed a correlation coefficient (r) of 0.695. This indicates a moderately strong positive association. Furthermore, the correlation coefficient (r) between retail shops and integration R3 is 0.531. This indicates a moderately positive association. The p-value (p) of 0.000 indicates statistical significance. Therefore, a unit increase in choice, control, connectivity, and integration would result in an increase in retail density in Nyalenda. However, A weak, non-significant and non-conclusive relationship ensued with mean depth (r = -.012, p =.940). With a p-value of 0.940, it suggests that the correlation between mean depth and retail shops is not statistically significant. The correlation coefficient of -0.012 also indicates a very weak and negligible relationship between the two variables.
Nyalenda's findings are consistent with Manyatta's, suggesting that choice has a greater impact on retail shop density than control, connectivity and integration. Figure 7 shows the street metrics and retail shops in Nyalenda.
Figure 7. Street Metric Properties and Retail Shop Density in Nyalenda

3.6. Test of Hypothesis on Street Metric Properties and Retail Shops

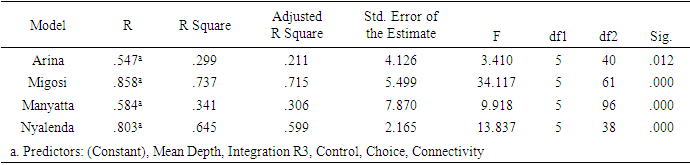
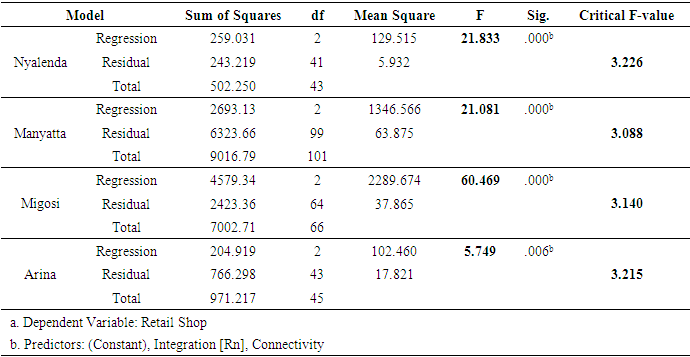
The study hypothesis stated that there is no significant relationship between street metric properties and retail shop density.
This was tested by performing a linear regression analysis of street metric properties and retail shop density in each of the selected study areas. The sample size of the dependent variable (1,434 retail shops) was well above the minimum sample size suggested by Kothari (2013) for a large effect involving more than one predictor. To test the null hypothesis, F-values were calculated for each of the study areas (Arina: F=3.41, p=0.012; Migosi: F=34.13, p=0.000; Manyatta: F=9.918, p=0.000; and Nyalenda: F =13.837, p =0.000) as shown in Table 9. The F-calculated values were compared to the F-critical values at a significance level of 0.005. The F-critical values were 2.4495, 2.3657, 2.3092, and 2.4625 for Arina, Migosi, Manyatta, and Nyalenda.
Table 9. Regression Model for Street Metric Properties and Retail Density
     
In each case, the F-calculated values were above the F-critical values, and the p-values were below 0.05, an indication that the model was appropriate and statistically significant in all settlements. These results suggest that there is a statistically significant association between street metric properties and retail shop density. Thus, the null hypothesis was rejected. Thus, street metric properties can explain the variability of retail shop density in Arina, Migosi, Manyatta and Nyalenda by 29.9%, 73.7%, 34.1% and 64.5% respectively.
The results are consistent with the findings of Porta, Strano, Lacoviello, and Messora (2008) who established street metric properties that were statistically significant in predicting the location of economic enterprises in the city of Bologna. Furthermore, they are consistent with those of Kim and Jun (2015) who found that street metric properties, such as integration, depth, and choice, had a statistically significant impact on retail shop location choices. These results suggest that street metric properties can help predict retail shop density in cities. However, the results contradicted those of Dijkstra and Poelman (2019) who found that street metric properties were not statistically significant for predicting retail shop density in Lisbon, Portugal.

3.7. Settlement Synergy and Retail Shop Density

To explore the degree of synergy between the four neighbourhoods, a scatter plot between local integration (R3) and global integration (Rn) was examined separately for each neighbourhood. Figure 8 shows that there is a stronger relationship between global integration (Rn) and local integration (R3) in Manyatta compared to Nyalenda, Migosi, and Arina. In Manyatta, the R2 value was 0.6777, indicating that about 67.77% of the variance in local integration (R3) can be explained by global integration (Rn). The results suggest that Manyatta has better synergy compared to Nyalenda, Migosi, and Arina.
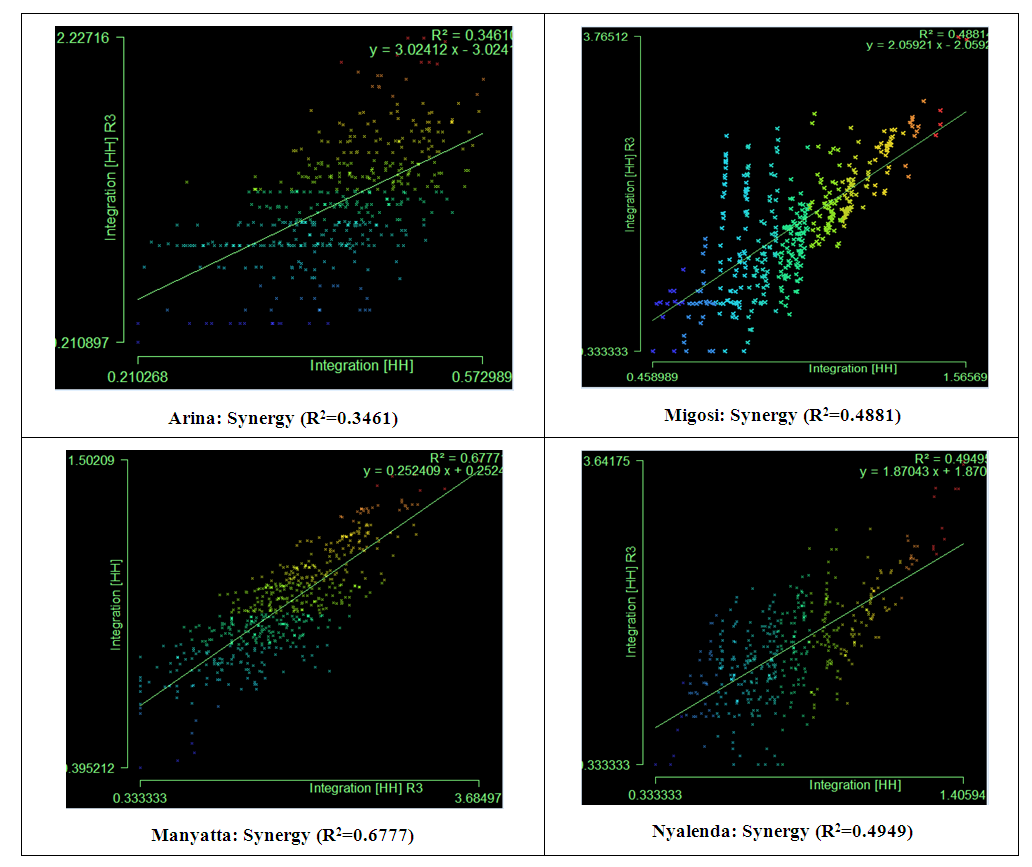
Figure 8. Synergy Scatter Plots
In contrast, Nyalenda had an R2 value of 0.4949, indicating that about 49.49% of the variance in local integration (R3) can be explained by global integration (Rn). Similarly, Migosi had an R2 value of 0.4881 (48.81% variance), and Arina had an R2 value of 0.3461 (34.61%). Relatively, informal settlements (Manyatta & Nyalenda) had better synergy compared to the planned settlements (Arina & Migosi). This refutes the findings of Hillier (2007), who found that formal settlements showed a reasonable correlation between global integration and local (radius 3) integration’ implying a ‘good interface’ between global and local movement. Likewise, neighbourhoods within a reasonably accessible distance from the CBD (Manyatta & Migosi) showed relatively better synergy values.
According to Dalton (2003), synergy is a trait that best reflects the vitality and stability of urban functions and residents in neighbourhoods. Furthermore, Hillier (2007) pointed out that synergy represents the overall spatial coherence, movement efficiency, and heterogeneity of residents within a given environment. This justifies why the informal settlement of Manyatta had the highest retail shop density compared to the other settlements. According to Devas and Rakodi (2013), informal settlements are vibrant, self-organizing spaces, that offer livelihood options for a range of income groups. Therefore, they are characterized by a diverse mix of inhabitants in terms of socioeconomic backgrounds, occupations, and cultural backgrounds. This heterogeneity contributes to the overall vitality and dynamism of the settlement. The flexibility and affordability of informal settlements often attract people from various income levels seeking affordable housing options or economic opportunities.

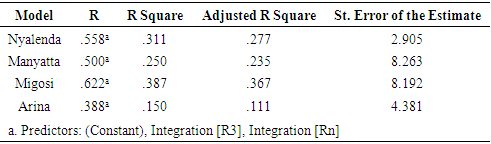
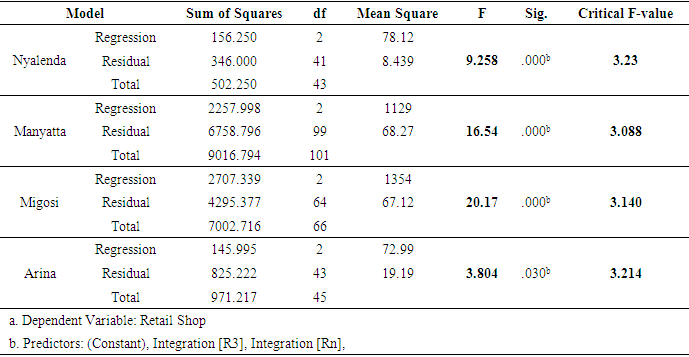
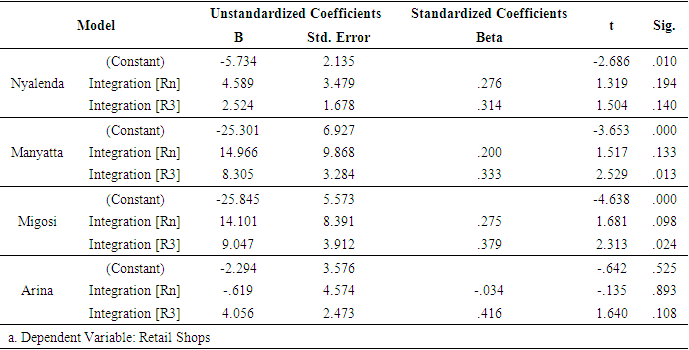
3.8. Test of Hypothesis on Synergy and Retail Shops

The research sought to establish the relationship between synergy (local integration R3 and global integration Rn) and retail shop density. According to Kaushik (2016), synergy refers to the relationship between local integration (R3) and global integration (Rn), indicating the relationship between parts of the spatial system to the overall system. Furthermore, Dalton (2010) and Hillier (2007) pointed out that synergies reflect the vitality and stability of urban functions and residents in neighbourhoods.
a. Regression Summary Model
The results for synergy and retail shop density in Nyalenda were (R2=0.311); Manyatta (R2=0.250); Migosi (R2=.387); and Arina (R2=0.150) as shown in Table 10.
Table 10. Regression Summary Model for Synergy and Retail Shops
     
The results indicate that 31.1%, 25%, 38.7% and 15% of the variation in retail shop density in Nyalenda, Manyatta, Migosi and Arina respectively can be explained by synergy predictors (local integration R3 and global integration Rn). In addition, across all study areas, the results indicate a relatively weak association between synergy and retail density, suggesting that other factors or variables not included in the model may have a greater impact (Field, 2013).
b. Regression Analysis of Variance for Synergy and Retail Shops
The results of the F-calculated value from the regression analysis of variance were as follows: Nyalenda, F=9.258, p=0.000; Manyatta, F=16.54, p=0.000; Migosi, F=20.17, p=0.000; and Arina, F=3.804, p=0.30, as shown in Table 11.
Table 11. Regression Analysis of Variance for Synergy and Retail Shops
     
The study results for Nyalenda showed an F-calculated value of 9.258, which was statistically significant with a p-value of 0.000. In Manyatta, the F-calculated value of 16.54 was statistically significant with a p-value of 0.000. Migosi was also statistically significant with an F-calculated value of 20.17 and a p-value of 0.000. This suggests that there is a significant association between the variables in Nyalenda, Manyatta and Migosi and that synergy explains a significant amount of the variation in retail shop density. Therefore, the null hypothesis that there is no significant relationship between synergy and retail shop density is rejected. This indicates that there is a significant correlation between synergy and retail shop density in Nyalenda, Manyatta and Migosi.
However, Arina reported an F-calculated value of 3.804 and a p-value of 0.30. This suggests that the relationship between synergy and retail shop density was not statistically significant at a conventional significance level of 0.05. As such, the independent variables may not explain a significant amount of the variation in retail shop density in Arina. Therefore, the null hypothesis that there is no significant relationship between synergy and retail shop density is accepted.
The results are consistent with the arguments of Dalton (2010) who found that a settlement showing no variation in global and local integration (synergy) would have no measurable degree of influence on retail density. As previously reported in Figure 9, Arina had an R2 value of 0.3461 (34.61%) which was relatively lower than Manyatta (R2=0.6777), Nyalenda (R2=0.4949) and Migosi (R2=0.4881). This, therefore, explains the finding that synergy was statistically significant in predicting retail shop density in Manyatta, Nyalenda and Migosi but not for Arina.
Figure 9. Intelligibility Scatter Plots
c. Regression Coefficients for Synergy and Retail Shops
To examine the nature of the relationship between global integration, local integration and retail shop density, the regression coefficients of each settlement were calculated. The results for the global integration Rn in Nyalenda were (B=4.589, p=.194), Manyatta (B=14.966, p=.133), Migosi (B=14.101, p=.098), and Arina (B=-.619, p=.893). In addition, the results for local integration R3 in Nyalenda were (B=2.524, p=.140), Manyatta (B=8.305, p=.013), Migosi (B=9.047, p=.024), and Arina (B=4.056, p=.108) as shown in Table 12.
Table 12. Regression Coefficients for Synergy and Retail Shops
     
The results for the local integration R3 in Manyatta with a coefficient of 8.305, show that, on average, a one-unit increase in local integration R3 would increase retail shop density by 8.305 units. The p-value of 0.013 suggests that this association is statistically significant at a significance level of 0.05, indicating that it is unlikely that it occurred by chance. Nyalenda, on the other hand, had a coefficient of 2.524, suggesting that, on average, a one-unit increase in local integration R3 would increase retail shop density by 2.524 units. However, the p-value of 0.140 suggests that this association is not statistically significant at the 0.05 level of significance. In other words, there is insufficient evidence to conclude that the association between local integration and retail shop density in Nyalenda is statistically significant.
The coefficient for Migosi was 9.047, which means that, on average, a one-unit increase in local integration R3 would result in an increase in retail shop density by 9.047 units. The p-value of 0.024 suggests that this association is statistically significant at the 0.05 significance level. Furthermore, the coefficient for Arina was 4.056, which means that, on average, a one-unit increase in local integration R3 would increase retail shop density by 4.056 units. Similar to Nyalenda, the p-value of 0.108 suggests that the association is not statistically significant at the 0.05 significance level.
Global integration Rn and retail shops in Nyalenda recorded a regression coefficient of 4.589 and the associated p-value was 0.194. The coefficient of 4.589 indicates that there is a positive correlation between global integration Rn and retail shop density in Nyalenda. However, because the p-value is above the typical significance level of 0.05, the result is not statistically significant. Therefore, the relationship between global integration and retail shop density in Nyalenda is not statistically significant.
In contrast, Manyatta had a regression coefficient (B) for global integration Rn of 14.966 and a p-value of 0.133. The coefficient of 14.966 indicates a positive relationship between global integration Rn and retail shop density in Manyatta. However, similar to Nyalenda, the p-value is greater than 0.05, indicating that the result is not statistically significant. Therefore, it cannot be concluded that the relationship between global integration Rn and retail shop density in Manyatta is statistically significant.
The study results in Migosi had a regression coefficient (B) for the global integration Rn of 14.101 and the associated p-value was 0.098. The coefficient of 14.101 indicates a positive correlation between global integration Rn and retail shop density in Migosi. The p-value of 0.098 is slightly above the significance level of 0.05. Therefore, the relationship between the global integration Rn and retail shop density in Migosi is not statistically significant.
Finally, the results for Arina had a regression coefficient (B) for the global integration Rn of -0.619, and the associated p-value of 0.893. The negative coefficient of -0.619 indicates a negative relationship between global integration Rn and retail shop density in Arina. However, the high p-value of 0.893 indicates that the result is not statistically significant. Therefore, it cannot be concluded that the relationship between the global integration Rn and retail shop density in Arina is statistically significant.
In summary, while positive relationships are observed between global integration Rn and retail shop density in Nyalenda, Manyatta and Migosi, the statistical significance is not strong enough to draw firm conclusions. Furthermore, the negative association observed in Arina is not statistically significant. Research by Turner and Penn (2002) has pointed out that global integration Rn refers to the connectivity and accessibility between different parts of a city or region. It primarily looks at the entire region on a global scale. Hence, it is associated with facilitating vehicular or long-distance movement as it focuses on connecting different areas and enabling efficient travel over longer distances. This explains why global integration was not significant in determining retail shop density, which is often influenced by pedestrian movements.
On the other hand, there were positive relationships between local integration R3 and retail shop density in Manyatta, Migosi, Nyalenda and Arina. While the results in Manyatta and Migosi were statistically significant, the results in Nyalenda and Arina were inconclusive. Therefore, when examining the association between synergy and retail shop density, it can be concluded that local integration R3 was significant only in Manyatta and Migosi, while global integration Rn was not significant at all.
Research using space syntax has highlighted the importance of local integration in promoting pedestrian movements. Local integration refers to connectivity and accessibility within a localized area. The focus is on the configuration of streets, paths, and walkways to support pedestrian-friendly environments. Studies have shown that a well-connected street network with high local integration R3 encourages pedestrian movement by shortening travel distances, providing direct routes, and creating pedestrian-friendly urban environments (Hillier, 2007).
Furthermore, a study by Bafna and Sheppard (2012) found that in decentralized settlements, where the CBD has less influence, local integration becomes a crucial factor in shaping retail shop density. Higher local integration leads to more pedestrian movement and greater visibility, making locations more attractive to retailers. Consistent with this claim, Louf and Barthelemy (2014) modelled the polycentric transition of cities using space syntax analysis to study the evolution of urban structures. They found that in settlements where the CBD losing its dominant role, local integration emerges as a key indicator of retail shop density. Therefore, these results explain that while examining synergy, local integration was not statistically significant in determining retail shop density in Arina and Nyalenda which are located closer to the CBD compared to Manyatta and Migosi.

3.9. Settlement Intelligibility and Retail Shop Density

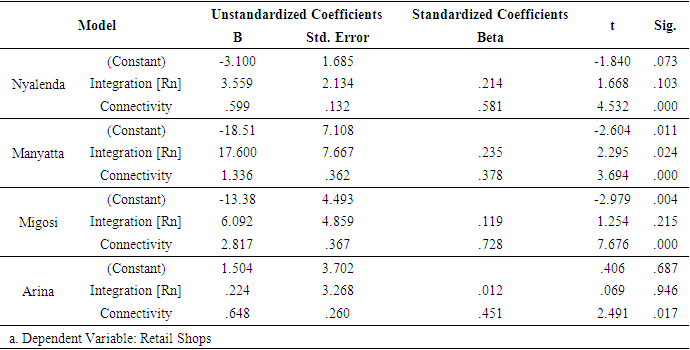
Likewise, the relationship between connectivity and global integration (Rn) was calculated to determine the intelligibility of each settlement. The results showed relatively low values in each settlement suggesting poor navigability of the settlements. The results showed that the informal settlements of Manyatta and Nyalenda had better intelligibility (R2= 0.3752 and R2= 0.2496) than the formal settlements (Migosi and Arina) which had R2= 0.1380 and R2 = 0.1744 respectively as shown in Figure 9.
The results show that the number of local connections (the number of routes one can use to reach the edge of the system) is limited in the formal settlements and their systems are not as strongly connected to the wider context, compared to the informal settlements. In this case, Manyatta had an R2 value of 0.3752, indicating that 37.52% of the variability in connectivity and global integration is accounted for by the model. Nyalenda had an R2 value of 0.2496, meaning that the model could explain 24.96% variability.
On the other hand, Migosi had an R2 value of 0.1380, indicating that only 13.80% of the variability is explained by the model. Arina had an R2 value of 0.1744, which means that 17.44% accounted for the variability. Based on these results, it is clear that the informal settlements of Manyatta and Nyalenda showed higher intelligibility since more of the variability in the data could be explained by the model compared to the formal settlements of Migosi and Arina.
According to Major (2018), settlements with better intelligibility have better accessibility and orientation, and thus, better navigation and stability of urban functions. While in most cases it is assumed that formal settlements have better intelligibility, the results portrayed otherwise for Migosi and Arina formal settlements compared to the informal settlements. Moreover, Van Nes & Yamu (2021), pointed out that intelligibility compares the number of alternative routes within a neighbourhood and how central they are to the entire city (global system). The results indicate relatively low intelligibility values suggesting that the settlements have few alternative streets (routes) connecting them to the citywide network (Pindor, Skorupka, & Szczepanska, 2011).
Hillier (2007) found that a navigable or legible system would show a high correlation between connectivity and global integration. He noted that low-value correlations are typical of a housing estate or suburb typologies. This assertion explains the low intelligibility correlation values in Arina and Migosi which are majorly characterised by controlled housing typologies. The results are consistent with those of Mirincheva, John, and Major (2020), who established low intelligibility correlations in estates that had typical housing or suburb typologies in Doha. Better qualities of the informal settlements could be explained by the slum upgrading programmes intensified by the Kenya Informal Settlements Improvement Projects (World Bank, 2019).

3.10. Test of Hypothesis on Intelligibility and Retail Shops

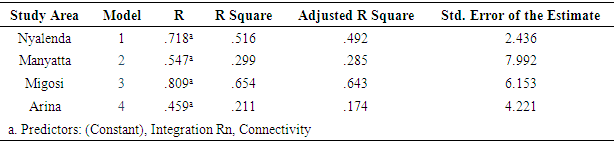
The research aimed to establish the relationship between intelligibility (connectivity and global integration Rn) and retail density. According to Kim (2001), intelligibility refers to the degree of correlation between local measures (connectivity) and global measures (integration Rn) and has significant implications for people's ability to orient themselves, navigate efficiently, and have a sense of place within to have a city.
a. Regression Summary Model
The results at Nyalenda were (R2 =0.516); Manyatta (R2 = 0.299); Migosi (R2 = 0.654); and Arina (R2 = 0.211) as shown in Table 13.
Table 13. Regression Summary Model for Intelligibility and Retail Shops
     
The results suggest that the regression models explain a moderate variance in the dependent variable for Nyalenda and Migosi, while the model for Manyatta and Arina explains the least variance. The coefficient of determination in Migosi shows that 65.4% of the variation in retail shop density can be explained by intelligibility in the regression model. The remaining 34.6% of the variation is unexplained. This indicates a relatively high level of explanatory power, suggesting that the independent variable(s) have a strong impact on determining retail shop density (Hair, Black, Babin & Anderson, 2019).
In the Nyalenda informal settlement, the results show R2 = 0.516 meaning that 51.6% of the variation in retail shop density can be explained by intelligibility. The remaining 48.4% of the variation is unexplained or due to other factors not included in the model. This suggests that the independent variable(s) in determining retail shop density have a moderate level of explanatory power (Gujarati & Porter, 2009). Furthermore, the results in Manyatta (R2 =.299) and Arina (R2 =.211) indicate a relatively weak association between intelligibility and retail shop density, suggesting that other factors or variables not included in the model may have a more significant impact (Field, 2013).
b. Regression Analysis of Variance Intelligibility and Retail Shop
The results of the F-calculated value from regression analysis of variance (ANOVA) were as follows: Nyalenda (F=21.833, p=0.000), Manyatta (F=21.081, p=0.000), Migosi (F=60.469, p=.000) and Arina (F=5.749, p=.006), as shown in Table 14.
Table 14. Regression Analysis of Variance for Intelligibility and Retail Shops
     
The F-values indicate the size of the differences between the group means, while the p-values determine the statistical significance of these differences. In this case, the p-values for all four groups are very small (less than 0.001), indicating strong evidence against the null hypothesis that there are no differences between the group means. In particular, for Nyalenda, Manyatta, and Migosi, the F values are relatively high, indicating significant differences between their means and the means of the other groups. In addition, the near-zero p-values underscore the significance of these differences.
On the other hand, Arina's F-score is lower compared to the other groups, indicating less difference between its mean and the means of the other groups. However, the p-value of 0.006 still suggests that the difference is statistically significant, although it may be comparatively smaller than the differences observed in the other groups.
Overall, based on the ANOVA results, it can be concluded that there are significant differences in the mean values between all four groups: Nyalenda, Manyatta, Migosi, and Arina. Therefore, the null hypothesis that there is no significant relationship between the intelligibility of settlements and retail shop density was rejected. This implies that settlement intelligibility influences retail shop density.
These results are consistent with those of Wang and Rao (2021), who examined the relationship between urban neighbourhood intelligibility and retail activity. Researchers found statistically significant associations between intelligibility and retail activity. They concluded that neighbourhoods with higher levels of intelligibility are associated with increased retail activity. Similarly, van Nes (2021) established that higher levels of intelligibility have a significant influence on retail shop density.
c. Regression Coefficients for Intelligibility and Retail Shops
The study also examined the nature of the relationship between the intelligibility predictors and retail shop density in each of the settlements by calculating the regression Beta coefficients. The results in Nyalenda were (global integration Rn: B=3.559, p=0.103 and connectivity: B= 0.599, p=0.000), Manyatta (global integration Rn: B=17.600, p=0.024 and connectivity: B=1.336, p=.000), Migosi (global integration Rn: B=6.092, p=.215 and connectivity: B=2.817, p=.000), and Arina (global integration Rn: B=.224, p=.946 and connectivity: B=.648, p=.017) as shown in Table 15.
Table 15. Regression Coefficients for Intelligibility and Retail Shops
     
Findings in Nyalenda showed a coefficient of 3.559 indicating a positive relationship between global integration Rn and retail shop density. The p-value of 0.103 indicates that this association was not statistically significant. Therefore, global integration Rn does not significantly predict the retail shop density in Nyalenda. However, there was a significant positive association between connectivity and retail shop density in the settlement (B=0.599, p=0.000). This means that a one-unit increase in connectivity would result in a 0.599-unit increase in retail shop density.
Unlike in Nyalenda, Manyatta showed a positive significant association between global integration Rn (B=17.600, p=0.024), connectivity (B=1.336, p=.000) and retail shop density. Therefore, an increase in global integration and connectivity would result in an increase in retail density by 17.6 and 1.336 units in Manyatta, respectively. Global Integration Rn was not significant in predicting retail shop density in the formal settlements of Migosi (B=6.092, p=.215) and Arina (B=.224, p=.946).
In contrast, connectivity showed a positive and significant association with retail density in Migosi (B=2.817, p=0.000) and Arina (B=0.648, p=0.017). This means that a one-unit increase in connectivity increases retail density in Migosi and Arina by 2.817 and 0.648, respectively. In summary, when comparing intelligibility and retail shop density, connectivity is more significant than global integration Rn.
The results are consistent with those of Liao and Wang (2017) who examined the influence of spatial configuration on retail concentration in Taipei, Taiwan. The study used space syntax analysis to explore the relationship between street connectivity, global integration and retail shop distribution. Results showed that connectivity was more important than global integration in predicting retail clusters. The authors concluded that better-connected streets had a higher density of retail shops and emphasized the importance of physical accessibility in planning for retail patterns.
However, it contradicts the findings of Louf, Barthelemy, and Hatna (2014), who examined the relationship between street networks and the distribution of retail activity. The research used space syntax to examine both connectivity and global integration measures. The results indicated that global integration had a stronger influence on retail shop density. The study found that high global integration, characterized by well-integrated and well-connected urban networks, promotes the formation of central business districts with higher retail shop density.
Furthermore, the study results are inconsistent with those of Shen, Fan, and Xie (2014), who examined the relationship between spatial syntax measures and the spatial distribution of retail shops, with a focus on the city of Shanghai, China. The study considered both connectivity and global integration in its analysis. Results indicated that global integration had a greater impact on retail activity density than connectivity. The research found that retail agglomerations tend to occur in areas of high global integration, indicating the importance of well-connected, larger-scale urban networks.
The study results are also inconsistent with those of Murcio, Loukaitou-Sideris, Cordero, and Piero (2016), who examined the relationship between spatial syntax measures and retail concentration in the city of Bogotá, Colombia. The study examined both connectivity and global integration and their impact on retail shop distribution. The results showed that while connectivity played a role in shaping retail patterns, global integration was a stronger indicator of retail concentration. The study emphasized that well-connected urban networks can lead to higher retail density at the city-wide level.

4. Conclusions

The results of the study demonstrated the existence of both significant and non-significant relationships between urban morphological attributes and retail shop density in Kisumu City. Specifically, street metric properties in Arina conclude that the control measure best predicted retail shop density than the other predictor variables. Control was found to correlate best with the retail density followed by choice, integration, and connectivity. Migosi, on the other hand, showed that street connectivity best-predicted retail shop density compared to integration, control, and choice.
In the informal settlements (Manyatta and Nyalenda) choice was the best predictor of retail shop density. It can be concluded that street metric properties are unique to each settlement and have different effects on retail shop density. In addition, the study was consistent with previous research that found choice to be the best predictor of retail density. For planned settlements, the variation depends on the level of planning and the quality of the underlying spatial structure, so metric properties can be unpredictable.
Synergy (local integration and global integration) explains a settlement's heterogeneity, viability and ability to support urban functions. Informal settlements show significantly better synergy values than planned neighbourhoods. Additionally, settlements that were further from the CBD had better synergy values than settlements that were within walking distance. In all settlements, the global integration (Rn) was not significant for predicting retail shop density. This means that retail shops are mostly located within walking distance of where customers live. This is because local integration values (R3) were significant in explaining retail density.
Intelligibility, on the other hand, is about readability or ease of navigation from one settlement to other areas within a city. It thus compares local and global metrics (connectivity and global integration Rn). According to the results, all settlements were unintelligible suggesting that the street networks were not well connected both locally and globally (citywide scale). Relatively, the informal settlements had better intelligibility values than the formal settlements. In terms of intelligibility, unlike other settlements, global integration was significant in predicting retail shop density in Manyatta. In addition, connectivity was more significant in predicting retail density in all settlements. Therefore, it can be concluded that local integration and connectivity are the best predictors of synergy and intelligibility respectively, in determining retail density in cities.
The study recommends that the County Government of Kisumu, through the Department of Lands, Housing, Physical Planning and Urban Development initiate a short-term street planning and redesign project for both the planned and unplanned settlements. This project will assess the strengths of street accessibility and its impact on land use developments, particularly in commercial areas. This should be guided by a space syntax analysis of the city’s street metric properties. The project is intended to focus mainly on areas with low connectivity, integration, choice and control indices. Additionally, settlements with high mean depth values should have improved connectivity by creating and reconnecting missing streets. The study yielded mixed results as to which street metric properties best predicted retail shop density. Therefore, land use development decisions in Kisumu must be guided by knowledge of the indices that perform best in each settlement. This will ensure effective land use developments, increased urban activity and economic growth of the city.
Additionally, there is a need to strengthen intelligibility by connecting various internal streets with the citywide streets. The County Government of Kisumu, through the Department of Infrastructure, Energy and Public Works should prioritise improving road connectivity from residential areas to all other areas of Kisumu. Intelligibility study results found that all areas of investigation were unintelligible. This means that navigation from the settlements to other parts of the city was poor. Therefore, the Department should initiate a project to rehabilitate all roads connecting settlements with other parts of the city. This may also include the installation of a footbridge connecting Arina to Manyatta, Manyatta to Migosi, or Nyalenda to Milimani among others. In addition to improving the accessibility of these areas, their synergies and retail density will increase.

References

[1]  Abulude, F., Akinnusotu, A., and Adeyemi, A. (2015). Global positioning system and its wide applications. Continental J. Information Technology, 9(1), 22-32.
[2]  Alalouch, C., Al-Hajri, S., Naser, A., and Al Hinai, A. (2019). The Impact of Space Syntax Spatial Attributes on Urban Land Use in Muscat: Implications for Urban Sustainability. Sustainable Cities and Society.
[3]  Al-Saaidy, H., and Alobaydi, D. (2020). Studying street centrality and human density in different urban forms in Baghdad, Iraq, Ain Shams Engineering Journal 12 (2021) 1111–1121, https://doi.org/10.1016/j.asej.2020.06.008.
[4]  Arentze, A., Oppewal H., and Timmermans J. (2005). “A Multipurpose Shopping Trip Model to Assess Retail Agglomeration Effects”. Journal of Marketing Research, 109 vol. XLII, 109–115.
[5]  Asiamah, N., Mensah, H., & Oteng-Abayie, E. (2017). General, Target, and Accessible Population: Demystifying the Concepts for Effective Sampling. The Qualitative Report, 22, 1607-1622.
[6]  Bafna, S., & Sheppard, R. (2012). The street network and spatial measurements of urban form. Journal of Planning Education and Research, 32(1), 35-53.
[7]  Bibri, S., Krogstie, J., and Kärrholm, M. (2020). Compact city planning and development: Emerging practices and strategies for achieving the goals of sustainability, Developments in the Built Environment, Vol. 4, https://doi.org/10.1016/j.dibe.2020.100021
[8]  Birkin, M., Clarke, G., and Clarke, P. (2002). Retail Geography and Intelligent Network Planning. Wiley; 1 edition.
[9]  Bland M. (2015). An Introduction to Medical Statistics. Oxford: Oxford University Press.
[10]  Camagni, R. (2017). Territorial capital, competitiveness and regional development. In R. Huggins & P. Thompson (Eds.), Handbook of regions and competitiveness (pp. 232–244). Edward Elgar.
[11]  Caragliu, A., Del Bo, C., & Nijkamp, P. (2011). Smart cities in Europe. Journal of Urban Technology, 18(2), 65-82.
[12]  Chidi, C. (2019). Bid-Rent Theory and Urban Land Use of Butwal Urban Area, Western Nepal, The Third Pole: Journal of Geography, Volume 18 - 19, 2019, DOI: https://doi.org/10.3126/ttp.v18i0.27990.
[13]  Christaller, W. (1966). Central Places in Southern Germany. Englewood Cliffs: Prentice-Hall.
[14]  Corpataux, J., Crevoisier, O., and Theurillat, T. (2017). The territorial governance of the financial industry. In R. Martin & J. Pollard (Eds.), Handbook on the geographies of money and finance (pp. 69–88). Edward Elgar.
[15]  Cutini, V., Pinto, V., Rinaldi, A., and Rossini, F. (2019). Informal Settlements Spatial Analysis Using Space Syntax and Geographic Information Systems, DOI: 10.1007/978-3-030-24302-9_25.
[16]  Dalton, N. (2010). synergy, intelligibility and revelation in a neighbourhood place. A published thesis of University College London, retrieved from: https://discovery.ucl.ac.uk/id/eprint/1334117/1/1334117.pdf.
[17]  Devas, N., & Rakodi, C. (2013). Planning and governance of the city in the global South. In International Encyclopedia of Housing and Home (pp. 307-313). Elsevier.
[18]  Dijkstra, P., & Poelman, H. (2019). The relationship between space syntax and economic vitality: A critical review. In Proceedings of the 11th International Space Syntax Symposium (pp. 139:1-139:15). Lisbon, Portugal.
[19]  DiPasquale, D., and Wheaton, W. (1996). Urban economics and real estate markets, Prentice Hall, Englewood Cliffs, NJ, 1996.
[20]  Evangelista, P., and Beskow, D. (2018). Geospatial Point Density. The R Journal Vol. 10/2, December 2018.
[21]  Fancher, E., & Fancher, R. (2010). How do consumers decide where to shop? The effect of visibility on consumer decision-making. Journal of Marketing Theory and Practice, 18(1), 37-48.
[22]  Field, A. (2013). Discovering statistics using IBM SPSS statistics. SAGE Publications.
[23]  Foucault, M. (1975). Discipline & Punish: The Birth of the Prison.
[24]  Freeman L. (1977). A set of measures of centrality based on betweenness. Sociometry 1977: 35–41. DOI: https://doi.org/10.2307/3033543.
[25]  Froy, F. (2016). Understanding the Spatial Organisation of Economic Activities in Early 19th Century Antwerp, The Journal of Space Syntax.
[26]  Geurs, K., and Ritsema, J. (2001). Accessibility measures: review and applications. Evaluation of accessibility impacts of land-use transportation scenarios, and related social and economic impact, accessed from: https://www.pbl.nl/en/publications/Accessibility_measures__review_and_applications.
[27]  Ghonimi, I. (2021). The Role of Urban Space Configuration in Maintaining Social Inclusion: A Comparison of Four Types of Neighborhoods in Greater Cairo Region-Egypt. Journal of Urban Research, Vol. 39.
[28]  Gujarati, N., & Porter, C. (2009). Basic econometrics. McGraw-Hill Education.
[29]  Hair, F., Black, C., Babin, J., & Anderson, E. (2019). Multivariate data analysis (8th ed.). Cengage Learning.
[30]  Hillier, B. and L. Vaughan (2007), ‘The City as One Thing’, Progress in Planning 67 (3), 205–230.
[31]  Hillier, B., & Hanson, J. (1984). The Social Logic of Space. Cambridge University Press.
[32]  Hillier, B., (2007). Space is the Machine: A Configurational Theory of Architecture. Space Syntax.
[33]  Hoogendoorn, B., Zwan, P. & Thurik, R. (2019). Sustainable Entrepreneurship: The Role of Perceived Barriers and Risk. Journal of Business Ethics 157, 1133–1154 (2019). https://doi.org/10.1007/s10551-017-3646-8.
[34]  Hutton, T. (2008). The New Economy of the Inner City: Restructuring, regeneration, and Dislocation in the twenty-first-century Metropolis. Routledge.
[35]  Ibrahim, A., Baharum, R., & Radzi, M. (2012). The effect of location and convenience on convenience store image and customer satisfaction. Procedia-Social and Behavioral Sciences, 50, 818-827.
[36]  Jabbari, M., Fonseca, F., & Ramos, R. (2021). Accessibility and Connectivity Criteria for Assessing Walkability: An Application in Qazvin, Iran. Sustainability, 13(7), 3648. MDPI AG. Retrieved from http://dx.doi.org/10.3390/su13073648.
[37]  Jansson, J., Bäckström, K., & Karlsson, C. (2012). How street intersections contribute to customer destination choices and patronage behaviour. Journal of Retailing and Consumer Services, 19(5), 459-466.
[38]  Jarah, S., Zhou, B., Abdullah, R., Lu, Y., and Yu, W. (2019). Urbanization and Urban Sprawl Issues in City Structure: A Case of the Sulaymaniah Iraqi Kurdistan Region, Sustainability 2019, 11, 485; doi:10.3390/su11020485.
[39]  Jiang, J., Claramunt, C., and Klarqvist, B. (2013). An Integration of Space Syntax into GIS for Modelling Urban Spaces. International Journal of Applied Earth Observation and Geoinformation.
[40]  Kaushik, A. (2016). Space syntax: A tool for smart and analytical investigation into urban settings. Journal of the Indian Institute of Architects, 81(11): 23–28.
[41]  Keh, T., Lee, H., & Park, W. (2006). Movement patterns of shoppers in downtown Taipei. Journal of Retailing and Consumer Services, 13(5), 331-342.
[42]  Kim, H., and Jun, C. (2015). Spatial Analysis of the Relationship Between Space Syntax and Land Use Density. Proceedings of the Ninth International Space Syntax Symposium.
[43]  Kim, S., Kim, J., & Kim, H. (2018). The effect of street visibility on tenant sales and rental prices: Evidence from Seoul, Korea. Sustainability, 10(11), 4152.
[44]  Kim, Y. (2001). The role of spatial configuration in spatial cognition. In Proceedings of the Third International Space Syntax Symposium (pp. 49.1-49.21), Atlanta, GA.
[45]  Kothari, C. (2004). Research Methodology: Methods and Techniques (Second Revised Edition). New Age International Publishers.
[46]  Liao, Y., & Wang, D. (2017). Spatial configuration and retail agglomeration effects: Evidence from Taipei. Urban Studies, 54(6), 1395-1415.
[47]  Longley, P., Boulton, C., Greatbatch, I., and Batty, M. (2003). “Strategies for Integrated Retail Management Using GIS”. Advanced Spatial Analysis – The CASA Book of GIS. ESRI Press.
[48]  Louf, R., & Barthelemy, M. (2014). Modelling the polycentric transition of cities. Physical Review Letters, 113(9), 098701.
[49]  Lü, G., Batty, M., Strobl, J., Lin, H., Zhu, A., and Chen, M. (2018). Reflections and Speculations on the Progress in Geographic Information Systems (GIS): A Geographic Perspective, International, Journal of Geographical Information Science. 2018; 33:346–367. DOI 10.1080/13658816.2018.1533136.
[50]  Major, D. (2018) The Syntax of City Space: American Urban Grids. New York: Routledge.
[51]  Maraschin, C., and Krafta, R. (2013). Growth dynamic of retail locations: a methodological approach using a logistic model, https://doi.org/10.4000/cybergeo.26002.
[52]  Marques, E. (2015). Urban Poverty, Segregation and Social Networks in São Paulo and Salvador, Brazil. International Journal of Urban and Regional Research, V.39, No 6, pp. 1067-1083.
[53]  McCartney, S., and Krishnamurthy, S. (2018). Neglected? Strengthening the Morphological Study of Informal Settlements, Sage Journals. https://doi.org/10.1177/2158244018760375.
[54]  Mirincheva, V., John, D., and Major, M. (2020), The role of synergy, intelligibility and permeability in structuring polycentric development in Doha, Proceedings of the 13th Space Syntax Symposium.
[55]  Mohamed, A., Van Nes, A., and Salheen, M. (2015). Beyond Informality: Traders as Space Experts in their Informal Settlements, Proceedings of 10th Space Syntax Symposium, University College London.
[56]  Murcio, R., Loukaitou-Sideris, A., Cordero, P., & Piñero, M. 2016). Connectivity and integration in the street network and the location of retail and services in Bogotá, Colombia. Urban Design International, 21(4), 243-256.
[57]  Narvaez, L., Penn, A., and Griffiths, S. (2015). The Architectural Adaptation of Urban Economic Life: Location, Use, and Form of the Commercial-residential Building in Cardiff, Proceedings of the 10th International Space Syntax Symposium.
[58]  Netto, V., and Furtado, M. (2017). Effects on Spatial and Social Behaviour for Residents in Social Housing Complexes in Rio de Janeiro, Brazil, Proceedings of the 11th Space Syntax Symposium (3rd – 7th July 2017).
[59]  Omer, I., and Gabay, R. (2007). Social Homogeneity and Space Syntax of Towns in Israel, Proceedings, 6th International Space Syntax Symposium, İstanbul, 2007.
[60]  Ozuduru, B., and Guldmann, J. (2013). Retail location and urban resilience: towards a new framework for retail policy. http://journals.openedition.org/sapiens/1620.
[61]  Pindor, P., Skorupka, A., and Szczepanska, J. (2011). ‘Psychology and syntax space’.
[62]  Pinelo, J. and Turner, A. (2010) Introduction to UCL DepthmapX 10, Version 10.08. 00r.http://archtech.gr/varoudis/depthmapX/LearningMaterial/introduction_depthmap-v10-website.pdf, (Consulted on 13/10/2020).
[63]  Porta, S., Strano, E., Lacoviello, V., and Messora, R. (2008). Street Centrality and Densities of Retail and Services in Bologna, Italy, Environment and Planning B Planning and Design 36(3), 450-465. https://doi.org/10.1068/b34098.
[64]  Reilly, W. (1931). “The Law of Retail Gravitation”. New York, W.J. Reilly, Inc.
[65]  Ren, H., Guo, W., Zhang, Z., Kisovi, L., and Das, P. (2020). Population Density and Spatial Patterns of Informal Settlements in Nairobi, Kenya, Sustainability 2020, 12, 7717; doi:10.3390/su12187717.
[66]  Rew, L., Radosevich, S., and Pokorny, M. (2006). Inventory and Survey Methods for Nonindigenous Plant Species, Monana State University Extension.
[67]  Rodrigue, J. (2017). “Transport and Development”, in D. Richardson, N. Castree, M.F. Goodchild, A. Kobayashi, W. Liu, and R.A. Marston (eds) The International Encyclopedia of Geography, New York: John Wiley & Sons.
[68]  Ross, C. (2011). Mixed-use development: Theory, practice, and cases. Routledge.
[69]  Samburu, P., Hayombe, P., and Owino, F. (2019). Influence of Circulation Space Configuration Attributes on the Location of Economic Enterprises in Obunga Informal Settlement, Kisumu City. Architecture Research 2019, 9(3): 63-73, DOI: 10.5923/j.arch.20190903.02.
[70]  Sawarkar, R., and Patil, A. (2019). Comparative Study of Formal Public Transport Network and Informal Public Transport Network of Nagpur, India, Materials Science and Engineering 603 (2019) 052046, doi:10.1088/1757-899X/603/5/052046.
[71]  Shen, L., Fan, Y., & Xie, Y. (2014). Space syntax and retail concentration: A case study of Shanghai. Environment and Planning B: Planning and Design, 41(2), 275-294.
[72]  Sjöholm, C. (2020). Arendt in the City. The Architecture of Political Life. Table Settings. Reflections on architecture with Hannah Arendt, OASE, (106), 28–34. Retrieved from https://www.oasejournal.nl/en/Issues/106/ArendtintheCity.
[73]  Smith, S. (2017). Landlordism and landlord-tenant relations in Kisumu and Kitale’s low-income settlements, International Journal of Urban Sustainable Development, 9:1, 46-63, DOI: 10.1080/19463138.2016.1264403.
[74]  Theurillat, T. (2022) Urban growth, from manufacturing to consumption and financialization: the case of China’s contemporary urban development, Regional Studies, 56:8, 1244-1258, DOI: 10.1080/00343404.2021.1901871.
[75]  Turner, A., and Penn, A. (2002). Encoding Natural Movement as an Agent-Based System: An Investigation into Human Pedestrian Behavior in the Built Environment. Environment and Planning B: Planning and Design, 29(4), 473-490.
[76]  Turok, I and McGranahan, G. (2013). Urbanization and economic growth: the arguments and evidence for Africa and Asia, Environment and Urbanization, vol. 25, issue 2, https://doi.org/10.1177/0956247813490908.
[77]  Van Nes and Yamu, C. (2021). Analysing Linear Spatial Relationships: The Measures of Connectivity, Integration, and Choice. IN Introduction to Space Syntax in Urban Studies, https://doi.org/10.1007/978-3-030-59140-3_2.
[78]  Vionis, A., and Papantoniou, G. (2019). Central Place Theory Reloaded and Revised: Political Economy and Landscape Dynamics in the Longue Durée, Land 2019, 8, 36; doi:10.3390/land8020036.
[79]  Wagah, G., Onyango, G., and Kibwage, J. (2010). Accessibility of water services in Kisumu municipality, Kenya, Journal of Geography and Regional Planning Vol. 3(4), pp. 114-125.
[80]  Wang, H., Rao, A. (2021). morphological history of urban centres in Qingdao. Comput. Urban Sci. https://doi.org/10.1007/s43762-021-00021-y.
[81]  Wang, K., and Fu, X. (2017). Research on the centrality of urban transport network nodes, AIP Conference Proceedings 1839, 020181 (2017); https://doi.org/10.1063/1.4982546.
[82]  Weber. A, (1928). Alfred Weber’s Theory of the Location of Industries, University of Chicago Press, Chicago.
[83]  Whitehead, A. (1925), Science and the modern world, The Eighteenth Century, chapter 4, page 81.
[84]  World Bank. (2019). Kenya Inclusive Growth and Fiscal Management. Available at www.worldbank.org. Accessed 26th January 2021.
[85]  Yamu, C., van Nes, A., and Chiara Garau, C. (2021). Bill Hillier’s Legacy: Space Syntax—A Synopsis of Basic Concepts, Measures, and Empirical Application, Sustainability 2021, 13, 3394. https://doi.org/10.3390/su13063394.