Architecture Research

p-ISSN: 2168-507X    e-ISSN: 2168-5088

2022;  12(2): 27-37

doi:10.5923/j.arch.20221202.01

Received: May 16, 2022; Accepted: Jun. 8, 2022; Published: Jun. 29, 2022


Life Cycle Energy and CO2 Analysis for Environmental Sustainability of the Nigerian Housing Stock

Isidore C. Ezema, Regina K. Okorigba

Department of Architecture, Covenant University, Ota, Nigeria

Correspondence to: Isidore C. Ezema, Department of Architecture, Covenant University, Ota, Nigeria.

Email:

Copyright © 2022 The Author(s). Published by Scientific & Academic Publishing.

This work is licensed under the Creative Commons Attribution International License (CC BY).
http://creativecommons.org/licenses/by/4.0/

Abstract

Against the background that buildings in general and residential buildings in particular impact on the environment, this paper used the life cycle energy and CO2 assessment framework to estimate the primary energy and CO2 emissions content of public housing in Lagos, Nigeria with a view to using the estimate to project for a future housing provision scenario. The importance of life cycle energy assessment (LCEA), a streamlined version of the ISO life cycle assessment (LCA) environmental management tool was highlighted and applied in the study area characterized by poor data conditions for full LCA. Specifically, the operational and embodied energy of the buildings and associated carbon dioxide emissions were addressed. Survey method was used to ascertain household characteristics especially household energy consumption while building materials inventory was obtained from contract documents complemented by observation and interviews. International energy and emissions protocols were used for operational energy and carbon estimation while the ICE database was used for embodied energy and carbon estimation. The study found that at 21,570 MJ/m2, life cycle operational energy intensity dominated embodied intensity which was 7,378 MJ/m2. Also, with life cycle operational and embodied carbon intensities of 1806kg/m2 and 589kg/m2 respectively, the carbon emissions scenario exhibited a similar pattern to the energy scenario. The study also found that while direct fuel combustion dominated operational energy and carbon intensities, initial and recurring materials accounted for the bulk of embodied impact. The above findings imply that in order to ensure sustainability of the housing stock, energy efficiency and carbon mitigation strategies targeted at both the operational and embodied aspects of the buildings should be pursued. In this respect the resort to renewable energy for building operation and low impact building materials for the embodied aspect become very necessary.

Keywords: Carbon emissions, Embodied energy, Environmental sustainability, Lagos, Life cycle assessment, Operational energy, Residential buildings

Cite this paper: Isidore C. Ezema, Regina K. Okorigba, Life Cycle Energy and CO2 Analysis for Environmental Sustainability of the Nigerian Housing Stock, Architecture Research, Vol. 12 No. 2, 2022, pp. 27-37. doi: 10.5923/j.arch.20221202.01.

1. Introduction

Environmental awareness has been on the increase with the emergence of sustainable development as a preferred development paradigm. The challenge of sustainable development or sustainability lies with maintaining a balance between the environment and development for the present and for the future. Environmental sustainability, a subset of holistic sustainability promotes development that cause minimum negative impact on the environment. The built environment is resource, energy and emissions intensive in terms of resource and energy consumption as well as greenhouse gases (GHG) emissions [1]. With rapid urbanisation, especially in developing countries and the attendant increasing need for housing, it is important to ensure that present and future stock of housing meet environmental sustainability requirements. In Nigeria, where there is a rapidly expanding urban population, the housing deficit has risen steadily from about 7 million in 1991 to about 20 million in 2019 [2,3]. Bridging this huge deficit under the prevailing housing procurement and use scenario will entail more pressure on the environment. Meanwhile, the built environment of which the housing sector is an important part of attracted good attention at the Conference of the Parties (COP 21) of the United Nations Framework Convention on Climate Change (UNFCCC) as indicated in the subsequent agreement reached [4]. Leveraging on the climate change mitigation targets adopted at COP 21, the current study examines the environmental profile of the Nigerian housing stock from the perspective of its energy and CO2 emissions profile using the life cycle energy and CO2 emissions analysis (LCEA) framework.
A very potent way of reducing GHG emissions from buildings is by reducing the energy profile of the building in terms of operational and embodied energy [5]. Hence, in order to curtail negative environmental impact and thus contribute to a sustainable environment, metrics have been developed to estimate energy use and CO2 emissions in buildings. One such environmental management metric is life cycle assessment (LCA) which is a standardized tool under the International Standards Organisation (ISO) for the measurement of environmental impact of products and processes throughout their life cycle usually from cradle to grave [6]. The LCA tool is quantitative and based on input-output analysis of materials and energy as opposed to other tools which are qualitative and sometimes value-laden. While full life cycle assessment is comprehensive and may result in a building being evaluated under different impact categories using specific soft-wares, life cycle energy assessment is a simplified and streamlined version that can be executed using a spreadsheet and can be applied in contexts where full life cycle assessment may be difficult due to poor data availability. Typically, life cycle energy assessment focuses on operational energy, embodied energy and carbon emissions.
It is against the above background that the present study adopted the LCEA framework for the assessment of the environmental profile of public housing in Lagos, Nigeria with particular reference to operational energy, embodied energy and associated carbon emissions. A predominant residential block typology in the study context was used to project for future housing provision in response to the prevailing housing deficit. Lagos is significant as study context because it has been observed that a third of the total housing deficit in Nigeria occurs in Lagos [7]. The paper addressed three issues and they are: (i) operational energy intensity, (ii) embodied energy intensity and (iii) CO2 emissions intensity associated with the operational and embodied aspects of the building typology. The overall purpose is to benchmark energy and carbon intensities of the studied buildings with similar buildings in other contexts. In addition, the outcome of the study will help to establish a basis for energy and carbon emissions reduction in existing and future housing stock in the study area.

2. Literature Review

2.1. Conceptual and Theoretical Background

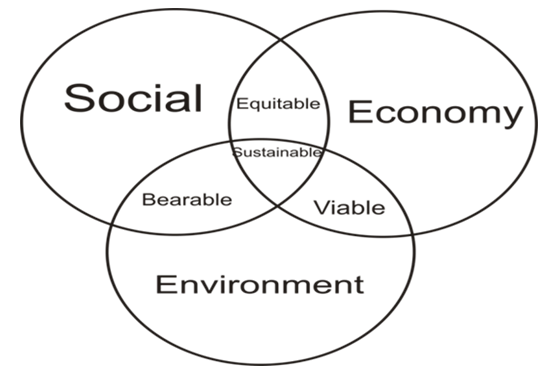
The concept of sustainable development or sustainability has been understood and explained in different ways especially through the use of models. One of the simplest models of sustainability is the Venn diagram or the three overlapping circles model (Figure 1). In the model each circle represents a dimension of sustainability with the confluence depicting area of full integration of parts of the three dimensions. More rigorous studies such as [8,9], point to the shortcomings of the above model in capturing the whole essence of sustainability. Nevertheless, the model remains relevant in facilitating a general understanding of sustainability. For the built environment in practitioner, what is important is putting the concept into practice [10]. In order for sustainability to become the human way of life, there is a need to scientifically understand the various sustainability dimensions and the interrelationships between them [11]. Quantitative assessment of sustainability using appropriate sustainability metrics is an aspect of the scientific understanding of the sustainability dimensions.
Figure 1. Intersecting Circles Model (Source: [12])
Environmental sustainability, an aspect of holistic sustainability, has been explained as the maintenance of natural capital which is the global ecosystem [13]. It aims at maintaining indefinitely the global ecosystem which is the main life-support of the entire world by appropriately managing its source and sink components [13]. The source capacity of the ecosystem provides all the inputs needed for life support while the sink capacity absorbs the outputs and wastes. The purpose of Goal 7 of the United Nations Sustainable Development Goals (SDGs) was to ensure environmental sustainability through the deployment of affordable, reliable, sustainable and modern energy for all [14]. In this respect, the SDGs identified four pillars of environmental sustainability namely: (i) universal access to affordable, reliable and modern energy, (ii) substantial increase in the renewable content of the energy mix, (iii) doubling the rate of energy efficiency from 2015 levels and (iv) enhancing international cooperation to facilitate access to clean energy research and promote investment in energy infrastructure. Energy and carbon emissions are key in the progress towards sustainability of the built environment. Hence, the current paper is hinged on the energy and carbon emissions component of environmental sustainability with particular reference to residential buildings, a subset of the built environment in relation to the Nigerian geographical context.
Environmental sustainability with reference to the built environment can be measured through the ecological footprints. The built environment is a huge consumer of resources and energy. Energy is utilized in materials production as well as in the use of the built environment. In order to bring about the built environment, resources in the form of energy, building materials, land, water and other natural resources are utilized. Similarly, built environment activities generate waste and emit dangerous substances to the environment. Hence, environmental sustainability within the built environment can be promoted by efficient use of input resources as well as through reduction of dangerous outputs to the environment. Hence the built environment can be seen as a system that is characterized by flow of resources.
In understanding environmental sustainability within the ecological context, systems theory and industrial ecology provide good theoretical foundations. Systems theory refer to the formalized study of systems and of the general properties of systems as enunciated by [15]. Among other characteristics, systems are located within boundaries and such boundaries serve to delineate the system from the environment and any subsystems from the overall system. Industrial ecology takes a systems view of the interactions between industrial (man-made) systems and ecological (natural) systems [16]. Hence, through industrial ecology, industrial systems try to imitate natural systems in order to achieve a balance similar to what obtains in natural systems, thereby limiting the negative impact of industrial systems on the ecosystem. Industrial ecology represents a general concept from where environmental management tools such as LCA and material flow analysis are developed [17]. Hence, the overall purpose of industrial ecology is to promote sustainability globally, regionally and locally. Industrial ecology typically adopts the multi-disciplinary approach by drawing extensively from other disciplines such as engineering and allied disciplines, economics, law and natural sciences.
A key aspect of industrial ecology is the concept of industrial metabolism which draws a parallel between natural metabolism and the use of materials and energy by industries and their transformations into products and byproducts such as wastes [18]. Hence through tracing of energy and material flows, inefficient products and processes are identified and curtailed. In simple terms, material flow analysis is the systematic assessment of the input and output flows of material to a system defined in space and time [19]. In a more detailed sense, materials and energy flow analysis or accounting is a method of investigating and quantifying the flow of materials and energy through complex ecological and economic systems in a specific geographical area during a certain period of time through the use of input – output methodologies [20].
Relating materials flow analysis to the building sector, inputs include: energy, building materials, water and land resources. These inputs are utilized to produce habitable buildings and the process also generates outputs such as wastes and emissions to air, water and land. The process of using the buildings so produced also leads to more materials utilization through replacement of components and renovation. Also there is additional energy utilization in the form of fulfilling occupants’ requirement for water use, cooking, lighting, appliance use and for maintenance of indoor comfort levels. The materials and energy flows also affect the building as a whole and the different life cycle phases of the building such that it would be possible to determine the relative contribution of each building life cycle phase to the overall environmental profile of the building.
Leveraging on the foregoing, a number of sustainability assessment tools have emerged both for holistic sustainability and for sustainability with particular reference to the built environment. Sustainability metrics generally have three scales of application namely: ecosystem scale, building-environment scale, and building scale [21]. Also, [22] categorized tools for holistic sustainability assessment into three namely: indicators/indices-based tools; product-related assessment tools; and integrated assessment tools. With particular reference to environmental sustainability, ecologically-based tools have also emerged. They include the ecological carrying capacity [23] and the ecological footprint as developed by [24]. Aptly, the classification of environmental assessment methods by [25] captured the whole gamut of building sustainability assessment more succinctly. Accordingly, the three classifications of building environmental assessment tools are: Environmental Impact Assessment (EIA); Qualitative Building Environmental Rating Systems and Quantitative Building Life Cycle Assessment. EIA has well-established procedures with a relatively long history as well as legal backing in many countries [26]. However, EIA has remained a site-specific environmental assessment tool with limited application to assessment of overall environmental sustainability. Qualitative building environmental rating system such as LEED and BREEAM have emerged over the years but they have largely remained voluntary, market-driven tools which have helped to draw attention to the environmental impact of buildings [27]. However, they remain relative measures of sustainability because as shown by [28], about 28 per cent of LEED-certified buildings consume more energy than conventional buildings.
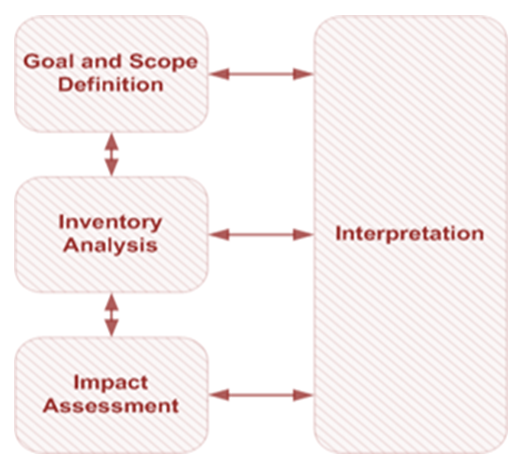
Life Cycle assessment (LCA) is a tool in environmental management which examines in quantitative terms, the burdens which a product or process imposes on the physical environment. The purpose of LCA is to assess the environmental impact of a product or process over its life cycle with a view to identifying and evaluating opportunities for environmental improvements. LCA application to buildings is evolving both as a method of assessing the environmental impact of buildings and building processes as well as a complement to existing qualitative market-driven, voluntary environmental assessment methods [29]. The LCA framework is a four-stage process comprising goal and scope definition, inventory analysis, impact assessment and interpretation (Figure 2). The goal and scope definition outlines the purpose of the LCA and establishes the boundary conditions. Inventory analysis collects data pertaining to materials and energy flows while impact assessment evaluates the environmental impact in relation to the scope earlier defined. Interpretation combines the inventory stage and the life cycle impact assessment to arrive at conclusions that would lead to recommendations. Whole life cycle of buildings encompasses three main stages namely: embodied phase (resource extraction, manufacturing of building materials, building construction); operational phase (building occupancy, maintenance); end of life phase (demolition, recycling and disposal) as delineated by [30]. Environmental impact of a building is assessed under many categories but this study following the streamlined approach focused on operational energy, embodied energy and carbon dioxide emissions.
Figure 2. Life Cycle Assessment Framework [6]
Operational energy refers to the energy expended during the use phase of a building and it includes energy used for household appliances, lighting, air-conditioning, domestic hot water, cooking and other household operations that require energy. Embodied energy is the latent or hidden energy of a building and it is the energy utilized during the manufacturing phase of a building. It includes the energy incurred in raw materials extraction, manufacturing of building materials, transportation of building materials as well as in construction and maintenance of a building all through its useful life. Both operational energy and embodied energy are consumed as delivered energy but their full impact on the environment is measured in primary energy terms. Energy in delivered usable form can either be from renewable or non-renewable sources. Given that the bulk of usable energy in the Nigerian context come from non-renewable sources, increased levels of energy consumption both at operational and embodied phases imply increased levels of consumption of non-renewable resources which impacts negatively on resource sustainability. Carbon emission results from both embodied and operational energy consumption of a building and it is significant for environmental sustainability as carbon is the main substance responsible for global warming.
LCA of buildings have been conducted in many contexts by various researchers [31,32,33,34,35]. Generally, life cycle assessment of buildings in Africa is still an emerging study area [36,37]. In Nigeria, LCA of building components had been reported by Ede et al., (2014). Also, whole building LCA had been reported by [38,39,40,41]. LCA is heavily dependent on the existence of requisite data such as building materials, energy use inventory, domestic energy consumption data among others. Such data are not available in the Nigerian context on a consistently organized basis that would lend it to general use. Hence, the methodology that follows adapted the LCA framework to suit the study context. Specifically, local process data were combined with international LCA inventories and databases as well as with international protocols on energy and emissions to estimate embodied and operational energy use as well as carbon dioxide emissions.

2.2. The Nigerian Housing Sector

The Nigerian housing sector is bedeviled by a myriad of challenges which are compounded by the rapid rate of urbanization. In order to address the challenges, there have been multi-layered approaches encompassing government at national and state levels, corporate organizations and individuals. From the era of direct government provision of housing to the era of public-private partnership, housing policy in Nigeria has come a long way. Notwithstanding, Nigeria’s housing shortfall is estimated to be about 17million housing units and bridging the deficit would require not only huge funds but also enormous material and energy resources.
Many studies on the Nigerian housing situation has tended to focus on strategies for housing provision, availability, affordability, characteristics and performance using different performance indicators as well as housing satisfaction. The aspects of housing research that has direct bearing on the present study include building performance evaluation, building materials utilization and energy performance of buildings. In the area of building performance evaluation, [42,43,44], employed user satisfaction surveys to evaluate building performance of public housing. [45] used expert evaluation of the physical characteristics and arrived at the conclusion that majority of the housing units surveyed were of poor quality both at the micro and macro levels. Furthermore, in the area of building materials utilization, the use of alternative materials especially the need for local building materials has dominated research efforts because of their easy availability as well as low cost and eco-friendliness [46,47].
In addition, energy performance of buildings in terms of indoor thermal performance informed the work of [48] as well as the work of [49]. Similarly, operational energy of buildings is central in the works of [50] as well as the work of [51]. In the area of life cycle environmental impact of buildings and building materials, [52] carried out a comparative environmental impact of concrete and steel using the Athena Impact Estimator and concluded that timber structures are more ecologically friendly than concrete structures. However, the assessment was limited to the building components level as the Athena Impact Estimator does not include operational energy simulation. In terms of innovation in the procurement process of housing, the literature indicates that conventional methods and processes dominate in spite of increasing opportunities for innovations towards sustainability in the building procurement process.
From the foregoing, it is evident that previous studies on housing in Nigeria have made only tangential reference to environmental sustainability as a whole and building LCEA in particular. Against the background that the housing sector globally and in Nigeria consumes huge resources in the form of energy and materials and also emits harmful substances to the environment, the next section deals with energy, emissions and the Nigerian environment. It is also evident that the above studies have not impacted deeply on the housing environment in Nigeria given the poor implementation of energy, carbon emissions and other regulations in the National Building Code of Nigeria. In fact, building energy regulation in Nigeria is a relatively new development [53,54,55].

2.3. Energy and Carbon Emissions in Nigeria

Energy use and carbon emissions are related. Nigeria is endowed with abundant renewable and non-renewable energy resources. However, the energy sector remains largely under-developed to the disadvantage of economic development. With the sixth largest crude oil reserve, over 5,000 billion cubic meters of natural gas, over 14,000MW hydropower capacity as well as high solar radiation, Nigeria’s per capita electricity consumption of 100kWh is very low and cannot engender genuine development [56]. Total installed capacity for grid electricity was estimated at 10,396MW out of which 6,056MW was available as at 2013 with the mix tilted to thermal electricity (81per cent) while the rest is attributed to hydropower sources [57]. The available capacity is further dwindling due to obsolete installations and poor maintenance. The National Bureau for Statistics estimated the total electrical power generation from the national grid to be 36,397.92Gwh in the year 2021, a marginal increase from the 35,720.27Gwh generated in 2020 [58,59].
Grid electricity remains the preferred delivered energy for domestic use in Nigeria. However, the electricity supply situation is abysmally low when compared with the electricity generation potentials and demand. Grid electricity is available only to about half of the Nigerian population and actual generation and distribution are further limited by inadequate and inefficient infrastructure [60,61]. Lagos, the study area, due to its cosmopolitan nature has the best access rate to grid electricity in Nigeria as national statistics show that as at 2009, only about 6% of households do not have access to grid electricity in the study area [62]. Supply of grid electricity is characterized by frequent outages with the consequent economic losses.
As a result, there is recourse to alternative electricity through the use of fossil fuel powered private electricity generators. [63,64] in separate studies in Lagos, Southwest Nigeria and Kaduna, Northern Nigeria respectively found high rate of electricity generator ownership and use. It has been estimated by National Bureau for Statistics (NBS) as presented by [65] that generators provide 48.6% of electricity in Nigeria. Also, Nigeria is reputed to be the highest user of electricity generators in Africa. High rate of carbon dioxide emissions has also been associated with the use of private electricity generators. A World Bank report links high amounts of carbon dioxide emissions and particulate matter (PM) to generator use. [66]. A similar report by the International Finance Corporation indicates that there is widespread use of electricity back-up generators in Nigeria with widespread environmental, health and economic impacts [67]. Hence, in addition to attendant pollution from the generators, a sizeable percentage of household income is spent on fueling the generators.
Nigeria’s energy outlook can be better understood within the context of the country’s development agenda. The national development plan that came into effect in 2010 and it is a ten-year plan culminating in 2020 was named Vision 20: 2020. Vision 20:2020 articulated Nigeria’s economic development agenda for the period in question and it aimed at making Nigeria one of the top twenty economies in the world by the year 2020. The rapid economic development envisaged by Vision 20:2020 entailed rapid infrastructural expansion in the areas of power, transport, oil and gas, housing and water resources with the attendant energy and emissions implications. Even though the envisaged target was not achieved, it provides a good pedestal on which to evaluate the energy and emissions scenario.
In absolute terms, Nigeria’s relative contribution to GHG emissions is low when compared with that of industrialized countries. However, Nigeria’s per capita GHG emission stands at about the world average but when emissions are measured per unit of GDP, it stands at about twice the world average [68]. Hence if the carbon intensity of the Nigerian economy remains at the latest measured levels, carbon emissions will grow astronomically when GDP increases in line with the national economic projections. The average annual increase of about 4.7 per cent as against the world average of about 1.9 per cent is an indication that with the prevailing national economic growth projections, Nigeria’s greenhouse gas emissions will equal the current levels prevalent in industrialized countries [69,70]. The major sources of GHG emissions include fugitive emissions especially from the oil and gas sector, transportation emissions and emissions from agriculture, land use and forestry [71,72]. Emissions from the electricity generating sets are considered to be higher than emissions from grid source [73].
At the international policy level, Nigeria is a signatory to the United Nations Framework Convention on Climate Change (UNFCCC) and the Kyoto Protocol on reduction of GHG emissions. Nigeria is also a party to the COP21 Agreement. Nigeria Nationally Determined Contribution commits to an unconditional reduction of GHG emissions by 20% in the year 2030 [74]. However, given the limited progress achieved in the energy sector, institutional arrangements for effective implementation of low carbon development and clean development mechanism are considered weak [75]. From the foregoing, it can be inferred that the Nigerian energy sector is characterized by low and inefficient supply situation despite the abundant resources available. The carbon intensity of usable energy in Nigeria is also high relative to the GDP. In the year 2018, it was estimated that the energy sector is the largest source of GHG emissions accounting for 60% of total emissions [74]. If current energy and carbon intensities are maintained in a scenario of rapidly increasing GDP, the overall environmental impact of energy consumption and associated GHG emissions would be adverse. This is particularly true in the built environment which is expanding through continuous urbanization and associated infrastructural development.

3. Research Methods

Lagos was used as a study area to demonstrate the applicability of the LCA framework in the Nigerian context. Given the paucity of relevant data in the study area, background data for the study were obtained from first principles. Hence, survey research design which was complemented by observation and interview and combined with the LCA framework was adopted for the study. The research population was the public housing units established by Lagos State Government between 1981 and 2005 for low and medium income earners located in medium–rise multi-family residential blocks in residential estates managed by the Lagos State Development and Property Corporation (LSDPC). Altogether, there are 31 such estates from where a sample of nine estates was taken randomly. The nine estates comprised 10,182 housing units which constituted the study population. Taking each estate as a stratum of the population, a sample size of 1,075 housing units was drawn systematically and used for questionnaire administration for the study. 775 validly completed questionnaires were retrieved and used for analysis. The questionnaire elicited data on aggregate household operational energy consumption with respect to grid electricity and direct fuel consumption. However, in order to obtain data for embodied energy estimation, building-specific inventory data such as types of material, quantities of materials as well as construction processes employed were needed. The building–specific data was obtained by selecting a case from the array of residential typologies identified in the study. The above scenario encapsulates LCA research strategy in contexts where low data availability exists [76,33]. The buildings studied were prototypes and a case typical of the predominant typology was selected for embodied energy analysis. Consequently, a block of six apartments on three floors with gross floor area of 720m2 was selected.
The results obtained from the survey and inventory stages which include electricity consumption measured in kWh and direct fuel consumption were used in conjunction with relevant international energy and emissions protocols and applicable LCA inventory databases to estimate energy consumption at the operational and embodied levels and carbon emissions associated with the selected residential building typology using the activity based method. In addition, the Inventory of Carbon and Energy (ICE) database developed by [77] was used for embodied energy and carbon coefficients while the carbon emissions factors developed by [78] and by [79] were used for operational emissions. In addition, manual energy coefficient for the tropical region as recommended by [80] was used for manual energy estimation. Also the electricity-specific emissions factors developed by [81] from IEA data was used for carbon emissions associated with grid electricity use.
Leveraging on above literature sources, the following equations further explain the detailed research methods.
i. Operational Energy
(1)
Where OE = operational energy, GE = grid electricity, FC = direct fuel consumption
(2)
Where PEGE = primary energy content of grid electricity, PEF = primary energy factor for grid electricity, 3.6 = conversion factor from kWh to MJ.
(3)
Where PEFC = primary energy content of direct fuel consumption, FC = quantity of fuel consumed, LHV = lower heating value of fuel.
ii. Embodied Energy
(4)
Where EE= total embodied energy, EEM = embodied energy of material (cradle – to – gate),
EET = embodied energy of transportation, EEC = embodied energy of construction, EEr = recurring embodied energy, DE = demolition energy.
iii. Material
(5)
Where; EEM = cradle-to-gate embodied energy of material, QM = quantity of material (kg)
EECF = embodied energy coefficient of material per unit of quantity obtained from the ICE database.
iv. Transportation
(6)
Where; EET = embodied energy of material transportation, QF = quantity of fuel consumed (litres), LHV = lower heating value of fuel.
v. Construction
Construction uses energy in the form site electricity consumption, fuel used to operate site construction equipment and manual energy. Energy associated with electricity use on site is estimated using Equation 2 while energy of direct fuel use on site was estimated using Equation 6. Manual energy was estimated using Equation 7 below based on [80].
(7)
Where; ME = manual energy (MJ), 0.75MJ/hour = human energy coefficient
L = number of labor workers, T = number of hours of work.
vi. Recurring Energy
(8)
Where; EEr = recurring embodied energy, QM = quantity of building material,
EECF = embodied energy coefficient of material per unit quantity, LB = life span of building, LM = life span of building material, LB/LM = churn rate.
vii. Operational Carbon Emissions
(9)
Where, CEFC = carbon emissions associated with direct fuel consumption, A = activity data (quantity of fuel), CEC = emission coefficient (kgCO2/quantity of fuel).
(10)
Where CEGE = carbon emissions associated with grid electricity, GE = grid electricity consumption, ESEF = electricity specific emission factor.
viii. Embodied Carbon Emissions
(11)

4. Findings and Discussion

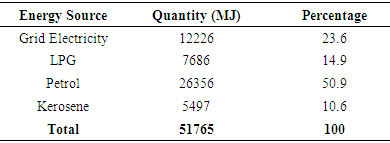
In quantitative terms, the operational energy of a housing unit in the typical building typology was estimated to be about 51,765MJ per annum (see table 1). Using 120m2 as the area of a housing unit, the operational energy intensity can be estimated to be 431.4MJ/m2/per annum. Over the building life span of 50 years, the operational energy of the studied housing unit was estimated as 2,588,250MJ with an intensity of 21,570MJ/m2. Hence, for every square meter of housing added to the existing housing stock, 21,570MJ of energy would be needed for the use phase of the building. Hence, at an average housing unit size of 120m2, over two billion square meters would be needed to bridge the estimated housing deficit of about 20 million. The resultant operational energy value is enormous. However, this can be ameliorated if the housing units are net-zero in terms of operational energy. In this respect, the deployment of renewable energy which is less intense in terms of impact becomes necessary.
Table 1. Total Operational Energy in Primary Energy Terms
     
In relative terms, petrol combustion, the main fuel for electricity generators contributed 50.9% of the total operational energy in primary energy terms, while grid electricity and cooking energy (LPG and kerosene) contributed 23.6% and 25.5%, respectively. Comparatively, the operational energy intensity of 21,570 MJ/m2 over the fifty-year life span of the building in this study is lower than the range of 27,360 – 31,680 MJ/m2 established in a pioneer study by [31]. Similarly, [33] estimated operational energy of different housing types in an unplanned Indonesian context (informal settlement) and arrived at the values of 11.6 – 32.1 GJ (11,600 – 32,100) MJ per annum, which are comparable to the value estimated from this study. Also, [34] estimated operational energy of Indian examples to be in the range of 37.3 – 66.85 GJ/m2 (37,300 – 66,850) MJ/m2 depending on the envelope characteristics of the buildings. Hence, from the above, in spite of the low electricity supply and consumption index in the study area, the operational energy profile is comparable to and in some cases higher than that of other studies. This could be attributed to the relatively high level of direct fuel combustion in the study area for alternative electricity supply.
As shown in Table 2, the total embodied energy of reference building is 5,312,106.64MJ. The major contributors to the embodied energy were the cradle-to-gate category (50.52%) and the recurring embodied energy category (46.47%). About 44.4% of cradle-to-gate embodied energy is attributed to cement and steel reinforcement. Also, the embodied energy intensity of the building was computed as 7,378MJ/m2. If the above intensity is compared with the earlier calculated operational energy intensity of 21,570MJ/m2, and if demolition energy is assumed to be negligible, the embodied intensity was found to be 25.5% while operational intensity was 74.5% of life cycle energy intensity. In comparison with a Brazilian study [35] with embodied and operational intensities of 7,200MJ/m2 and 17,500MJ/m2, respectively, the embodied impact is comparable while the operational impact is tilted in favor of the Brazilian example. This is attributed to Brazil’s more favorable energy mix which has a high renewable energy content.
Table 2. Summary of Embodied Energy Calculation
     
The summary of operational carbon emissions for reference building is as shown in Table 3. Total operational carbon emission for a year for the reference building was estimated at 26,004kg. When estimated for the life span of the building, the total operational carbon emission was found to be around 1,300,200kg. The grid electricity component of operational carbon was about 12.18% while the direct fuel combustion component constituted the other 87.82%. From the foregoing, it is evident that the operational carbon emission in the reference building is dominated by off-grid direct fuel combustion.
Table 3. Summary of Operational Carbon Emissions
     
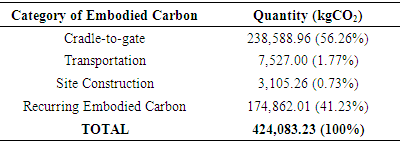
Total embodied carbon emission was estimated to be 424,083.23 kg (see Table 4). The major components of embodied emissions were the cradle-to-gate emissions (56.26%) and the recurring embodied carbon emissions (41.23%). From the foregoing, it can be seen that materials for both the initial construction and maintenance are the main sources of carbon emissions in residential buildings within the study area. Hence, carbon mitigation strategies should focus on materials of construction and materials for maintenance. In maintenance, the frequency of building component replacement during the life span of the building is critical. Hence, materials with little or no replacement during the life span of the building are preferred.
Table 4. Summary of Embodied Carbon Emissions
     
The total life cycle carbon emission for the reference building is 1,724,283.23kg while carbon intensity of the building is about 2,395kg/m2 or 48kg/m2/year. Carbon emissions from the building sector are determined by the type and quantity of energy consumed in the buildings. Energy consumption and carbon emissions benchmarks and reduction targets are not available for the Nigerian residential sector. The above results show that emissions from the building sector should not be ignored in the match towards low carbon development. Even though carbon emissions in Nigeria have been dominated by fugitive emissions according to [71] as well as emissions from agriculture, land use and forestry [72], the foregoing scenario indicates that emissions from the building sector is increasing and should attract attention given the rapidly expanding building stock and the increasing levels of ownership of energy consuming appliances. Carbon mitigation strategies should ideally target energy consumption first and the adoption of low carbon energy development strategies such as increasing use of renewable energy and energy efficient practices will reduce carbon emissions.

6. Implications

Energy and carbon intensities are pre-requisites for setting up environmental sustainability targets and benchmarks for buildings. This study has provided baseline data on the operational energy, embodied energy, and carbon emission intensities of residential buildings in the study area.
In order to reduce operational energy intensity of residential buildings without compromising on indoor comfort, architects should adopt passive design principles. The adoption of passive design principles will reduce reliance on availability of energy for indoor human comfort. These principles were used in the past by even indigenous builders but appear to have fallen into disuse in recent times with the advent of modernism. Closely related to the above is the need to adopt renewable energy as a way of reducing the impact of high energy consumption. Give the poor energy availability in the study area, the use of renewable energy will reduce reliance on electricity generators which are fired by hydrocarbons, thereby contributing to high level of carbon dioxide emission.
The study has also underscored the importance of building materials, components, construction processes and building maintenance from the energy and emissions implications. The bulk of the embodied energy of the reference building is traceable to materials for both initial construction and maintenance. Hence, in order to reduce the embodied energy of buildings, architects should specify low energy and durable materials. In addition, research into and development of low energy building materials should be encouraged.
Emphasis of GHG emissions in the Nigerian context has been on agriculture, land use change and fugitive emissions. This study has indicated that carbon emissions from the residential building stock are equally important in the movement towards low carbon environment. Operational carbon mitigation should target emissions from direct fuel combustion while embodied carbon mitigation should target building materials and components especially high carbon materials such as cement, steel products and other building materials made from industrial processes.
The foregoing underscores the central role of built environment professionals especially architects in contributing to environmental sustainability through appropriate energy and carbon sensitive designs and materials specification.

7. Conclusions

The study highlighted the importance of life cycle assessment as an environmental management tool and used it to estimate the operational and embodied energy intensities of a prototype residential building over a 50-year life span in a context of poor data conditions. Also estimated were the carbon emissions associated with the operational and embodied phases of the building. The study showed that the energy consumption profile of a building depends not only on the conspicuous energy consumption represented by operational energy but also on the latent energy inherent in building materials and construction processes. While the operational component is dominant, the embodied component is equally significant. Carbon emissions are directly related to both operational and embodied energy use. Hence, carbon mitigation strategies should start with low energy use associated with low carbon energy generation and energy efficiency strategies. Given that no benchmarks exist in the study area for such environmental indices as operational energy, embodied energy and carbon emissions, findings of this study become a foundation upon which subsequent studies can be conducted. This will ultimately lead to the establishment of national benchmarks for energy efficiency and targets for carbon emissions mitigation in residential buildings in both the study context of Lagos and the wider Nigerian context.
With respect to the existing housing stock with rudimentary procurement process and un-innovative use of materials and construction methods, sustainability both at the operational and embodied phases is informed. Already, there are efforts at introducing energy use regulations in the building code of Nigeria. Such efforts are directed to operational energy but it should ultimately encompass embodied energy and carbon emissions as well.

References

[1]  UNEP, 2009, Buildings and climate change: summary for decision-makers, UNEP, Paris, France.
[2]  Ekpo, A., 2019, Housing deficit in Nigeria: issues, challenges and prospects, Central Bank of Nigeria Economic and Financial Review, 57(4), 177 – 188.
[3]  Moore, E. A., 2019, Addressing housing deficit in Nigeria: issues, challenges and prospects, Central Bank of Nigeria Economic and Financial Review, 57(4), 201 – 222.
[4]  UN, 2015, Paris agreement, United Nations Framework Convention on Climate Change, https://unfccc.int/sites/default/files/english_paris_agreement.pdf.
[5]  IPCC, 2007, IPCC Fourth Assessment Report: Climate Change 2007. IPCC, Cambridge University Press, Cambridge, UK.
[6]  International Organization for Standardization (ISO) (2006), Life cycle assessment (ISO 14040). ISO Geneva, Switzerland
[7]  Oshodi, L. (2010): Housing, Population and Development in Lagos, Nigeria http://985.so/chgv.
[8]  Lozano, R., 2006, Envisioning sustainability three-dimensionally, Journal of Cleaner Production, 16, 1838– 1846.
[9]  Moir, S.and Carter, K., 2012, Diagrammatic representation of sustainability – a review and synthesis, In: Smith, S. D. (Ed.), Proceedings 28th Annual ARCOM Conference, Edinburgh, UK, 1479 – 1489.
[10]  Parkin, S., Sommer, F., and Uren, S., 2003, Sustainable development: understanding the concept and practical challenge, Proceedings of the Institution of Civil Engineers – Engineering Sustainability, 156, 19 – 26.
[11]  Marshall, J. D. and Toffel, M. W., 2005, Framing the elusive concept of sustainability: A sustainability hierarchy, Environmental Science and Technology, 39(3), 673 – 682.
[12]  IUCN, International Union for Conservation of Nature, 2006, The future of sustainability: re-thinking environment and development in the twentyfFirst century. https://portals.iucn.org/library/node/12635.
[13]  Goodland, R., 1995, The concept of environmental sustainability, Annual Review of Ecology and Systematics, 26: 1 – 24.
[14]  UN, 2015, Transforming our world: the 2030 agenda for sustainable development, United Nations. http://985.so/chgf.
[15]  Bertalanffy, L., 1968, General system theory: foundations, development, applications, New York: George Braziller.
[16]  Garner, A. and Keoleian, G.A., 1995, Industrial ecology: An introduction, pollution prevention and industrial ecology, National Pollution Prevention Centre far Higher Education, University of Michigan, Ann Arbor, pp1- 32.
[17]  Jacquemin, L., Pontalier, P. and Sablayrolles, C., 2012, Life Cycle Assessment (LCA) Applied to the Process Industry: A Review, International Journal of Life Cycle Assessment, 17(8), 1028- 1041.
[18]  Ayres, R. U., 1994, Industrial Metabolism: Theory and Policy, In: Allenby, B. R. (Ed.), The Greening of Industrial Ecosystems, Washington DC: National Academy Press, pp.23 – 37.
[19]  Rincon, L., Castell, A., Perez, G., Sole, C., Boer, D. and Cabeza, L. F., 2013, Evaluation of the environmental impact of experimental buildings with different constructive systems using material flow analysis, Applied Energy, 109: 544 – 552.
[20]  Baccini, P. and Brunner, P. H., 2012, Metabolism of the anthroposphere: analysis, evaluation, design. Massachusetts: MIT Press.
[21]  Srinivasan, R. V., Braham, W. W., Campbell, D. E. and Curcija, D. C., 2011, Sustainability assessment frame- works, evaluation tools and metrics for buildings and its environment – a review, Proceedings 12th International Conference of Building Simulation, Building Performance Simulation Association, Sydney, 14 – 16 November, 2011.
[22]  Ness, B., Urbel-Piirsalu, E., Anderberg, S. and Olsson, L. 2007, Categeorising tools for sustainability assessment, Ecological Economics, 60: 498-508.
[23]  Bendewald, M. and Zhai, Z. J. 2013), Using carrying capacity as a baseline for building sustainability Assessment, Habitat International, 37: 22 – 32.
[24]  Wackernagel, M. and Rees, W. E., 1996, Our ecological footprint: reducing human impact on earth. British Columbia: New Society Publishers.
[25]  Forsberg, A. and Von Malmborg, F. 2004, “Tools for environmental assessment of the built environment” Building and Environment, 39: 223-228.
[26]  Abaza, H., Bisset R. and Sadler, B. 2004, Environmental impact assessment and strategic environmental assessment: Towards an Integrated Approach. Geneva: United Nations Environment Programme.
[27]  Cole, R. J. 2005, Building environmental assessment methods: redefining intentions, Building Research and Information, 27(4), 230 – 246.
[28]  Newshan, G.R., Mancini, S. and Birt, B.J., 2009, Do LEED- certified buildings save energy? Yes, but, Energy and Buildings, 41: 897- 905.
[29]  Optis, M., 2008, Incorporating life cycle assessment into the LEED green building rating system. Master of Applied Science Thesis, Department of Mechanical Engineering, University of Victoria.
[30]  Monahan, J. and Powell, J.C., 2011, An embodied carbon and energy analysis of modern methods of construction in housing: a case study using a life cycle assessment framework, Energy and Buildings, 43: 179-188.
[31]  Adalberth, K., 1997, Energy use during the life cycle of single unit dwellings: examples, Building and Environment, 32(4), 321- 329.
[32]  Crawford, R. H., 2012, An as-occupied life cycle energy assessment of a residential building, Proceedings, 46th Annual Conference of the Architectural Science Association, Griffith University.
[33]  Surahman, U. and Kubota, T., 2012, Life cycle energy and CO2 emissions in unplanned residential buildings of Indonesia: a case study in Bandung, Proceedings, 28thPLEA Conference, 7-9 November, 2012, Lima, Peru.
[34]  Ramesh, T., Prakash, R. and Shukla, K.K., 2013, Life cycle energy analysis of multifamily residential house: a case study in Indian context, Open Journal of Energy Efficiency, 2: 34-41.
[35]  Paulson, J.S. and Sposto, R.M., 2013, A life cycle energy analysis of social housing in Brazil: case study for the Program “MY HOUSE MY LIFE”, Energy and Buildings, 57: 95-102.
[36]  Maepa, M., Bodunrin, M. O., Burmana, N. W., Croft, J., Engelbrecht, S., Ladenika, A. O., Mcgregor, O. S. and Harding, K. G., 2017, Life cycle assessment in Nigeria, Ghana and Ivory Coast, International Journal of Life Cycle Assessment, 22: 1159 – 1164.
[37]  Karkour, S., Rachid, S, Maaoui, M., Lin, C. and Itsubo, N., 2021, Status of life cycle assessment (LCA) in Africa, environments, 8(10), https://doi.org/10.3390/environments8020010.
[38]  Ezema, I. C., Olotuah, O. A. and Fagbenle, O. I., 2015, Estimating embodied energy in residential buildings in a Nigerian context, International Journal of Applied Engineering Research, 10, 44140 – 44149.
[39]  Ezema, I. C., Opoko, A. P. and Oluwatayo, A. A., 2016, Decarbonizing the Nigerian housing sector: the role of life cycle CO2 assessment, International Journal of Applied Environmental Sciences, 11(1), 325 - 349.
[40]  Udomaiye, E. and Chukwuali, C. B., 2018, Climate change mitigation strategies in the Nigerian housing sector: the role of life cycle CO2eq assessment, International Journal of Architecture, Engineering and Construction, 7(4): 54 – 69.
[41]  Udomaiye, E., Chukwuali, C.B. and Kalu, C. K., 2020, Life cycle energy assessment (LCEA): a prospect for sustainable architecture in developing countries, Civil Engineering and Architecture, 8(5), 777 – 7791.
[42]  Ilesanmi, A.O., 2010, Post-occupancy evaluation and residents’ satisfaction with public housing in Lagos, Nigeria Journal of Building Appraisal, 6(2), 153-169.
[43]  Jiboye, A. D., 2010, The correlates of public housing satisfaction in Lagos, Nigeria: feedback for residential improvement, Frontiers of Architectural Research, 1, 236 – 243.
[44]  Ibem, E. O., Opoko, A. P., Adeboye, A. B. and Amole, D., 2013, Performance evaluation of residential buildings in public housing estates in Ogun State, Nigeria: Users’ Satisfaction Perspective, Frontiers of Architectural Research, 2: 178 – 190.
[45]  Ilesanmi, A.O., 2012, Housing, Neighbourhood quality and quality of life in public housing in Lagos, Nigeria. International Journal of Housing Studies, 36(4), 231-240.
[46]  Adedeji, Y.M.D., 2011, Sustainable housing in developing nations: the use of agro- waste composite panels for walls, The Built & Human Environment Review, 4(2011), 36- 43.
[47]  Arayela, O. and Taiwo, A.A. 2010, Stabilized laterite bricks as an appropriate walling material technology for increasing housing stock in some selected African countries, Proceedings of XXXVII IAHS World Housing Congress, October 26 – 28, Santacher, Spain.
[48]  Adunola, A.O and Ajibola, K., 2012, Thermal comfort considerations and space use within residential buildings in Ibadan, Nigeria. Proceedings, 7th Windsor Conference on the Changing Context of Comfort in an unpredictable World, Windsor, UK, 12-15 April, 2012.
[49]  Olaniyan, S. A., 2012, Optimizing thermal comfort for tropical residential designs in Nigeria: how significant are walling fabrics. Proceedings of 2nd Conference on People and Buildings, London Metropolitan University, 18th September. Network for Comfort and Energy use in Buildings. Retrieved from: http://www.nceub.org.uk on 28/07/2014.
[50]  Ogbonna, A.C., Onazi, O. and Dabtong, J.S., 2008, Domestic energy consumption patterns in a sub-Sahara African city: the study of Jos-Nigeria, Journal of Environmental Sciences and Resource Management, 3: 48 – 63.
[51]  Irimiya, Y., Humphrey, I.A and Aondover, I.I., 2013, Assessment of energy use pattern in residential buildings of Kano and Kaduna, Northern Nigeria. American Journal of Engineering Research (AJER), 02(10), 271-275.
[52]  Ede, A. N., Adebayo, S. O., Ugwu, E. I. and Emenike, C. P., 2014, Life cycle assessment of environmental impacts using concrete or timber to construct a duplex residential building, Journal of Mechanical and Civil Engineering, 11(2), 62 – 72.
[53]  FMW&H, Federal Ministry of Works & Housing, 2016, Building energy efficiency guidelines for Nigeria. Abuja: Federal Ministry of Works and Housing (Housing Sector).
[54]  FRN, Federal Republic of Nigeria, 2017, National building energy efficiency code. Abuja: Federal Ministry of Works and Housing (Housing Sector).
[55]  Geissler, S, Osterreicher, D. & Macharm, E., 2018, Transition towards energy efficiency: developing the Nigerian building energy efficiency code, Sustainability, 10, 2620, https://doi:10.3390/su1008260.
[56]  Federal Ministry of Power and Steel, 2006, Renewable electricity policy guidelines, International Centre for Energy, Environment and Development, Abuja, Nigeria.
[57]  KPMG, 2013, A Guide to the Nigerian power sector, KPMG Advisory Services, Nigeria. http://www.kpmg.com/African/en/IssuesAndInsights/Articl.
[58]  NBS, National Bureau of Statistics, 2021, Power sector data: energy generated and sent out, March 2021.
[59]  NBS, National Bureau of Statistics, 2022, Power sector data: energy generated and sent out, March 2022.
[60]  Eleri, E. O., Ugwu, O. and Onuvae, P., 2012, Expanding access to pro-poor energy services in Nigeria, International Centre for Energy Environment and Development.
[61]  Sambo, A. S., Garba, B., Zama, I. H. and Gaji, M. M., 2012, Electricity generation and the present challenges in the Nigerian Power Sector, Journal of Energy and Power Engineering, 6(7), 1050 – 1059.
[62]  NBS, National Bureau of Statistics NBC (2010), Annual abstract of statistics 2010, Federal Republic of Nigeria.
[63]  Otegbulu, A. C., 2011, Economics of green design and environmental sustainability, Journal of Sustainable Development, 4: 240-248.
[64]  Mbamali, I., Stanley, A. M. and Zubairu, I. K., 2012, Environmental, health and social hazards of fossil fuel electricity generators: a users’ assessment in Kaduna, Nigeria, American International Journal of Contemporary Research, 2(9), 231 – 245.
[65]  Nnodim, O., 2021, Generators provide 48.6% of electricity in Nigeria, Punch Newspaper 19/12/2021. https://punchng.com/generators-provide-48-6-of-electricity-in-nigeria-nbs/.
[66]  The World Bank, 2014, Diesel power generation: inventories and black carbon emissions in Nigeria. www.worldbank.org.
[67]  IFC - International Finance Corporation, 2019, The dirty footprint of the broken grid: the impacts of fossil fuel back-up generators in developing countries. www.ifc.org.
[68]  Cervigni, R., Rogers, J. A. and Henrion, M. (Eds.), 2013, Low-carbon development opportunities for Nigeria, Directions in Development, Washington DC: The World Bank. Retrieved from: http://doi:10.1596/978-0-8213-9925-5.
[69]  Anomohanran, O., 2012, Estimating the greenhouse gas emissions from petroleum product combustion in Nigeria, Journal of Applied Sciences, 11(7): 3209 -3214.
[70]  Federal Ministry of Environment - Special Climate Change Unit, 2010, National environmental, economic and development study (NEEDS) for climate change in Nigeria, Final Draft, Federal Republic of Nigeria, Abuja.
[71]  Anastassia, M., Fredrick, O., and Malcolm, W., 2009, The future of carbon capture and storage (CCS) in Nigeria, Science World Journal, 4(3): 1 – 6.
[72]  Dayo, B., Gilau, A. and Samec, M., 2009, Nigeria’s perspective on climate change mitigation, ICEED Working Paper, September, 2009, Abuja, Nigeria.
[73]  FRN, Federal Republic of Nigeria, 2021, Nigeria; nationally Determined contribution – update. Abuja: Federal Ministry Of Environment.
[74]  Eleri, E. O., Onuvae, P. and Ugwu, O., 2013, Low-carbon energy development in Nigeria: challenges and opportunities, International Institute for Environment and Development (IIED), London, UK.
[75]  Rodriquez, O. O. O., 2009, Sustainability assessment within the residential sector: a practical life cycle method applied to a developed country and a developing country, PhD Dissertation, University of Rovira, Tarragona, Spain.
[76]  Hammond, G. and Jones, C., 2011, Inventory of carbon and energy (ICE), Version 2.0, University of Bath, UK.
[77]  World Resources Institute (WRI), 2012, Greenhouse gases calculation tools for stationery emission sources. World Resources Institute, Washington DC, USA. http://www.ghgprotocol.org/templates/GHG5/layout.asp?type=p&Menuld=OTAx.
[78]  Odigboh, E. U., 1997, Machines for crop production. In Stout, B.A. (Ed.), CIGR Handbook of Agricultural Engineering, American Society of Agricultural Engineering.
[79]  Brander, M., Sood, A., Wylie, C., Haughton, A. and Lovell, J., 2011, Electricity-Specific Emission Factors for Grid Electricity, Technical Paper, Ecometrica, UK. www.emissionfactors.com.