-
Paper Information
- Paper Submission
-
Journal Information
- About This Journal
- Editorial Board
- Current Issue
- Archive
- Author Guidelines
- Contact Us
Architecture Research
p-ISSN: 2168-507X e-ISSN: 2168-5088
2020; 10(1): 27-43
doi:10.5923/j.arch.20201001.04

Walkability in Different Contexts in Neighbourhood Planning: An Overview
 Abstract
 Reference
 Full-Text PDF
 Full-text HTML
Ismail Mustapha Sulaiman
Department of Architecture, Istanbul Okan University, Istanbul, Turkey
Correspondence to: Ismail Mustapha Sulaiman , Department of Architecture, Istanbul Okan University, Istanbul, Turkey.
| Email: |  |
Copyright © 2020 The Author(s). Published by Scientific & Academic Publishing.
This work is licensed under the Creative Commons Attribution International License (CC BY).
http://creativecommons.org/licenses/by/4.0/

Walking has been shown to be a healthy and eco-friendly activity. Over the last decade, the study of different walkable places has increased and has been encouraged because walkability is a unique attribute of each setting. With the Neighbourhood as a primary frame of reference this paper summarises and compares walkability studies that have taken place in different contexts, within different cities and countries. A bibliometric study was done to show the spread of walkability studies in academic literature. Selected studies were then summarised to highlight their theoretical premise, methodology and results. The studies were then compared based on their scales, objective assessment of the environment and assessment of pedestrian perception. The study provides an overview of the approaches and methods that can be taken to assess walkability in different Neighborhoods.
Keywords: Walkability, Pedestrian perception, Walking habits, Neighborhoods
Cite this paper: Ismail Mustapha Sulaiman , Walkability in Different Contexts in Neighbourhood Planning: An Overview, Architecture Research, Vol. 10 No. 1, 2020, pp. 27-43. doi: 10.5923/j.arch.20201001.04.
Article Outline
1. Introduction
- Cars and Transport systems play a massive role in the design of cities and neighbourhoods, over the years the pedestrian needs have not been catered for. “' Walkability and the walkable city” appeared in modern literature as an offshoot of the movement towards healthy wellbeing, a sustainable and eco-friendly environment.Even though the general aims of walkability studies are the same, the approaches and methods differ sometimes dramatically based on the constraints that occur as a result of varying contexts. Notwithstanding, these studies showcase a variety of tools and methods that could be applied to test human responses to the built environment.The walkable neighbourhood could be both a physical and a social construct. A neighbourhoods ability to generate community-relevant attitudes and behaviours may be linked to walkability as well. The definitions of walkability may differ not just as a result of slightly differing lexicon but as a result of differing context, social diversity and interaction diversity of building types, high density may refer to pedestrian based services within walking distances. Parameters used in analyzing pedestrian perception in the different contexts are chosen to reflect contextual realities such as access to pedestrians, census data and so on.This paper provides a short view of the spectrum of the variety of methods that could be used in new contexts and also the useful applications of such methods for designers and policymakers alike.
2. Walkability in Literature
- In order to get a glimpse of the nature of the use of the term “walkability” in academic literature, a bibliometric approach is used to begin the literature review. Bibliometrics can be used to examine how the different research areas and disciplines relate with one another. This approach is equally used to assess the impact, value and popularity of research [1]. This is done using tools like citation, co-citation, co-occurrence and so on [1]–[3]. In this research project, this set of techniques will be used to visualize the various links associated with the use of the term “walkability”. It will also be used to estimate the volume of academic research related to the use of the term within a time frame. Further, it will be utilized to see the links between the connected fields and disciplines. Various trends and directions can be observed when enough data is collected and analyzed. A more detailed bibliometric study has been done by [4] focusing on “neighbourhood walkability” and using more in-depth measures to arrive at certain standardized measures of bibliometrics. The analyses were made using data from two major online science databases. The first user is the ISI (Institute for Scientific Information) Web of Science database and the other is the Elsevier’s Scopus database. [2]. The google scholar search engine was also used to search for various articles related to the topic. Due to the vastly different indexing style used by Google scholar [2], none of the data from it was used in the visuals included (here) in this paper. The data collected was sorted and converted to various formats using the “BIBexcel” software. The primary analyses are visualized using two specialised open-source software for network analyses and visualization namely Gephi and VOSviewer. These aid in clarifying the relationships between the nodes and edges within a network and can help if further analytics are needed such as centrality, modularity etc.For each of the databases, three (3) sets of keywords or search term combinations are used in the search engines. This is to highlight the general theme of the research which focuses on the contextual determinations and definitions of walkability specifically in Urban design studies. The primary search term and keyword is “walkability”. The second set of search terms include the word “urban” pedestrian movement and any of “urban form” “Street network”. The third search term keyword is “pedestrian” specifically looking out for “pedestrian perception” or “behaviour” step process is used to reflect the main the aims of this research which is to expand the scope and understanding of how pedestrians relate to their environment within the purview of “walkability” as a concept revolving around the walking preferences and walking habits.When the term “walkability” is searched on the ISI database, a total of 1,816 publications appear. These are from all fields and all collections on the ISI database. When the search results are sorted further to include only publications within the relevant fields of urban studies, geography, public and environmental health Architecture and transportation. The total number of entries to about 985 publications. The bulk of the publications that use the term walkability are from public health-related studies [4] even though it is not surprising as these disciplines popularized and likely initiated it [5]. The citation data from the first 500 articles was retrieved.
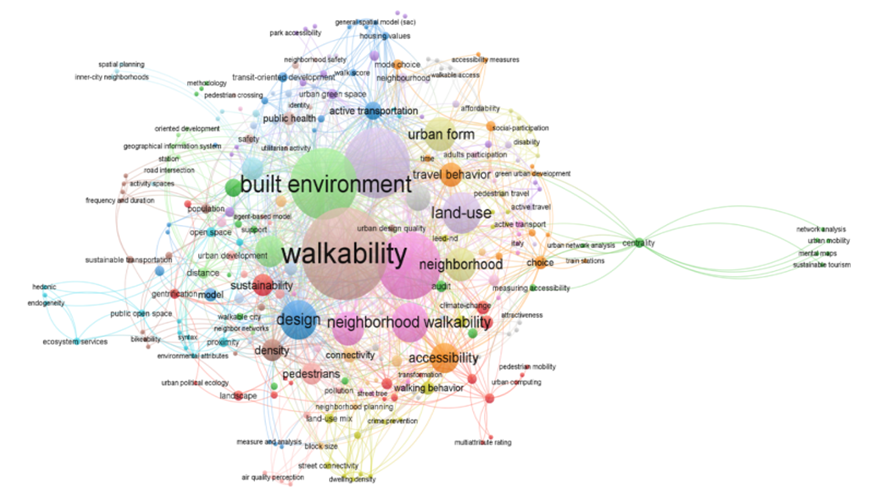 | Figure 1. Frequency of walkability keywords in fields of urban studies, geography, public and environmental health Architecture and transportation |
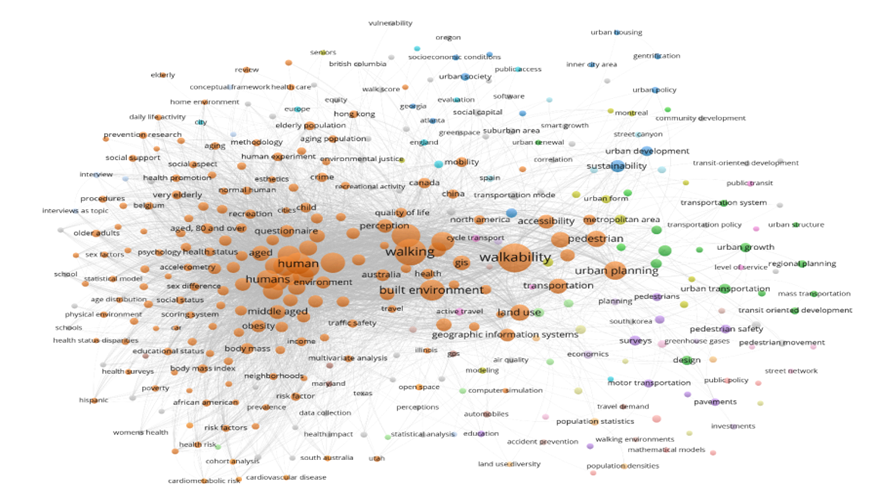 | Figure 2. Represents the ‘co-occurrence’ from the data set retrieved from the Scopus database using three main keywords |
3. Theory of Walkability
- In Figure 3 as illustrated by [4], each of the research areas or disciplines can be taken to be an independent context on its own. The research within these contexts has its own unique peculiarities and considerations. The peculiarities of disciplines include the general themes associated with the studies like aims, tools, theories and hypotheses. The health-related fields have long-established convincing links between walkability and the health of various groups of individuals [6], [10], [11] etc. Other fields like sociology and demography hover around the interactions associated with walkable places [12]–[14] and the socio-economic benefits that arise as result thereof. These two essential precepts paved the way for theories in other fields such as Urban studies and to an extent Architecture in order to explore this perceivable construct of the built environment. The exploration within these fields has been to understand, measure, replicate, generate “walkability” [15]–[19] etc. The amount of connectivity and knowledge sharing among the research areas and contexts is bound to increase as the relevance of the other parallel research areas does.
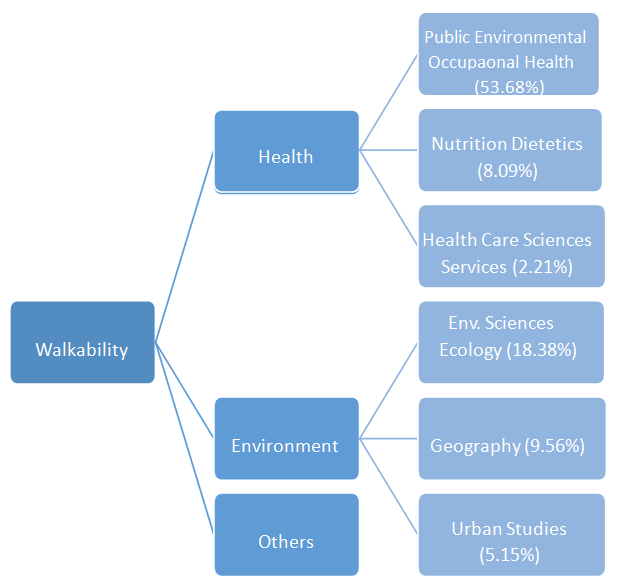 | Figure 3. Walkability Research areas [4] |
3.1. The Walkable Environment
- “Walkability and the walkable city” may have appeared in modern literature as an offshoot of the movement towards healthy wellbeing, a sustainable and eco-friendly environment, so much so they’ve become movements of their own. The walkable environment is argued for from many perspectives. There are various benefits of walking – physical health benefits, psychological benefits, social benefits, etc. In promoting walking, much of the focus, especially in the studies initiated from the field of health sciences, has been on its nature as a physical activity and its potential health benefits. The other main aspect of the study of walkable environments has to do with the environment itself and its own capacity to nurture beneficial walking. Thus, walkability.A major observable attribute of walkability is that different environments support different kinds of walking. To analyze the “walkability” of this environment it may be pertinent to also analyze the types of walking that takes place within this setting [5]. Thus, it is pertinent to also highlight the various definitions of walking. What are the main attributes of walking within environments with minimal walking incentives? How does this relate to purpose defined or purpose-driven walks?The multiplicity of definitions used typically create the methods and approaches used to analyze the subject matter. Contexts often determine the definitions adopted. Research into the term walkability from different fields and within different contexts has led to the emergence of many variables, their definitions and resulting methodologies.
3.2. Walking
- Walking can be understood as the first means of transport for humans. Walking is as an aesthetic and insightful mode of interaction with spaces and the urban environment in general [20]. The nature and scope of walking as an experience of daily life can serve to highlight the importance of walking as a measurement of the experience of both urban and interior space quality [21]. Walkability studies encourage designers and policymakers to be conscious of this fact. Walking is mentioned not just as a means of transport as most assume today but as a part of our nature and tools of observation and sensibility.Aspects and attributes of walking when expounded on give a global image of its significance. Amongst the most telling attributes of Walking is that it is a practice, that induces a sense of place [22]–[25]. Walking can be explored both as purposeful activity and as a creative and critical spatial practice. It has Purposive, discursive and conceptual attributes. It entails temporal and cognitive practices that characterize urban places. Walking could also be defined as a habit, an activity done without much thought given to it. That it’s a habit means it is that constantly repeated, with or without conscious effort. It is also instinct, done with no ''conscious attention'', making it an intuitive response to the environment and urban space. That it is a “natural” instinct means that we are not induced to walk by some artificially acquired response to a stimulus. Rather walking is unique in its specificity to each individual, in its timing gait and grace, and in this uniqueness is the response to the environment.Walking is also a sensory means or process of deciphering the environment. This sensitivity is a lifeworld activity, an activity that is a subconscious tool of empirical observation. The idea of purposive sensibility is arrived at. It is a means through which other ends are met, it is purposive or defined by its purpose. This can be observed in the subtle changes in the walking nuances, rhythm and pattern according to the trip purpose. From heavy angry steps to light, calm and timid patterns, that walking is purposive can be observed easily in everyday settings. It also said to entail reflective knowledge as do other life-world and habitual activities, they are subconsciously assimilated without any expectant change or interruption in their rhythm. Walking is as quoted is said to be the optimal way to “explore” and “exploit” the city'' [26], [27]. In reference to the human scale, walking, when compared to driving or mass transit systems lets you connect directly with the environment. The best city experiences are often observed through walking [28]. Walking then is simultaneously “discovering” the environment and “creating” it as well. Walking may be described as Discovery, as every step taken and every corner to be taken sparks a slight curiosity on what lies ahead. It is a constant journey of discovery even if this habitual occurrence takes place within roughly similar settings. It’s a factor that contributes to 'Creating' the rest of the environment as part of a network or continuum. How one walks, especially as observed in crowds or public areas contributes directly to the flow of people and how this walking environment is perceived by others as well it could infer that: i) Walking is an important way of finding out about the city, its comforts and feels ii)The nature of the walking practice affects the pace of life in a city. The nature of walking is influenced by the interaction with other external factors events that we come across in urban environments such as other walking practices or other bodily movements or activities that contrast with our own pace or rhythm. For example, in an instance where a walking person comes across an area of leisure such as a street musical performance or park or simply a place with a multitude of people slowing down and constantly chatting. Walking in spatial design disciplines is most commonly referred to as a means of transportation, or a way of getting through and around. However, it is an essential way of experiencing urban space. Walking is an elemental way of perceiving urban places. Whilst walking, one experiences and learns about places and develops certain feelings and thoughts for and about them.Attributes like imageability are a construct of experience, creation of feeling emotive and cognitive actions and thought. Aesthetic judgements, which form one of the bases of the relationship we have with our environments or places are arrived at mostly through walking within these designed places. While moving through space one unavoidably touches and feels the environment with the entire body. Touch is not simply a 'pressure on the skin' but more generally the contact between the body and its environment'' [20], [29]. This highlights the connections between the walking practice and the ‘walking place’ in terms of certain unique spatial characteristics such as the contexts, geometry, surfaces and general environmental factors such as light and air. All these are based on the conception of touch and other forms of perception, thus making it a major factor in observing or perceiving the walking environment.This process of feeling or sensing urban space is led by the walking practice thus, people can experience certain layouts or urban forms. That walking itself is often subconsciously performed means that the ability to experience urban space is also subconscious. This experienced perception is part of the character of urban places and spaces. Walking as experience is also a means of measuring the enjoyability, livability and imageability of a place. By referring to factors such as How people walk within that space, do they speed up or slow down, walk-in straight lines or curved paths? do they gaze in awe and reverence? The quality of walking can and should be improved through design. Hence, it has a direct connection with the quality, health of an environment and the attachment or relationship with these places.
3.3. Definitions of Walkability
- The definitions of walkability are influenced by the discipline in question and the primary aim of the research. A large part of recent studies on walkability (as a function of the environment) have focused on proving correlations between attributes of the urban environment with the amount of walking through statistical analysis and correlation. There has been consistent difficulty in finding and translating these correlations into applicable policies and steps. This as implied by is due to the lack of enough understanding of the complex relationship between the variables in question. Having recognized this, various studies have tried to decipher which parts of the environment have which sort of effect on the type and amount of our 'walks' and "walking". This is where 'walkability' as the degree and tendency for a specific environment to be walked in, comes in. Various approaches exist to how walkability as a research field or topic is approached. Of the many approaches, some hold the premise that walkability is a measure and quantifiable variable of the environment. [15], [30]–[33] etc. Many others approach the study by both analyzing the environment and the people who walk in this environment [34]–[38] etc. When ‘pre-automobile’ cities and neighbourhoods are taken into consideration, one may find the lifestyle and scale a bit appealing. This general appeal that they may have may come from many the characteristics they inherently possess such as being primarily designed for human locomotion and not vehicular movement. Certainly, the preference for more walkable settings to ‘unwalkable’ ones seems to be something expressed collectively yet unconsciously as part of a 'collective intelligence or consciousness'.Some researchers represent walkability [8] refers to (Leslie et al) as defining walkability as a feature of the environment that supports walking, therefore acting as a “predictor of health”. This definition dictates that the term itself is not an absolute representation of the built environment rather, it summarizes an aspect of the intrinsic qualities within the environment. Therefore, it could possess more other qualities at the same time as being “walkable” depending on the definition adopted. This further gives credence to other arguments that may suggest that “it is walkable only when people actually walk in it” rather than when it meets certain environmental criteria that are the result of physical measurements of the environment, specifically pedestrian paths and street networks [39]–[42] etc.
3.4. Extents and Neighborhoods
- Extent denotes boundaries, be they physical communal or social. The neighbourhood is the most common setting of reference with regards to walkability. But how is a neighbourhood defined and based on what parameters? Merriam-Webster dictionary gives a satisfactorily concise yet wanting definition, it defines a neighbourhood as the quality or state of being neighbours; a place or region near; an approximate amount, extent, or degree. Proximity and vicinity appear as key terms in the definition of a neighbourhood. The smallest unit of the neighbourhood is typically defined as an area 5-10-minute walk away from one’s dwelling. And by inference, a 5-10-minute walk at the average human pace amounts to about (0.5 -1) km in any direction. The various connotations of what a neighbourhood is or where its extents can be both a matter of subjective perception and (relatively) objective administrative definitions. The standards and methods used to define and measure the boundaries of the neighbourhood may equally vary depending on the system adopted by the administering authority. Conversely, the construct may also change depending on the general perception of the inhabitants of said neighbourhood [43]–[46]. Neighbourhoods are perceived differently by the inhabitants of such areas. Studies show that the neighbourhood goes beyond administrative definitions, especially because the capacity to calibrate neighbourhoods based on the ‘’experiences and spatial attributes of residences exists [43], [46], [47]. This concept can be related to the phrase ‘possess a certain unity which is quite independent of political boundaries’ in [48]. Neighbourhood social interaction could be measured with an index of perception. of how much social interaction there is among neighbours [44], [48]–[50].Going further back in literature, the neighbourhood could be defined as the unit for town planning, “as a unit of a larger whole and as a distinct entity in itself” [48]. It could also be defined based on certain characteristics depending on its type [51]. The “traditional neighbourhoods” are often characterized by a high level of connectivity accommodating the walking within walk distances to nearly meet the 1/4-mile (≈0.4km) radius. [51]. This high level of connectivity is a direct variable in relation to walkability and social interaction as seen in this statement by ‘the concurrency between physical accessibility and electronic accessibility can produce a global decrease of social integration related to a partial decrease of neighbourhood effects in physical space’. This is also connected to the perceived safety of routes and the neighbourhood in general. The maximum walking boundaries, average walking speeds [52] all help conceptualization neighbourhoods.While neighbourhoods and their walkability or walking-culture can be defined through figurative urban systems, axial maps of the urban network, individual line segments and individual road segments like in [53], inter-neighbourhood connectivity is not very popular in literature probably due to the absence of clear cut and versatile definitions of the term neighbourhood.
4. Walkability in Different Cities
- The importance of local context and the need for researchers to create more localized walkability indices that reflect their specific context is emphasized in the earlier studies [45], [54]–[56]. For different contexts, certain walkability indicators have to be carefully selected and defined. These indicators could then be broken down and compared to other chosen variables.
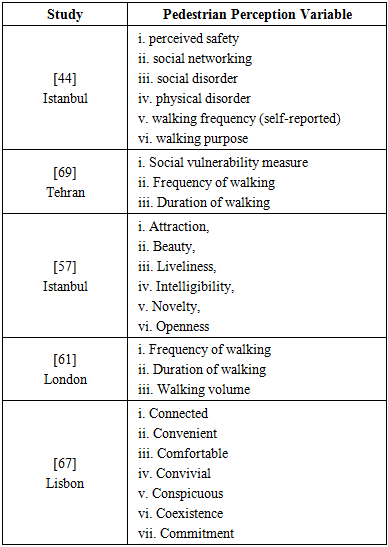
4.1. Istanbul, Turkey
- The historical peninsula of Istanbul could be described as a walkable setting as a great number of the medieval and classical layouts are. These places are best experienced on foot. The diverse settings and layouts around the city provide a fertile context for exploring walkability in terms of users and the physical objective environment. A lot of the studies carried on walking and pedestrian behaviours were done in around these historical regions and the city. Key walkability studies that have parts or the entirety of Istanbul as case study include [57] “Walkability: Perceived and measured qualities in action”, [53] “Defining a strategical framework for urban pedestrianization projects: Assessment of walkability in 3 urban squares in Istanbul”, [16] “Measuring walkability in Istanbul Galata region”, [58] “Modelling walkability: The effects of street design, street-network configuration and land-use on pedestrian movement” and [44] “Walking behaviour in Istanbul: Individual attributes, neighbourhood context and perceived safety”, all of these studies having their unique, fined tuned approaches and perspectives. Here, two of these studies and publications are discussed, summarized and tabulated under the following subheadings; a) Theoretical Premise, b) Case study Area, c) Tools/data used or collected, d) Methodology/steps and finally e) Results. The other listed works are also included in the tabulation. This is to elucidate the diversity of approaches obtainable when studying the subject matter of walkability. The types of variables used in these studies are tabulated under the following: i) Independent Variables ii) Dependent Variables iii) Control Variables. A) “Walkability: Perceived and measured qualities in action” [57]In the paper titled “Walkability: Perceived and measured qualities in action” [57] attempt to find a nexus between perceived and measured qualities or quantities of the environment. Essentially comparing the configurational measures of the environment with the perceivable attributes of this environment. This, as mentioned, is because most walkability studies thus far, centre around measuring the environment. Three case study areas (neighbourhoods or parts of neighbourhoods) were selected. These areas are of similar demographics, socio-economic profiles, transportation links (both public and private) and similar waterfronts. These similarities were intended to have a controlling effect on the other more variant parameters (land use, user profile, recreational qualities).a) Theoretical Premisea. The paper first emphasizes the importance of walking as an integral part of any transport system. Popular studies show that there is a great correlation between the level of walking in an environment and the general health of the populace that live therein [64]–[67] etc. The essential theories tested out here have to do with the objective analyses of the spatial configuration or layout and the ability of pedestrians and users to respond to it. b. The premise is fundamentally rooted in space syntax theory and concept of natural movement potential inherent in (street) networks. The space syntax methodology applied here analyses objectively analyses the context within which this study is carried out. The results from the application of this theory are then juxtaposed with the results from an exercise focusing on walkability. Specifically focusing on the on human perception while walking through the case study area.b) Methodology The methodology designed has 3 basic aspects. The first perspective adopted is that which involves an observer. This is a fundamental part of empirical research. Secondly, an objective analysis is carried out using the space syntax methodology. Thirdly, questionnaires are handed out to users to estimate or measure their perception of the environment. The first step, the pedestrian observation exercise is essentially a counting and sorting exercise. These observations are carried out to highlight several things example: Movement patterns, pedestrian categories, number or volume of pedestrians, path choices and user types. Several observations points are selected, and pedestrians are recorded according to their directions of movement. The observations are done at specific times of the day to enable easy stratification of the user and activity types. Each point is observed for about 3-5 minutes within certain time frames with 2-hour intervals starting at 08:00 and ending at 20:00. This exercise was done both on a day in the week and a day at the weekend. This allows for one to estimate the user activities i.e. recreation, commute or work. Finally, the observable number of pedestrians are noted and sorted. The second step involves the use of the space syntax methodology for spatial analyses. Using the road centerlines of the Istanbul metropolitan area generated by the municipality, pedestrian-only connections are included to have a more accurate representation of the pedestrian network. An angular segment analysis was done to calculate both global and local measures. The global measures better represent integration and choice as characteristics of the case study areas. Thirdly, user perception analyses was conducted using questionnaires that adopt the “semantic differential scale”. This scale is relatively easy to use thus a high literacy level is not needed. This ease allows it to be administered quickly. 25 pairs of polar adjectives were selected, and 7 units were assigned between these polar opposites ranging from “extremely (3)” through “neither (0)” all the way to the negative scale represented as “extremely (-3)”. At least 10 of these questionnaires were administered at each observation point. The subjects were then asked to fill in the feelings they had towards the exact place where they were interviewed. The results of the questionnaires were then sorted and analyzed using the SPSS software to identify any correlated variables using factor analysis. The factor analyses resulted in 6 factors grouping the initial 25 variables. The six (6) factors are listed as Attraction, Beauty, Liveliness, Intelligibility, Novelty, and Openness.c) Results a. All the results of the three case study areas were examined and compared using statistical methods that focus on detecting correlations between the various variables. In the case study areas, Bakırköy and Kadıköy show a relatively strong correlation between pedestrian movement levels and spatial values. While the correlation is not as significant in Beşiktaş. In Beşiktaş, the spatial layout appears to prioritize vehicular traffic. Therefore, the streets with the highest integration values are the arterial roads while the inner roads have higher volumes of pedestrians. These inner routes have a comparatively lower choice and integration values. Amongst other perceived variables, “liveliness” showed significant relations with the levels of pedestrian movement in Kadıköy and Bakırköy areas. Lastly, an important observation is made with regards to the relationship between perceived intelligibility and integration. This strong relationship is in tandem with the theory that the perception of users is correlated with objectively measured spatial intelligibility. B) “Walking behaviour in Istanbul: Individual attributes, neighbourhood context and perceived safety” [44]The publication “Walking behaviour in Istanbul: Individual attributes, neighbourhood context and perceived safety” [44] primarily focusses on the socio-ecological perspective of walking (both utilitarian and recreational). The theory propounds that the social and the built environment act in tandem to influence the walking behaviour within a context. The research attempts to provide an alternate and diverse contribution to the literature on walking behaviour by conducting research in a different context. Citing that most studies conducted and results returned have been those in and from developed countries [44] highlight the need for more work in other countries. The study builds on data from a study measuring the quality of urban life in Istanbul funded by Istanbul Technical University and the strategic planning unit of Istanbul Municipality.a) Theoretical PremiseThe paper critically examines the influence of ‘context’ on walking behaviour. It highlights that the features which promote walking vary with regards to the type of walking, be it utilitarian, recreational, or even in more specific terms restorative as propounded in existing literature [29], [59], [60]. The theoretical framework builds on the socio-ecological model (SEM) and narrows it down to a neighbourhood or micro-level in order to develop an aggregate of the general nuances of user behaviours across the neighbourhoods of Istanbul. It then juxtaposes this SEM approach with a parallel approach that adopts the built environment as a primary frame of reference for walkability and walking behaviour. The theoretical framework adopted focuses on the situational characteristics in the case study area that may enable crime and disorder. Others such as psychological, sociodemographic, environmental factors are also considered.b) Methodology a. The conceptual framework guiding the methodology is designed to test the various hypotheses propounded regarding the relationship between the variables. The primary hypothesis being that individual characteristics, gender, age, BMI, education, employment status, in conjunction with contextual attributes like safety or social interaction and microecological variables such as social or physical disorder or liveliness affect the kind, frequency, and extent of walking carried out. The main dependent variables depict walking behaviour and were examined using interviews and questionnaires. The walking behaviour is sorted into two types type 1 is utilitarian walking and type 2 is recreational walking. these two options are further stratified into two subtypes. Utilitarian walking is classed as “walking for a visit” or to “shop” while the recreational walking is subcategorized as walking “to a park” or for “exercise”. A yes is denoted as 1 and No as 0. The responses are in three forms, no walking (utilitarian/recreational), one-utilitarian/recreational walking and two-utilitarian/ recreational walking. With “Two” representing having walked for both purposes within the past week.b. To establish the hypothesized relationship between the aforementioned variables a number of statistical models are used. A multinomial logistic regression model is applied to ascertain which variables increase or decrease the likelihood of either recreational or utilitarian walking. The model uses a value of 1.0 to represent the exponentiated regression parameter that neither increases nor decreases the likelihood of walking as a result of a unit change in the variable. Values below 1.0 represent a decrease in the likelihood of walking, values above 1.0 denote an increase in the odds of walking. A value of zero represents no walking. Four different regression models were developed for the two types of walking studied. The first model takes into account only the dependent variables and the individual-level variables. The second model compares both the contextual and individual-level variables and the third makes use of all variables. The final model is a ‘reduced’ model which includes only the independent variables that have a high prediction factor of the outcomes. The two possible inputs (One/two) for both types of walking (Utilitarian/recreational) are incorporated into the equation albeit with separate estimates. This is done using a multinomial regression procedure. And it applies across both utilitarian and recreational walking resulting in a total of 8 separate models.c) Results a. The results from all the four models for each walking type are tabulated differently to provide and a step by step understanding of the varied situations. Under the precept of utilitarian walking, the first model which only takes into consideration individual-level variables is term “model U-I”. Model U-I stipulates that females are 68% more likely to respond that they walk either for a visit or to shop compared to not walking for these purposes. Females are also shown to be 48.9% more likely to engage in both purpose-driven walks. It also shows that the likelihood of engaging in (reported) utilitarian walking increases as the level of education of the respondent increases. Conversely, as the income of a respondent increases the likelihood of the respondent walking for these two purposes declines. While the older the respondent the less likelihood of walking for utilitarian purposes, the retired respondents were engaged in more reported walking.b. The second model, model U-II which includes both individual and contextual variables attempts to show what effects the neighbourhood and micro-environment may have on walking behaviour. The first observation is that perceived safety is correlated with high reported walking. The chances of utilitarian walking increase by 39% as the neighbourhoods perceived safety increases. This equally allows for an increase in social networking (about 69%). Busy, crowded places also appear to encourage walking while the lack of maintenance and other forms of physical disorder may deter it. Curiously, a degree of social discord seems to support either or but not types of utilitarian walking. c. The third model incorporates the various control variables that may also tacitly influence walking. the introduction of these control variables has a relatively low effect on the parameters in general. Residential density appears to be the only category that increases the chances of walking (30%) while the other categories did not have much effect. Indices like access to public transport, land value, number of cars per household, and satisfaction with the living areas all did not sway the measures in any direction. The perception that an area “is not good for walking” did have a noticeable effect with a 20% reduction in the likelihood of walking. the shows that the effects exhibited by the individual level and contextual level variables are independent of the control measures.d. The fourth model sifts through and includes only variables with a statistically significant influence on all the stated types of utilitarian walking. The results gotten from this model appeared to support the findings and predictive strength of the earlier models. In summary, utilitarian walking is affected by the variables listed. Amongst the individual-level variables, retirement, gender, education appear to have significant effects on walking. Age and income inversely affect walking while body mass index doesn’t have any effect on the tendency for utilitarian walking.e. With regards to recreational walking, the first model presented results quite different from the model U-I. In the model R-I gender, age and BMI did not present any correlations or relations with recreational walking. Education, however, plays a significant role in the tendency for recreational walking with a unit increase causing a 26% and 57% rise in the two types of recreational walking highlighted. The effect of income level is one-sided, only affecting the tendency or frequency of walking to the park. The likelihood of recreational walking (both types) by retirees also reduces by 63%.f. The Model R-II includes the contextual level variables into the equation. This model does not show varied solutions when compared to the earlier model. Likewise, the inclusion of vibrant social networks does not sway the model in any direction. As for the micro-environmental variables, liveliness doesn’t affect the predictive capacity of the model while the level of physical disorder or lack of maintenance reduces the chances of the two facets of recreational walking.g. The third model which accounts for the control variables shows the same characteristics generally. The most significant changes occur under two variables. How a perceptively busy place increases the chances of (type 1 recreational) walking by 11%. The amount of physical disorder becomes less significant in this model, unlike in the preceding one. The number of cars (per household) decreases the propensity for recreational walking. While the level of expressed satisfaction is directionally proportional to the amount of reported walking. A unit increase in satisfaction increases the chances of recreational walking by 7.5% and 10% for types one and two respectively. The other significant variable is the reported perception of “how walkable a place is”. This perception appears to be the most significant correlate of reported walking, increasing the tendency to walk by 42%. Lastly, density, transport systems and land value do not affect this particular model.h. The reduced model for the recreational walking one and two presented only two noteworthy changes to the preceding model. The significance of satisfaction to the predictive capacity drops to almost nothing. The effect of the conception that it’s a “good place to walk” also reduces but marginally (from 42% to 41%).Summarily, the study supports a number of initial hypotheses relating to the factors that affect walking and the tendency to walk. It also provides further evidence to support some foundational techniques in studying walking. First amongst these is the need to separately analyze the types of walking carried out in an environment and their corresponding peculiarities. The idea of “safety” appears to the most significant factor for both types (potentially all types) of walking. The perception that a context is a good place to walk is also important in the amount of walking that takes place there. Satisfaction seems to be an important factor for recreational walking and not as weighty with regards to utilitarian walking. Lastly, the understanding of the general walking habits and tendency are greatly linked to individual, social and contextual attributes.
4.2. London, England
- London the capital of the UK is one of the oldest cities in the world. Its cultural economic and historical significance cannot be overstated therefore studies conducted therein would be good as case studies for other cities. The walkability and pedestrian-oriented transport studies in London have led to various attempts by the government to apply the findings and develop walkability plans and frameworks. A) “A novel walkability index for London predicts walking time in adults ” [61]The study “A novel walkability index for London predicts walking time in adults” [61] (Stockton et al., 2016) applies indices that were not developed within the European city context. Using existing data from the Whitehall II Study, walkability indices and measurements are applied and developed to fit into the neighbourhoods involved in the study. It considers the urban form of London and proposes that based on its unique environmental features it will register a distinct result on the walkability index.a) Theoretical Premisea. The study essentially observes and compares the neighbourhood walkability as objectively measured and the time spent walking from respondents who were part of the Whitehall II study. Proposing that there would be a correlation between an objective measurement of the environment and self-reported walking. The expected correlation will serve as a means to test the objective measure, while not in any way proving a causal relationship. The core components of the walkability index adopted here are Land Use mix, Street Connectivity and Residential Density. b. Street Connectivity refers to the ‘feasibility’ of walking. This feasibility can be paralleled with the term “Traversable ” as used in [63] and refers to the number of street intersections or junctions within a street network. Land use mix is calculated as entropy within the system and refers to the diversity of land-uses within a catchment area.b) Methodology a. The study begins by taking a sample from phase 7 of the Whitehall II study, specifically those that provided useable postcodes. Firstly, the walking volume was derived from a section of the questionnaire focusing on physical activity, namely walking. The questionnaire posed a question that inquired about the frequency and duration of walking over a four-week period. A variable constituting the outcome of being in the top tertile of the study for time spent walking per week was then constructed. The Neighborhoods of the participants were then operationalized as census area statistics wards (CAS) because these administrative units are relatively uniform in size and extent from home or starting destinations. The use of such administrative are better than circular or network buffers like highlighted in [50]. The walkability index was constructed using measurements of residential density, Street connectivity and Land use. The walkability index or measure for this study was derived from the scores of all the wards within the larger city of London that had participants in the survey as residents. The neighbourhood walkability, on the other hand, was evaluated using Geographical Information Systems software. The residential density was enumerated as the number of occupied households in a particular ward as found in the census data, divided by the area of land designated as residential within the administrative unit in a land-use mapping database. The residential densities were then organized into deciles (groups of ten) where wards scoring 10 have the highest densities and wards scoring 1 the lowest. The Street connectivity is taken as the number of three-way or more junctions (intersections) as found on both the road and urban paths networks in a ward divided by the total area of that ward. As done with residential densities the street connectivity scores were divided into ten groups (deciles). The Land-use mix is calculated as an entropy measure for each ward or neighbourhood. This was calculated based on the earlier used approach such as the formula in [64], [65]. The four categories of Land use used in deriving the measure are “Residential”, “Retail” “Offices”, “Health, welfare and community”. These are regarded as destinations potentially reached by foot. The entropy scores arrived at were then recoded as deciles. The component measures (Residential density, Connectivity, Land use mix) of the walkability index represented as deciles, were then summed up to arrive at walkability scores for each ward. The sums were then recoded into quartiles, resulting in a scale from 1 to 4. 1 indicating the lowest walkability relative to other wards while 4 indicates the highest walkability. The walkability score of each ward was then assigned to each respondent) that resides within the ward. Therefore, each participant had a walkability score that corresponds to the given address or postcode. A Multivariate logistic regression was done to evaluate the relationships between walkability and (self-reported) walking. The second stage, tagged Model 2, was adjusted to accommodate respondent level sociodemographic factors. These respondent level variables were sex, age, ethnicity, marital status, marital status, economic activity and car availability. The third stage, Model 3, was adjusted for area deprivation in addition to the other variables. The results were then calculated as odds ratios with 95% confidence intervals. Statistical tests were carried out to detect any trends or general patterns within the relationships between walkability and Walking.c) Results a. A Spatial variation map illustrates the decile scores across the wards. The decile scores show a radial decay or depreciation in the walkability measure from the city centre to its periphery. The correlations of walkability scores between Model 1 and Model 2 and between Model 3 and Model 2 were higher than the relation between Model 3 and Model 1. Amongst the participants, 38% resided in areas with the lowest walkability score i.e. within the quartile with a score of 1. The areas with the highest walkability scores had the lowest number of participants with only 16% with the quartile score of 4. It was found that those respondents who resided in neighbourhoods within the highest walkability quartile were more likely to spend a total of 6 or more hours walking each week. A positive association between walkability and time spent walking per week was confirmed. It goes further to show that even though the walkability index used was developed for non-European contexts can also be applied within a European context such as London. Secondly, a point was made to highlight that due to the high population density in London there is little room for variance amongst the components of the walkability measure. Thus, the deviation from the mean residential density, street connectivity and land use mix in different areas in the city is likely to be lower than for cities with less density. This low variation amongst neighbourhoods may be the reason for the weak association between walkability score and walking time per week as found here compared to the associations found in other studies. This illustrates a distinction between the measures in compact cities and sprawling ones.b. Finally, since the Whitehall II study was not designed as a walkability exercise, trip purposes such as walking for transport or recreation were not highlighted. Another important observation is that the land uses were not weighted in order to reflect their importance or likelihood to induce walking amongst the participants. In order to establish causality between the walkability and walking, the study may need to be redesigned into a longitudinal format. A longitudinal study may show that moving from a less walkable area to a highly walkable one leads to increased walking time and volume. Since the participants were not asked to highlight where they walked, the volume of walking may not be entirely dependent on “neighbourhood exposure”. Lastly, due to the limited demographic of the sample size being comprised of older adults who were employees of the largely same organization. This limits the possibility of drawing generalizations from the findings of this research.
4.3. Tehran, Iran
- A) “Neighborhood Walkability in a City within a Developing Country” [66]Due to a myriad of varying factors, few walkability studies have taken place in cities within developing countries. The approach taken in [66] is amongst the first to analyze walkability from the perspective of a developing country. The research paper uses a previously developed index and adapts to fit the selected context citing the limitations existing due to the lack of both spatial and demographic data in certain urban units. The study takes both an objective (the walkability index) and subjective (self-reported walking and survey) approach and compares them to derive its final conclusions.a) Theoretical Premisea. The paper first distinguishes the approach taken in the fields of public health and urban studies the latter being objective while the former being subjective. The subjective approach entails taking the accounts of the perceptions of users through interviews and surveys. On the other hand, more objective studies rely more on techniques like GIS geographic information systems (ref) audit tools (ref) and even depth map-based analyses. These objective methods have an edge with regards to an error in measurements, standardization, quantification and even application. Due to the advantages of both subjective and objective modes of approach, a number of researchers have recommended using both. The paper adopts this approach by first (objectively) measuring the environment and then comparing the data for self-reported walking from the elderly. The theoretical premise is deeply rooted in the cited literature. It takes the index of “walkability of community neighbourhoods” as developed by [64], [65] and puts it to test within the context of the city of Tehran.b) Methodology a. The methodology adopted by the research is tailored to fit into the context with respect to varying factors like trip purpose or purpose of walking and the availability of data. A key recommendation for the methodology is the use of GIS, it stated that this would reduce the challenges to be faced such as costs and logistics. Amongst the selected criteria for estimating the level of walkability, residential density and land use data were gotten from the statistical centre of Iran and the municipality respectively. The study adopts the administrative concept of a neighbourhood within the context as the spatial boundary. This especially made it convenient for data extraction as there aren’t data sources for other boundaries or small urban scales. The walkability score is gotten by applying the index developed in [65] “walkability = [(2× z-intersection density + (z- net residential density) + (z-retail floor area ratio) + (z- Land use mix)”. Due to the high correlation between intersection density and walking it is given two coefficients. b. To ascertain the veracity of the walkability index, the resulting indices, from all the boundaries within the selected zone, were compared with self-reported walking within the selected target groups. Two scores were obtained from the index, the raw and standardized version. The neighbourhoods were then classified into high, low and medium walkability areas. The other methods adopted to classify the results include natural breaks, geometrical interval and equal interval were used separately. c. The results from geometrical classification were used to further the study as they were abnormal. Approximately half of the people living in this zone presented high social vulnerability. A validation survey was conducted, focusing was on the highest range of diversity for variables that contribute to both social vulnerability and walkability. Four classifications were made as a result, and one neighbourhood put into each category. The following were the categories used, high walkability/high social vulnerability (HW/HSV), high walkability/low social vulnerability (HW/ LSV), low walkability/low social vulnerability (LW/LSV), low walkability/high social vulnerability (LW/HSV).d. Interestingly, no neighbourhood had a high level of walkability and low social vulnerability. Only Neighborhood 9 had the quality of LW/HSV, Neighborhoods 2, 6, and 7 had both LW/LSV. For the Low walkability/low social vulnerability and high walkability/high social vulnerability, a neighbourhood each was selected using random sampling.e. To conduct the validation of the survey neighbourhood 14 was selected. Socio-economic factors that could affect the rate of walking were considered (controlled) in the validation survey. This is because it was derived that neighbourhood 14 was the neighbourhood with medium level social vulnerability. 30 Interviews were then conducted in each selected neighbourhood, the one main question was proposed with regards to the frequency of walking more than 10 minutes in a week. “How many times do you walk?” was asked to the respondents and the answer were grouped into five (a) less than two times; (b) two–five times; (c) six–10 times; (d) more than 10 times. Destination or purpose was not considered in this survey/ interview. c) Results a. Amongst the neighbourhoods, Neighborhood 17 returned the highest walkability index value of 2.95, while neighbourhood 7 had the lowest -4.703. The resulting findings were that there were respondents who lived in the Neighborhoods 17 did report higher frequency of walking i.e. more than six times a week. When the walkability index is compared to the reported walking a great deal of correlation is apparent. Of the two neighbourhoods with the highest reported walking, neighbourhoods 17 and 14, one has a higher level of social vulnerability and the other has a low social vulnerability. However, neighbourhoods 9,6,7 with low walkability have most respondents reporting that they walked between 2 and 5 times a week.b. The study found that the amount of walking is influenced by the level of the walkability of neighborhoods (while still considering the social factors like social vulnerability and socio-economic status). Summarily, the elderly who lived in neighbourhoods with higher walkability indices walked more frequently than those in other neighbourhoods. This is regardless of the socioeconomic status. The results show, notwithstanding the context (in this case) the built environment does influence the amount of walking taking place therein. Some of the challenges faced during the study are hinged on the lack of or insufficiency of valid data. And this is a common occurrence amongst developing countries. Also, since the target group was only the elderly, the results may not be conveniently generalized to refer to all the age groups. The study recommends further research into the roles of each factor within the index and the subjective and objective aspects of walking separately.
4.4. Lisbon, Portugal
- A) “Measuring walkability for distinct pedestrian groups with a participatory assessment method: A case study in Lisbon” [67]This study takes a distinct approach by focusing on the differences in how different pedestrian groups respond to walkability indices as a measure on themselves. It proposes a framework that may be applied in the study of distinct pedestrian groups. The framework is termed “Indicators of Accessibility and Attractiveness of Pedestrian Environments” and abbreviated as IAAPE. The study also adopts an approach that is based on the expertise of local stakeholders who aided in the selection and ranking of indicators. It aims to arrive at strategies that would aid designers and planners alike.a) Theoretical Premisea. The study applies a participatory framework that involves various other professionals and stakeholders. Amongst its primary focus points is the quality of the “pedestrian environment” within the context in question. A primary hypothesis of this study is that walkability itself should not be defined as a universal or single entity. This is because the environmental or objective factors that affect or induce walking will likely differ due to other confounding variables such as pedestrian attributes, trip purpose, urban context and other cultural or environmental characteristics. The study takes as a premise, the proposal of the London Planning Advisory Committee [68] to have a scheme made up 5 component C’s. The study expands this proposal by adding two more C’s to the already well-regarded scheme. The scheme propounds that for a place to be pedestrian-friendly it should be the following:i. Connectedii. Convenientiii. Comfortableiv. Convivialv. ConspicuousIt was observed these variables or features did not capture some attractiveness-related attributes of the built environment. “Commitment” and “Coexistence” were then added to compliment the earlier components of the layout.Connected refers to the strength of linkages between trip origins and destinations within the pedestrian network as well as the links between the routes themselves. Convenient refers to the likelihood of choosing to walk due to its efficiency, induced by the accessibility of functions, facilities and land uses within an area. Comfortable means the extent to which the capabilities and peculiarities of all pedestrian groups are accommodated to provide for smooth walking. Convivial could be defined as how pleasant or not taking a walk is in terms of social interaction, natural and built and environment, and activities. Conspicuous refers to legibility, discernibility and it gauges how clear and attractive the walking routes are. It highlights spatial complexity and coherence. The two additional C’s provide a nuanced peek into the holistic perception of the walking environment by the pedestrian. Coexistence describes the extent to which the transport modes are synergized to function and coexist efficiently without compromising the place of the pedestrian. Commitment can be best described as the level of agency, responsibility and liability towards the pedestrian environment. The paper highlights three general approaches used to assess pedestrian perceptions prior to comparing them with objectively derived walkability measures and scores. The listed methods include pedestrian counts, Street surveys and Home-based surveys. b) Methodology a. The methodology in the IAAPE framework as applied in this study is summarized in 6 steps: i. Case Study characterization: Characterization stage involves the operationalization and definition of terms used in the objective analysis of the environment. At this stage, a scope and scale for the environmental analysis are selected. Secondly the availability of digitized data such as land uses, pedestrian paths network and pedestrian volumes, were assessed also to evaluate the resources needed for the evaluation.ii. Structuring the evaluation: the structuring phase entails determining the key concerns for each pedestrian group in the analysis as well as their trip motives. This was done through interviews with relevant stakeholders representing each pedestrian group. These key concerns are related to the environmental factors that are most relevant to each class of pedestrians. Representatives from each group of pedestrians were asked to select and rank the key concerns that were most relevant to them. The most relevant key concern under each dimension (the 7C’s) was weighted based on its relevance to the group that selected it and their trip purposes. A parallel panel of experts provided a second key concern. iii. Scoring key-concerns and selecting indicators: The stakeholders at the panel session were tested using decision-making software to analyze their preferences or inclinations towards one key concern or the other. Each pedestrian group selected and weighted distinct key concerns for each trip purpose. Further supporting the view that different pedestrian groups should be evaluated differently. Several indicators were selected to measure each key concern. iv. Data collection and indicators’ evaluation: A pedestrian network was created and stored on a GIS platform. The variety and features of walkways available within the case study area were digitized using a detailed topographic map in the scale of 1:1000. Features of the pedestrian pathways were classified into sidewalk, crosswalk, stairs and underpass. Relevant indicators were referred to as ‘attributes’ used in the GIS network analysis. This GIS was primarily used as a tool to analyze the walkway or pedestrian network in order to express Connectivity key concern. v. Assembling walkability scores: this stage refers to the compilation of all collected and generated data. The first step adopted here was to normalize the indicators converting the qualitative scale into a quantitative one ranging from 0-100. Some other indicators were adjusted to reflect the minimum and maximum values such as sidewalk width in reference to the mobility impaired pedestrians. The normalized indicators were then merged into a single walkability score using a derived formula. The score arrived at reflected the individual walkability measure of each pedestrian designations.vi. Validation: the validation is necessary to assess the veracity of the approach. The Validation was done by comparing the results with actual pedestrian perception for any correspondence. Firstly, the panel of stakeholders was asked to rank a set of selected streets from worst to best. Their responses were then compared to the results of the IAAPE framework. Equally, Street surveys and home-based surveys provide a well-rounded pedestrian perception of the walkability of the streets they use and those around them.c) Results a. The results of the pedestrian determined rating exercise presented deep data that give a glimpse into the necessity of analyzing walking with the different end users as central points of reference. There were differences in how the different groups rated and responded to key-concerns across trip the purposes. To maintain the relative nature of how the distinct groups responded, the key indicators as stated earlier were weighted respectively and then aggregated into a single walkability score per pedestrian type per district, street and street segment.b. In District 1, Gulbenkian, the scores for both utilitarian and leisure or recreational walking did not record any impactful differences for Adults and the Mobility impaired pedestrian groups. In the case of these two groups, the weights added for the key concerns did not reflect on the results. For the children’s group, the level of walkability drops from the very good index to the intermediate. This was indicative of the relative importance of the dimensions as determined by the pedestrian group. For utilitarian walking, the children pedestrian group seems to weigh more on connectivity than convenience. The inverse is the case for leisure or recreational trips, where convenience is of the highest priority. This tradeoff is between the diversity of land uses and the “directness” or distance along the path or route. on leisure trips, the children pedestrian group favours conviviality over coexistence (the opposite being the case for utilitarian walks). The senior’s category had similar responses albeit with a lower variation. Summarily, the Adult category rated 50% of the pedestrian network as having good walkability. The children’s category reported 60% of the pedestrian network to have good walkability and intermediate for utilitarian and leisure walks respectively. Seniors rated the over 60% of the network as having less than satisfactory walkability with scores ranging from the intermediate to poor. The Mobility impaired pedestrians rated roughly 50% of the pedestrian network very poor on their own scales. It was noticed that as mobility amongst the users decreased the walkability score gotten also declined. District 2 recorded lower scores for almost all parameters. The Adults pedestrian category scoring of the district dropped from a ‘very good’ to intermediate and for the children from intermediate to poor. The change for the Senior pedestrians was less noticeable while the low grade from the mobility impaired was significantly higher (74% of the network scoring very poor). c. In conclusion, Adults who had no walking impairments (e.g. healthy, fit) perceived walkability quite differently from the senior citizens. Comparatively, District 1 had higher walkability scores for each pedestrian group than District 2. Pavement quality was identified as the most important factor for those with impaired mobility. The analysis also supports the use of the pedestrian path or network itself to get more relatable frames of references for pedestrian perception. The study also suggests that subsequent more detailed studies include the “cost per walkability parameter score”. The steps and procedure highlighted may be adopted to determine the networks and streets for interventions.
|
5. Conclusions
- This section summarizes the variables and parameters as found in the cited examples from different contexts. Variables are proposed as a result of the synthesis of the context, the adopted definitions and the aims of the research. Some environmental measures of connectivity have been highlighted by [58] listed as follows; Block length, Block size, Intersection density [70] and Street density. Other major concepts and terms researched about walkability in and around the neighbourhood are [58].- street design- street-network configuration- land-usesThe These are as described by [71] and as quoted by [69] are the main built environment measures relating to walkability and have been widely seen in “conceptual and empirical literature” [71].These descriptions could be classified in general terms under [70]‘s 3Ds namely, Density Diversity and Design. ‘Street design’ could be placed under Design, interestingly ‘street-network configuration’ could be placed under both diversity and density, while land- use or land use mix is directly concurrent with Diversity. Below is a brief explanation of these terms as factors in the cited literature.
|
|