-
Paper Information
- Paper Submission
-
Journal Information
- About This Journal
- Editorial Board
- Current Issue
- Archive
- Author Guidelines
- Contact Us
Architecture Research
p-ISSN: 2168-507X e-ISSN: 2168-5088
2020; 10(1): 1-14
doi:10.5923/j.arch.20201001.01

Self-Shading Walls to Improve Environmental Performance in Desert Buildings
 Abstract
 Reference
 Full-Text PDF
 Full-text HTML
Merhan M. Shahda
Architecture and Urban Planning Department, Faculty of Engineering, Port-Said University, Port Said, Egypt
Correspondence to: Merhan M. Shahda, Architecture and Urban Planning Department, Faculty of Engineering, Port-Said University, Port Said, Egypt.
| Email: |  |
Copyright © 2020 The Author(s). Published by Scientific & Academic Publishing.
This work is licensed under the Creative Commons Attribution International License (CC BY).
http://creativecommons.org/licenses/by/4.0/

The self-shading of the walls reduces the temperature of the surface exposed to direct sunlight, thereby reducing the amount of heat transmitted through them. This feature presents a solution rendered by nature to reduce temperature in hot areas, the fact that inspires the possibility of reducing building temperature and thus reducing energy consumption used in cooling. Therefore, the study aims to present proposals to create shadows on opaque solid walls, as the walls represent the largest area exposed to solar radiation, in order to improve the thermal performance inside buildings. Accordingly, the study was divided into three parts. Firstly: analyzing the principle of self-shading in nature and understanding the bases of thermal transfer. Secondly: devising an idea to achieve self-shading of the walls with the lowest costs and affordable materials to facilitate the application of the idea in developing countries. Thirdly: propose alternatives to self-shading walls using bricks as a building material and evaluate these alternatives using simulation programs. The first proposed pattern: Vertical Protruding Ribs, the second proposed pattern: Horizontal Protruding Ribs, the third proposed pattern: Staggered Protruding Brick Molds. In addition, the study presented a base case model without protrusions to compare with, to facilitate the assessment of the impact of self-shading on raising the efficiency of thermal performance within the spaces. Consequently, after the stage of analysis and results, the study has reached, through simulation tests, that alternatives succeeded in reducing the outer surface temperature, ∆ 𝑇, Ext Sunlit, and Solar Incident compared to the base case. Moreover, the Horizontal Protruding Ribs achieved the best results.
Keywords: Self-Shading, Brick, Geometric Patterns, Environmental Performance, Desert Buildings, Orientation
Cite this paper: Merhan M. Shahda, Self-Shading Walls to Improve Environmental Performance in Desert Buildings, Architecture Research, Vol. 10 No. 1, 2020, pp. 1-14. doi: 10.5923/j.arch.20201001.01.
Article Outline
1. Introduction
- Hot and arid areas suffer from high temperatures, direct solar radiation, drought, and many difficult climatic conditions, where facades are the primary shield to face climatic conditions. Also, studies have shown that the heat gained through the walls is larger compared to the rest of the building envelope in the desert areas, due to direct sunlight falling on the walls during long periods of the day. Nevertheless, nature can inspire us with outstanding strategies to solve these problems in desert environment and consequently improving the thermal performance of the building, increasing human comfort and decreasing energy consumption in buildings. One of these strategies, is a self-shading strategy that exists in many desert organisms.Shading methods could be considered as one of the most significant passive design strategies. It pursues to block a large amount of direct solar radiation emitted from the sun, to reduce each of the outer surface temperatures, incident solar radiation and the temperature behind the surfaces. It also aims, to reduce heat gained by the walls from solar radiation, which subsequently, reduces the energy consumed in cooling. However, literature review shows that there is a lack of studies on shading the opaque solid walls [1], although the walls represent the largest area of the building envelopes and play an important role in thermal performance within the spaces.Hence, the study assumes that using a shading strategy inspired by nature's solutions on opaque solid walls can reduce the temperature of surfaces which are exposed to direct sunlight, and reduce the amount of heat transferred through the walls, thus achieving thermal comfort for users.
2. Methodology
- The study presents a methodology and assumes that by following this methodology, the objectives of the study could be achieved, and the hypothesis of the study could be proved. Accordingly, the methodology is divided into; Firstly, analyzing the principle of self-shading in nature and understanding the bases of thermal transfer. Secondly: devising an idea to achieve self-shading of walls with the lowest costs and affordable materials to facilitate the application of the idea in developing countries. Thirdly: Proposing alternatives to self-shading walls using bricks as a building material and evaluate these alternatives using simulation programs, to achieve the best proposal that could achieve a decrease in temperature for surfaces exposed to direct sunlight. Thus, reducing the amount of heat transmitted through the walls. Finally, analyzing the results of simulation tests and presenting recommendations.
3. Self-shading Strategy in Nature
- The climate of the desert is arid, not tolerated by man, but the desert organisms can tolerate, and even have the ability to survive and evolve, because desert organisms were created with physical and biological characteristics to withstand the difficult conditions of the desert. In addition, these characteristics help them moderate the difficult conditions of hot and arid zones. As God created man with a mind to inspire from the abilities of these organisms, and find solutions to all his problems [2]. Nature is a set of patterns whose efficacy and viability have been tested over time. For example, cactus and termite settlements are examples of nature's treatment for high temperatures problems in hot and arid zones.Many studies have analyzed the ability of cactus to adapt to high temperatures and solar radiation [3,4]. In addition, some studies mentioned that the cactus surface can provide 16% more shade than on a spherical surface [5], (see figure 1). Lewis and Nobel concluded [6,7] that cactus ribs affect in changing the cactus skin's thermal performance, through shading the exterior surface from sun rays (see figure 2). Cactus' ribs of surface could protect other parts from direct sunlight, this technique called self-shading.
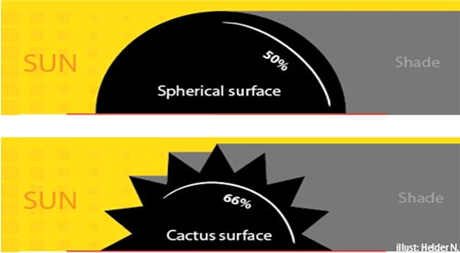 | Figure 1. The cactus surfaces (Source: [8]) |
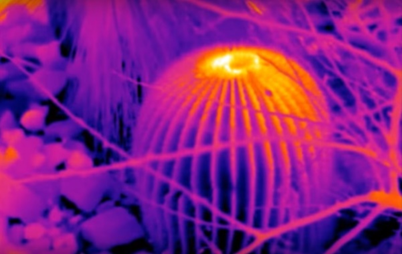 | Figure 2. Infrared image of a cactus shows the ribs with different temperatures (Source: [9]) |
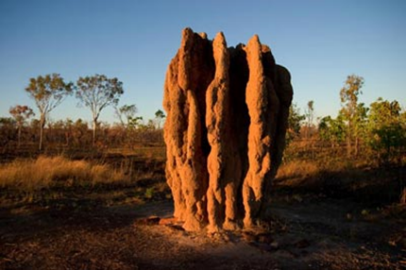 | Figure 3. Habitats of Termite settlements (Source: [11]) |
4. How heat can be transferred?
- Optimum thermal performance in buildings in hot areas can be achieved by reducing heat gain, which in turn reduces cooling requirements and provides thermal comfort to the occupants. Therefore, we must know ways of heat transfer through the elements of the building, especially walls; based on the hypothesis of the study.Heat is transferred from air to the building walls by convective which is created by temperature differences between the wall and air surround the building. The layer near the surface of the wall is different, where heat is transmitted by conduction through layers of air moving parallel to the wall, beside some convection. Moreover, heat is transmitted through building materials by conduction [12,13].The amount of heat transferred through the walls “ φ “ depends on three variables: 1) u-value = the measure of the overall rate of heat transfer, through a particular section of construction, 2) A= wall area, 3) Δ𝑇 = (T1 - T2) = temperature difference on both sides of the wall (facing the environment and the room) at the time of calculating the amount of heat. Hence, thermal transmittance is described by the equation: Φ = A × U × (T1 - T2) ∆ 𝑇. Therefore, to reduce Φ the amount of heat transferred through the same area of the wall could either use materials with a low u value or reduce surface temperature (see figure 4). Thus, when reducing the external surface temperature by shading, Δ𝑇 will decrease. Consequently, the amount of heat transferred to buildings is reduced.
 | Figure 4. The amount of heat transferred through the walls “φ “ |
 | Figure 5. How to improve environmental performance within the spaces and achieve thermal comfort |
5. Walls as One of the Most Important Elements that Affect the Thermal Performance of Buildings
- There are many ways to overcome heat transfer, including using insulation materials, reducing and shading windows, planting and doubling walls, in addition to self-shading. Many studies have examined the shading methods for the building envelope by shading the roof, windows or transparent walls [14-17], in addition to studies on the self-shading of the mass [18]. This is because of the importance of shading in reducing heat gain and preventing direct sunlight. Thus, reducing the amount of energy needed to maintain a comfortable indoor environment relative to the external environment. When an amount of sunlight falls on a wall, one part of that ray is reflected back into the atmosphere while the other part is absorbed and converted into energy. Then the temperature of the outer surface of the wall is raised and heat is transferred to the indoor air of the building. However, Self-Shading Strategy has an impact on preventing direct solar radiation [19]. According to Capeluto [20] Self-Shading geometry forms could provide the best solution for preventing direct solar radiation. Accordingly, the concept of Self-Shading could be achieved through shading devices, building forms, or through creative methods for self-shading. The following are examples of the application of the principle of self-shading walls: 1) Using shoulders of local buildings in Africa - Mosque in Northern Ghana- which mimics the external shape for termite nests to increase the exposed area to cooling and increase the percentage of shading (see figure 6.). 2) 15,300 protruding solar panels act to reflect sun’s heat and give the Madrid’s ‘Distrito C’ a unique aesthetic character (see figure 7.). However, literature review shows that there is a lack of studies on shading the opaque solid walls, although walls represent the largest area of the building envelopes and play an important role in thermal performance within the spaces.
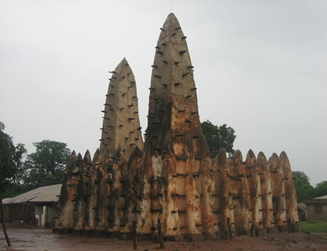 | Figure 6. Mosque in Northern Ghana (Source: [21]) |
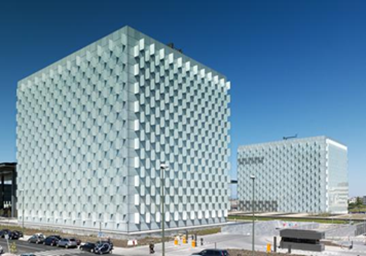 | Figure 7. Madrid's 'Distrito C' Self Shading Solar Office (Source: [22]) |
6. Proposed Architectural Models Using “Self-Shading” Strategy
- Low - income and developing countries in desert areas have a hot and dry climate. Buildings in these areas receive excessive solar radiation that causes high solar heat gain. Accordingly, the study focuses on how to achieve self-shading at the lowest cost through available technologies, until the developing countries can easily apply this idea, to improve the internal environment and reduce energy consumed in cooling. Hence, the study suggests formation through protruding brick molds to achieve Self-Shading, whereas, brick is the main building material which is widely available and affordable in low-income countries.
6.1. Concept of Using Brick Molds in the Application of the Strategy of Self-Shading Walls
- Based on the analysis of self-shading strategy in nature, which was addressed in the previous part, and after studying and analyzing the foundations of heat transfer, as well as the analysis of examples, which applied the idea of self-shading:- The study proposes a simulation of a Self-Shading strategy by using bricks as building material, through creating protrusions by bricks to block the sun, thus shadow is formed. Also, the study suggests that these projections have different geometric patterns in an attempt to achieve maximum shading on the facades. Then the study assesses these patterns to find out which patterns could achieve the largest amount of shading.- Accordingly, the study proposes a room 4 m length dimension - 4 m width - 3 m height. The building material is brick where one wall is under-test. This wall is directed to the east, to the west and then to the south. For evaluation of the results, as the study suggests that the effect of the rest of the room envelope is constant to facilitate the assessment and measure the impact of self-shading on the wall-under-test. - The study proposes three different geometric patterns for the formation by bricks on the wall-under-test and evaluation. The first proposed pattern: Vertical Protruding Ribs. The second proposed pattern: Horizontal Protruding Ribs. The third proposed pattern: Staggered Protruding Brick Molds. In addition, the study presents a model without protrusions to compare with the proposed patterns. In order to facilitate the assessment of the impact of self-shading on raising the efficiency of thermal performance within the spaces, the following is a proposal for how to design geometric patterns using bricks molds.
6.2. How can Brick Molds be Used to Make Projections?
- Brick is a universally recognized building material; there are many types and sizes of bricks. It is known that when brick is used as a building material, it must be laid in a definite pattern or bond so as to be set in consecutive courses.Firstly, to build a course of horizontal protruding ribs, the study proposes the use of the English Bond in the wall with horizontal protrudes whereas the English Bond is formed by laying alternate courses of stretchers and headers (see figure 8.).
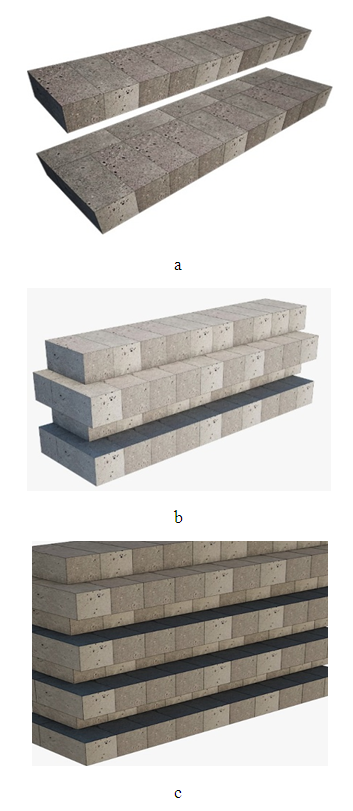 | Figure 8. a) fig. shows course A "odd numbered" and course B "even numbered"; b) fig. shows that bricks laid to a bond so that no vertical joints in consecutive courses are laid above each other. In addition, all odd-numbered courses lay as course A, and all even-numbered courses lay as course B. c) Perspective of the horizontal protruding ribs wall |
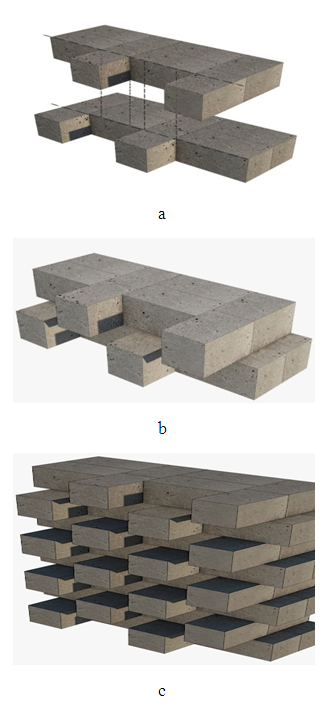 | Figure 9. a) fig. shows course A "odd numbered" and course B "even numbered". b) fig. show that bricks laid to a bond so that no vertical joints in consecutive courses are above each other. In addition, all odd-numbered courses lay as course A, and all even-numbered courses lay as course B. c) Perspective of the staggered protruding wall |
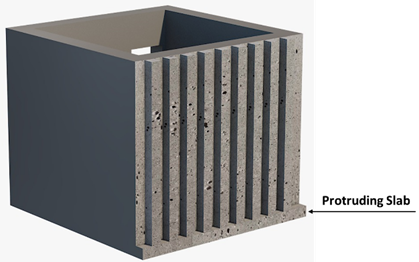 | Figure 10. Shows the protruding slab where molds are laid and loads of the bricks are carried |
6.3. Proposed Geometric Patterns to Achieve Self-Shading Strategy
- Table 1. illustrates the proposed geometric patterns for the formation through bricks to achieve self-shading
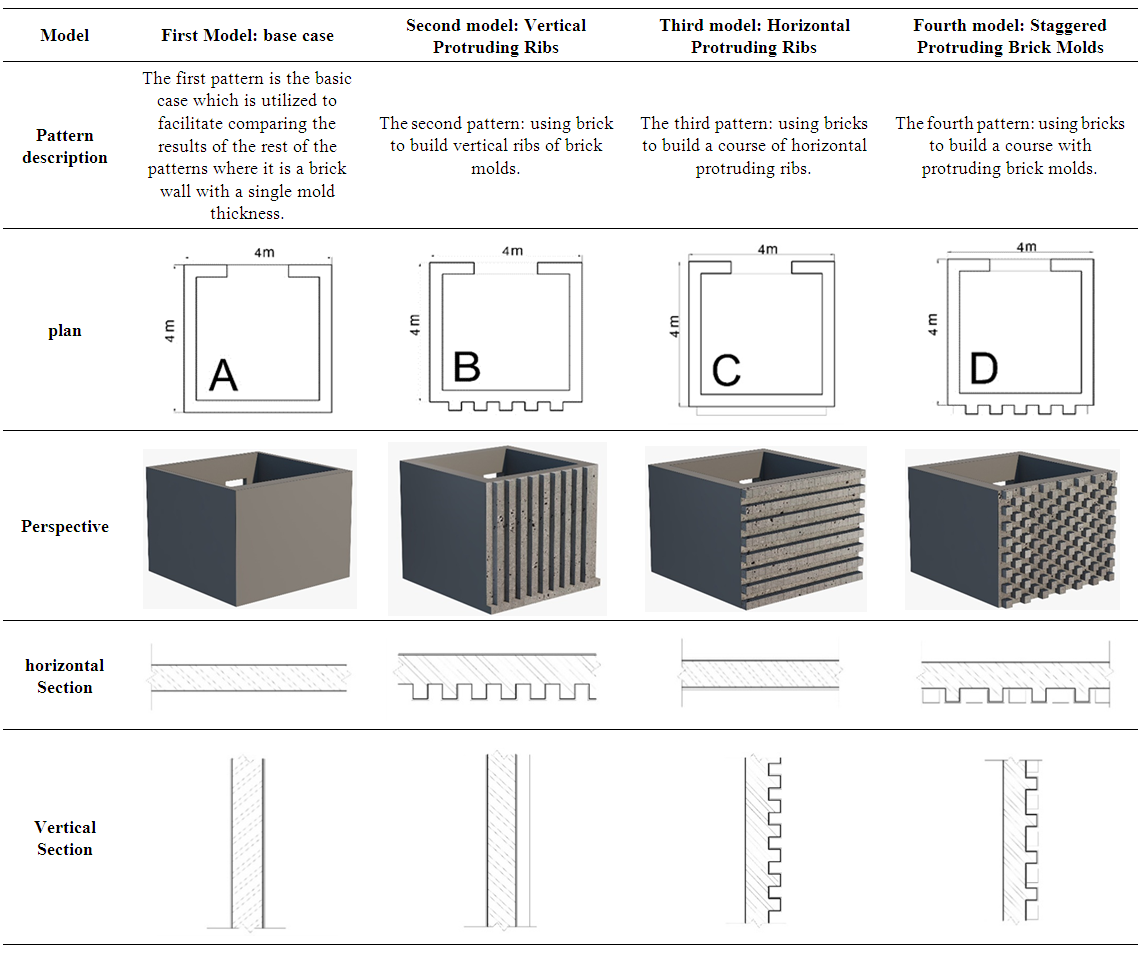 | Table 1. The proposed geometric patterns |
7. Phases of Evaluation of the Proposed Simulation Alternatives Models
- The evaluation phase of the proposed alternatives is divided into 5 stages: 1) Determinants and criteria for evaluation and measurement of proposed alternatives. 2) The results of facing the tested wall to the south orientation. 3) The results of facing the tested wall to the east orientation. 4) The results of facing the tested wall to the west orientation direction. 5) Analyzing the readings.
7.1. Determinants and Criteria for Evaluation and Measurement of Proposed Alternatives "Dimensions of the Space, Guidance and Measurement Elements”
- - The space dimensions 4 m length * 4 m width * 3 m height, the building material is brick, one wall-under-test. Window dimensions: 1.50m (L) *1.40m (W). - When a wall of a certain orientation (south/ east/ west) is tested, only the wall-under-test allows the thermal transfer. The remaining walls are assumed to be adiabatic, to focus on the effect of shading on the wall-under-test; the north wall contains a glass window, Ceiling and Floor: Adiabatic; Non-tested Walls: Adiabatic. - The wall-under-test: brick 20 cm thick, for 1) base case, 2) Horizontal Protruding Ribs, 3) Vertical Protruding Ribs And 4) Staggered Protruding Brick Molds.- A “wall area” is constant in alternatives, also, “u-value” is the measure of the overall rate of heat transfer is constant for the brick wall in all alternatives. Therefore, the study proposes to reduce ∆ 𝑇= the temperature difference between the outer and inner surfaces to measure the effect of self-shading, so as to reduce ∆ 𝑇.- Environmental simulation tests were conducted by using the Design Builder Program, August 1 was selected to test alternatives, Cairo was selected as a place for testing, and the climatic data were obtained through climate files in the Design Builder Program. Figure 11. Shows that the hottest day of the year is August 1.
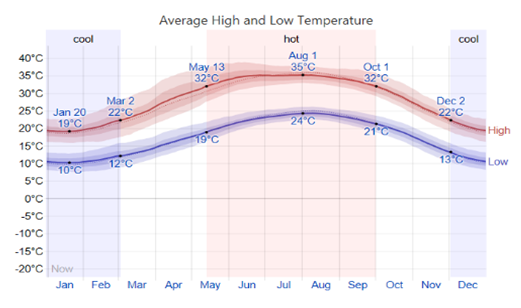 | Figure 11. Average high and low temperature (Source: [23]) |
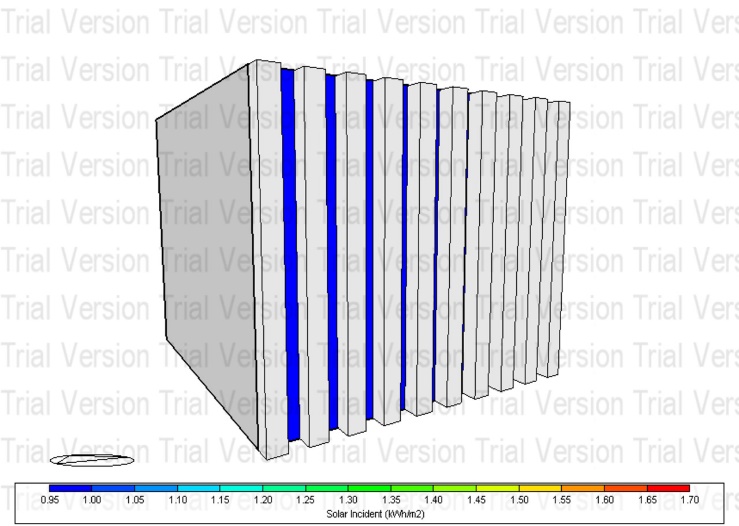
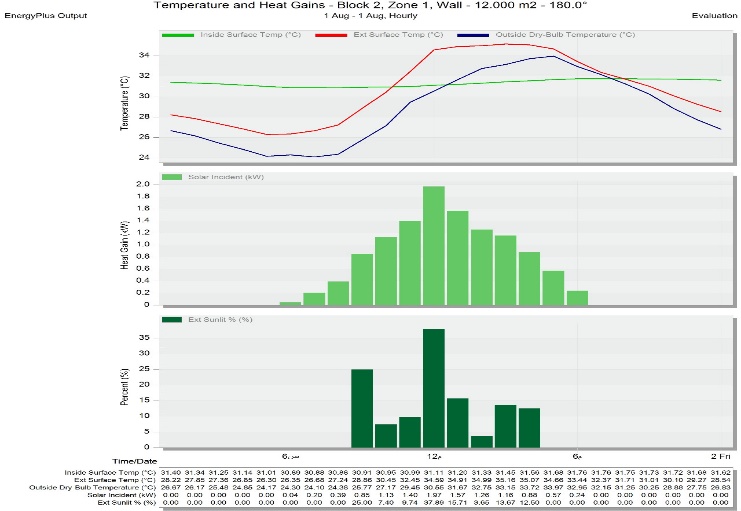
7.2. The Results of Facing the Tested Wall to the South Orientation
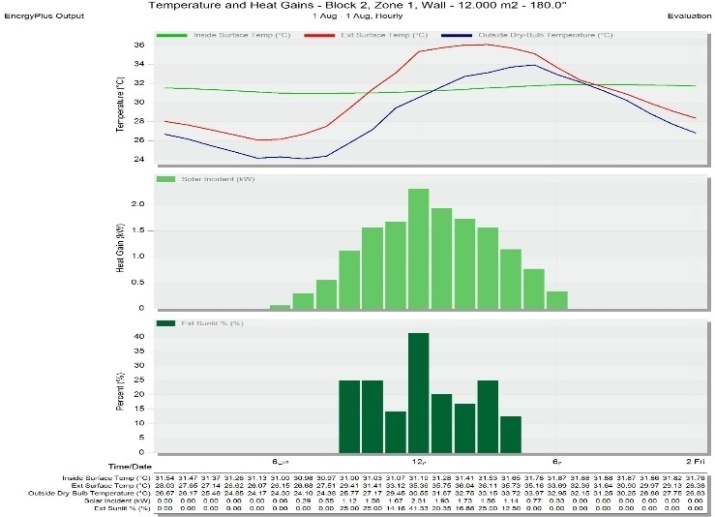
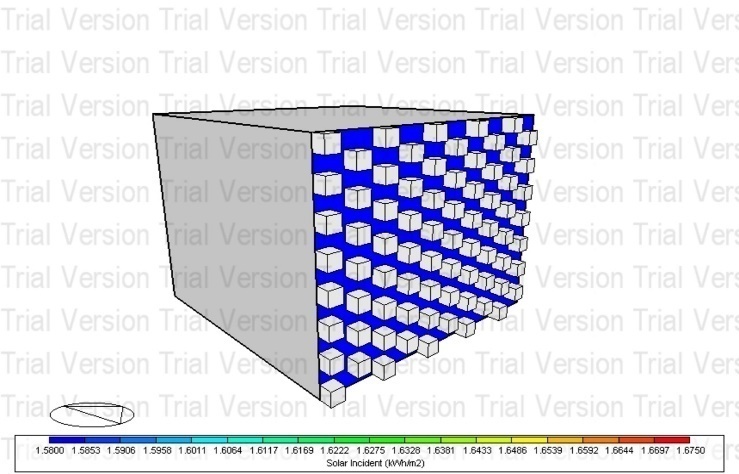
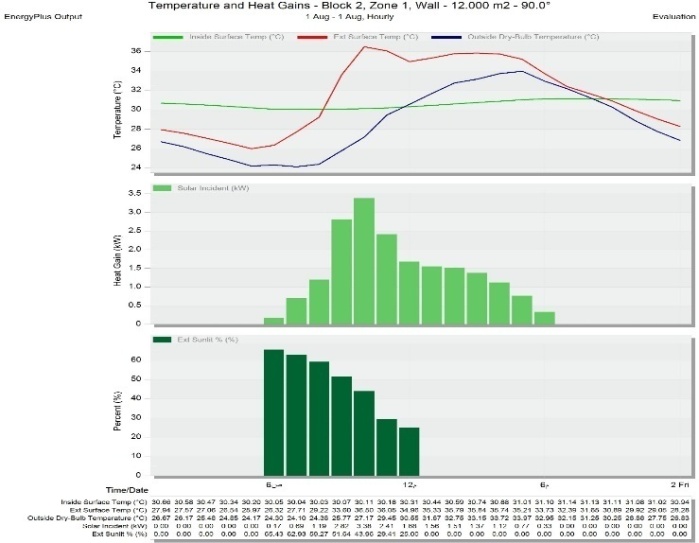
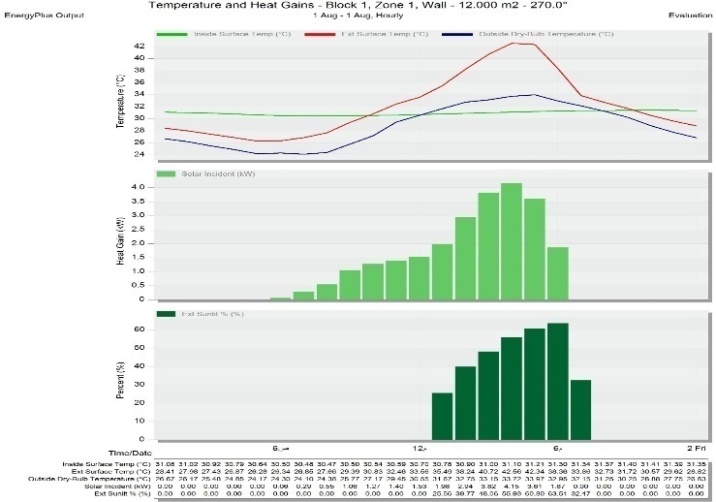
- First Model: Base Case, the results of the simulation show that the maximum exit surface temperature was 40.93°C at 1 p.m., and the temperature of the inner surface at the same time was 31.75°C, based on that the highest ∆ 𝑇= 9.18 at 1 p.m. Also, the results show that the Solar Incident reached 3.95 KW. The percentage of Ext Sunlit reached 100% from 9 am to 3 pm (see Figure 12, 13).
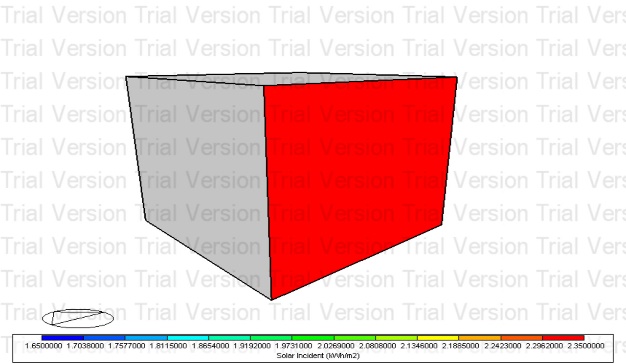 | Figure 12. Solar Incident for first model-KW/M2 |
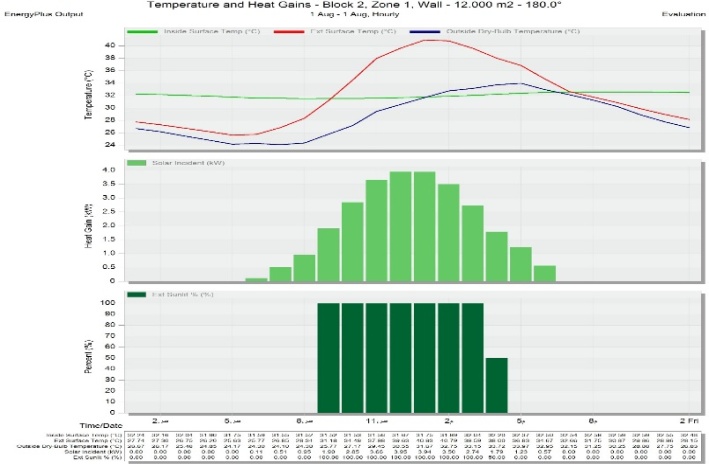 | Figure 13. Temperature and heat gain -1st of Aug, Hourly for first model |
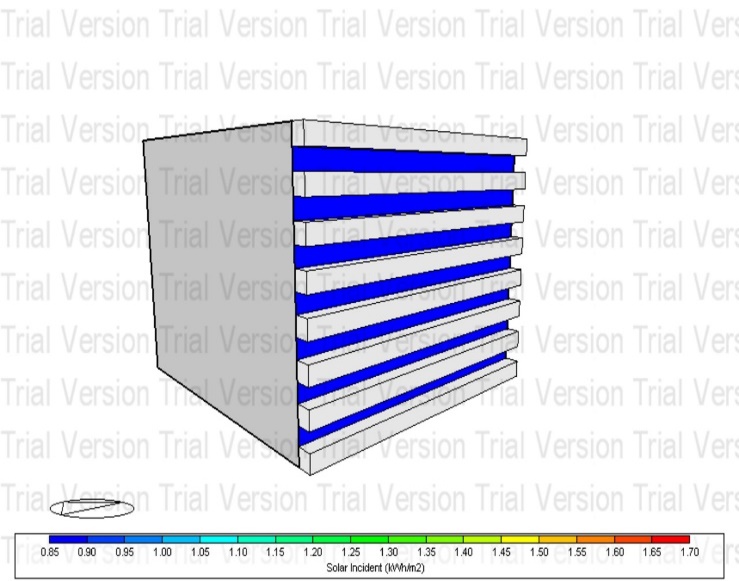
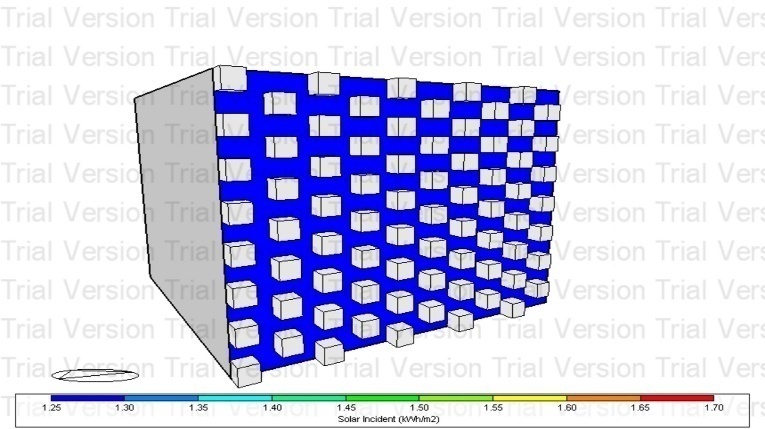
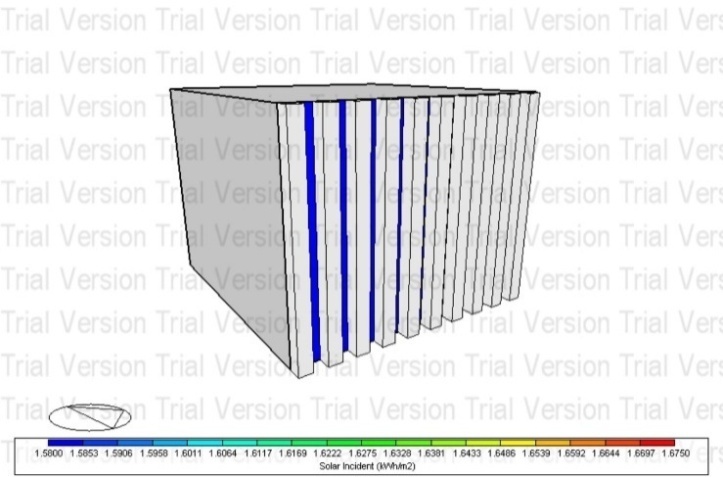
 | Figure 14. Solar Incident for the second model-KW/M2 |
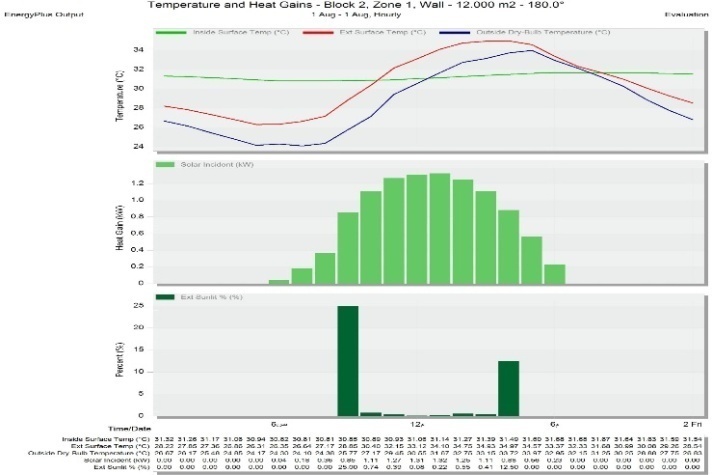
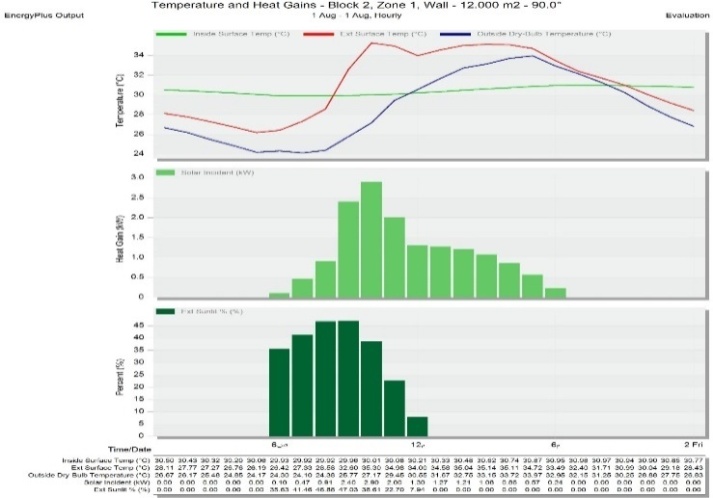
 | Figure 15. Temperature and heat gain -1st of Aug, Hourly for the second model |
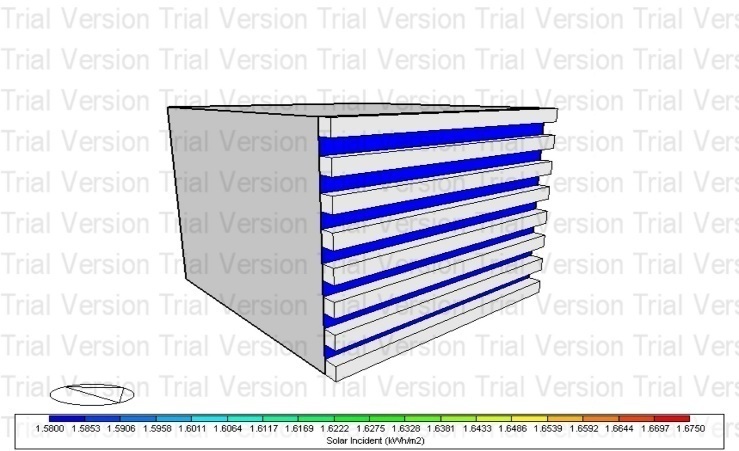
 | Figure 16. Solar Incident for the third model-KW/M2 |
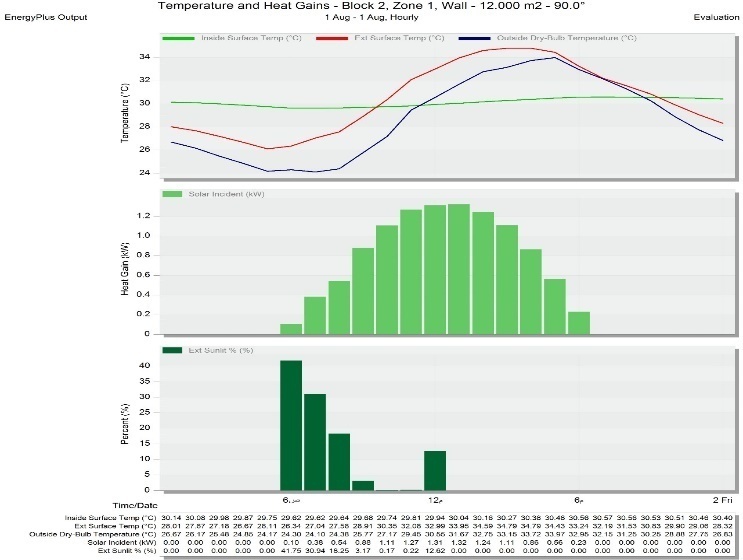
 | Figure 17. Temperature and heat gain -1st of Aug, Hourly for the third model |
 | Figure 18. Solar Incident for the fourth model -KW/M2 |
 | Figure 19. Temperature and heat gain -1st of Aug, Hourly for the fourth model |
7.3. The Results of Facing the Tested Wall to the East Orientation
- First Model: Base Case, the results of the simulation show that the maximum exit surface temperature was 44.31°C at 10 a.m., and the temperature of the inner surface at the same time was 30.62°C, based on that the highest ∆ 𝑇= 13.69 at 10 a.m. Also, the results show that the Solar Incident reached 6.49 KW. The percentage of Ext Sunlit reached 100% from 6 a.m. to 12 a.m. (see Figure 20, 21).
 | Figure 20. Solar Incident for second model Model-KW/M2 |
 | Figure 21. Temperature and heat gain -1st of Aug, Hourly for second model |
 | Figure 22. Solar Incident for second model -KW/M2 |
 | Figure 23. Temperature and heat gain -1st of Aug, Hourly for second model |
 | Figure 24. Solar Incident for the third model -KW/M2 |
 | Figure 25. Temperature and heat gain -1st of Aug, Hourly for third model |
 | Figure 26. Solar Incident for the fourth model -KW/M2 |
 | Figure 27. Temperature and heat gain -1st of Aug, Hourly for fourth model |
7.4. The Results of Facing the Tested Wall to the West Orientation
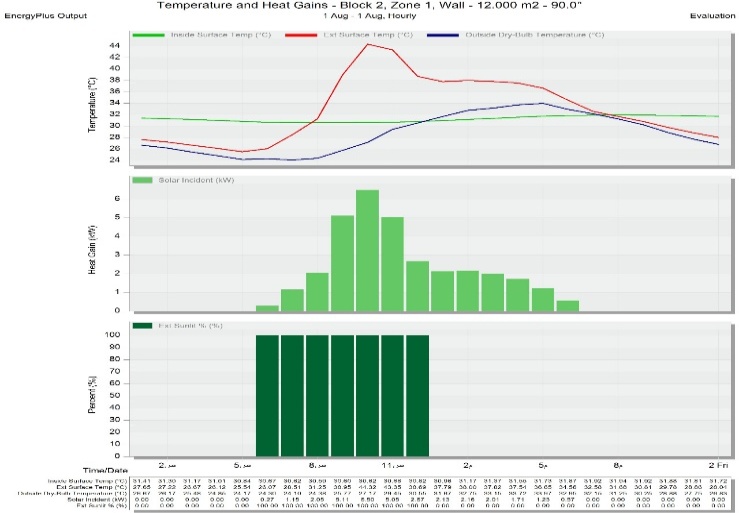
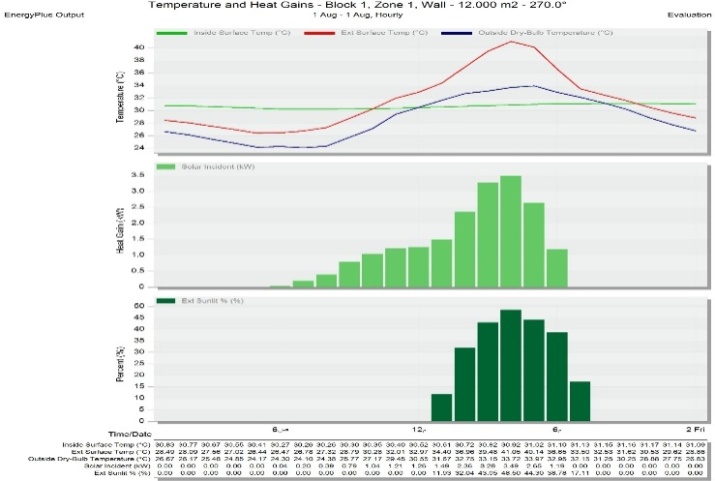
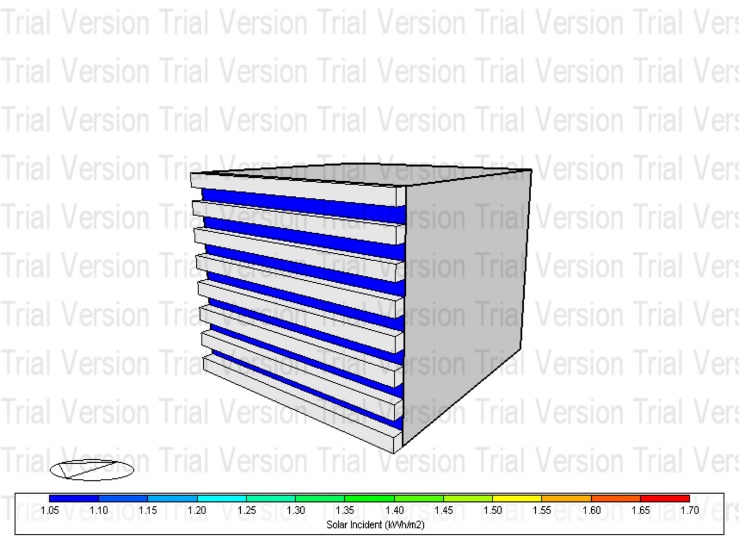
- First Model: Base Case, the results of the simulation show that the maximum exit surface temperature was 49.85°C at 4 p.m., and the temperature of the inner surface at the same time was 31.75°C, based on that the highest ∆ 𝑇= 18.10 at 4 p.m. Also, the results show that the Solar Incident reached 7.14 KW. The percentage of Ext Sunlit reached 100% from 1 p.m. to 6 p.m. (see Figure 28, 29).
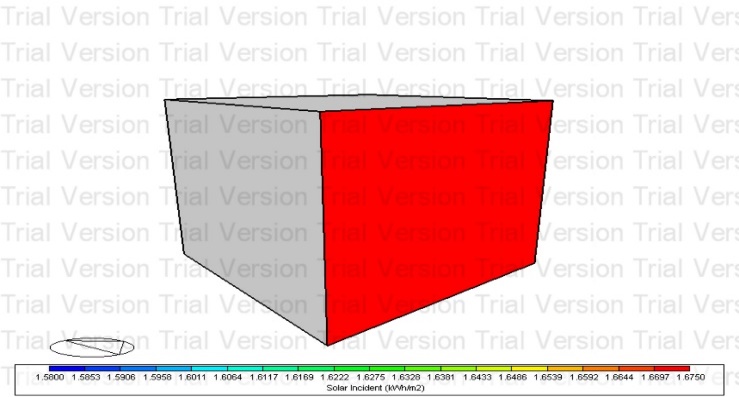
 | Figure 28. Solar Incident for the first model-KW/M2 |
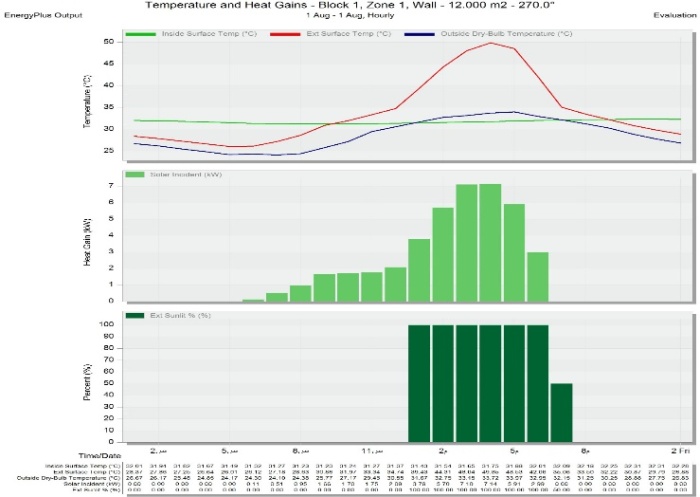 | Figure 29. Temperature and heat gain -1st of Aug, Hourly for first model |
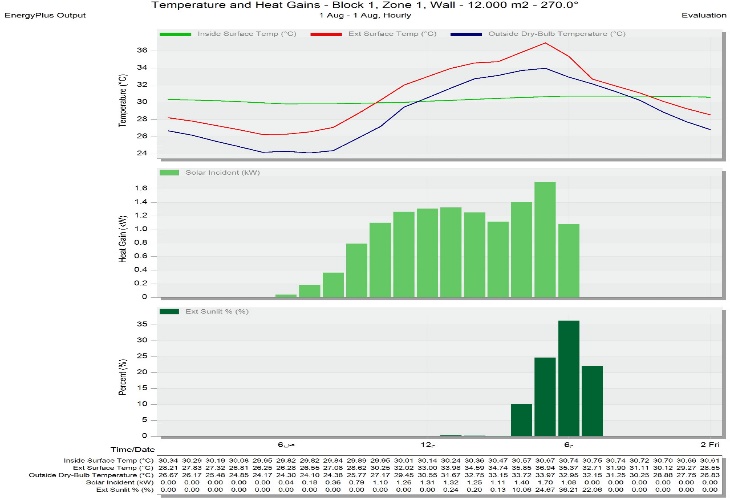
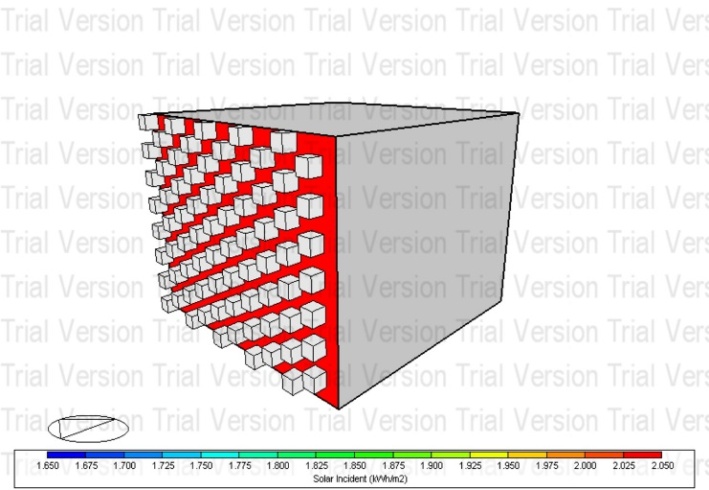
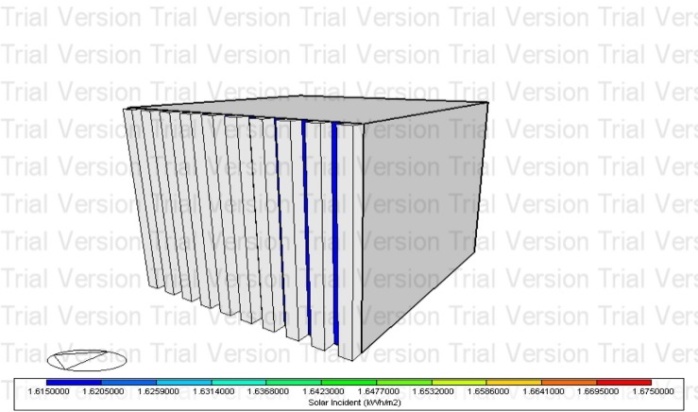 | Figure 30. Solar Incident for the second model -KW/M2 |
 | Figure 31. Temperature and heat gain -1st of Aug, Hourly for second model |
 | Figure 32. Solar Incident for the third model -KW/M2 |
 | Figure 33. Temperature and heat gain -1st of Aug, Hourly for the third model |
 | Figure 34. Solar incident for the fourth model -KW/M2 |
 | Figure 35. Temperature and heat gain -1st of Aug, Hourly for fourth model |
7.5. Readings Analysis
- Table 2. shows a comparison between the results of the different alternatives that applied Self-Shading strategy of walls compared with the base case in each orientation (south/ east/ west); by comparing the highest temperatures reached the outer surface of the wall-under-test in the proposed alternatives, as well as the highest temperature reached the inner surface, and the highest Solar Incident and percentage of Exit Sunlight.The results of the comparison of alternatives in the south orientation show that the highest temperature reached the outer surface of the basic case was 40.93°C at 1 p.m., and the outer surface temperature of the third model at the same time was 34.09°C, thus the third model has succeeded in reducing the temperature by 6.84 degree. For the east orientation, the highest temperature reached the outer surface of the basic case was at 44.31°C at 10 a.m.; the outer surface temperature of the third model at the same time was 30.35°C. Therefore, the third model has succeeded in reducing the temperature by 13.96 degree. As for the west orientation, the highest temperature reached the outer surface of the basic case was 49.85°C at 4 p.m. The outer surface temperature of the third model at the same time was 35.84°C, thus the third model has succeeded in reducing the temperature by 14.01 degree.For the south orientation, it is shown that the lowest ∆ 𝑇 = 3.47 is for the third model; Horizontal Protruding Ribs, Ext Sunlit% dropped to 25% in the same model, and followed by the second model; Vertical Protruding Ribs, the lowest ∆ 𝑇 = 3.71 and Ext Sunlit% dropped to 37.88%. As for the east orientation, it is shown that the lowest ∆ 𝑇 = 4.51 for the third model; Horizontal Protruding Ribs, Ext Sunlit% dropped to 41.74% in the same model, and followed by the second model; Vertical Protruding Ribs, the lowest ∆ 𝑇 = 5.28 and Ext Sunlit% dropped to 47.03%. Moreover, for the east orientation, it is shown that the lowest ∆ 𝑇 = 6.26 is for the third model; Horizontal Protruding Ribs, Ext Sunlit% dropped to 36.21 % in the same model, and followed by the second model: vertical protruding ribs, the lowest ∆ 𝑇 = 10.13 and Ext Sunlit% dropped to 48.49%.In addition, by applying Self-Shading Strategy, the alternatives succeeded in reducing Ext Sunlit. The third model succeeded in reducing Ext Sunlit to 25% instead of 100% for the basic case in the south orientation, and it succeeded in reducing Ext Sunlit to 41.74% instead of 100% for the basic case in the eastern orientation. Moreover, it succeeded in reducing Ext Sunlit to 36.21% instead of 100% for the basic case in the west orientation.Furthermore, all alternatives succeeded in reducing Solar Incident compared to the basic case, at the maximum time of solar radiation, as it dropped to 1.32 KW for the third model: Horizontal Protruding Ribs in the south orientation, as well as 1.32 KW in the east orientation and 1.70 KW in the west orientation.
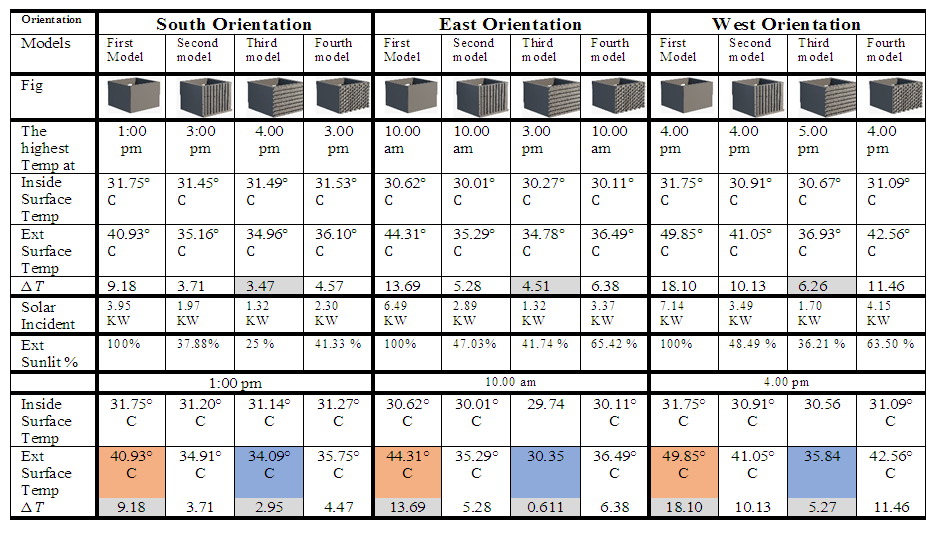 | Table 2. A comparison between the results of the different alternatives |
8. Conclusions
- Through the analytical approach to understand the strategy of Self-Shading walls, the following results have been reached:§ Nature could inspire us with outstanding strategies to solve high-temperature challenges in hot and arid zones, resembling Self-Shading Strategy. Consequently, this strategy can be applied to improve the thermal performance of the building, increase human comfort and decrease energy consumption in the buildings.§ The amount of heat transferred through the walls “ Φ = A × U × ∆ 𝑇 “ depends on three variables: 1) u-value = the measure of the overall rate of heat transfer through a particular section of construction, 2) A= wall area, 3) Δ𝑇= (T1 - T2)=Temperature difference on both sides of the wall. Thus, when reducing the external surface temperature by shading, Δ𝑇 will decrease. Subsequently, the amount of heat transferred to buildings is reduced.§ Literature review shows that there is a lack of studies on shading the opaque solid walls, although walls represent the largest area of the building envelopes and play an important role in thermal performance within the spaces.§ The idea of Self-Shading walls was illustrated by the following elements, 1 - creating areas of shadows that result from the interception of prominent elements of the wall to the sun. 2- Increasing the exposed area to cooling and decreasing the surface temperature. 3- The amount of transferred heat through the wall is reduced by conduction. 4 - The temperature of the inner surface decreases and therefore the temperature transferred to the room decreases by convective. 5- Thermal comfort improves inside the room and thus reduces energy consumption.By analyzing the results of the simulation of the strategy of Self-Shading Walls, the following results have been reached:The study proposed three different geometric patterns for the formation by bricks on a wall-under-test. The first proposed pattern: Vertical Protruding Ribs, the second proposed pattern: Horizontal Protruding Ribs, the third proposed pattern: Staggered Protruding Brick Molds. Also, the study presented a base case model without protrusions to compare with, so as to facilitate the assessment of the impact of self-shading on raising the efficiency of thermal performance within the spaces.The results of the simulation were:§ The proposed pattern: Horizontal Protruding Ribs has succeeded in reducing the outer surface temperature compared to the base case by 6.84 degree in the south orientation, 13.96 degree the east orientation, 14.01 degree in the west orientation.§ The alternatives succeeded in reducing ∆ 𝑇, where the readings of ∆ 𝑇 for the base case “wall without self-shading” were, ∆ 𝑇 = 9.18 in the south orientation, ∆ 𝑇 = 13.69 in the east orientation, ∆ 𝑇 = 18.10 in the west orientation, whereas, the proposed pattern: Horizontal Protruding Ribs reached ∆ 𝑇 = 3.47 in the south orientation, ∆ 𝑇 = 4.51 in the east orientation, ∆ 𝑇 = 6.26 in the west orientation. Consequently, the amount of heat transferred through the walls will decrease.§ The alternatives succeeded in reducing Ext Sunlit. The third model succeeded in reducing Ext Sunlit to 25% instead of 100% for the basic case in the south orientation and it succeeded in reducing Ext Sunlit to 41.74% instead of 100% for the basic case in the eastern orientation. Moreover, it succeeded in reducing Ext Sunlit to 36.21% instead of 100% for the basic case in the west orientation.§ All alternatives succeeded in reducing Solar Incident compared to the basic case, at the maximum time of solar radiation, as it dropped to 1.32 KW for the third model: Horizontal Protruding Ribs in the south orientation, as well as 1.32 KW in the east orientation and 1.70 KW in the west orientation.§ The study succeeded in proving the hypothesis “by using a Shading Strategy that is inspired by nature's solutions on opaque solid walls which can reduce the temperature of surfaces exposed to direct sunlight, and reduce the amount of heat transferred through the walls, thus achieving thermal comfort for users. Overall, the concept presented in the paper is a methodological framework for understanding Self-Shading Walls, and an initial assessment to employ this strategy in achieving thermal comfort. Nonetheless, more analytics need to apply the strategy of Self-Shading Walls in desert buildings. Furthermore, future studies should analyze the application of Self-Shading Walls strategy on different types and thickness of bricks, and different patterns of configurations.