-
Paper Information
- Previous Paper
- Paper Submission
-
Journal Information
- About This Journal
- Editorial Board
- Current Issue
- Archive
- Author Guidelines
- Contact Us
Architecture Research
p-ISSN: 2168-507X e-ISSN: 2168-5088
2019; 9(3): 63-73
doi:10.5923/j.arch.20190903.02

Influence of Circulation Space Configuration Attributes on the Location of Economic Enterprises in Obunga Informal Settlement, Kisumu City
 Abstract
 Reference
 Full-Text PDF
 Full-text HTML
Peter Maluki Samburu, Patrick Odhiambo Hayombe, Fredrick Omondi Owino
Department of Spatial Planning, Jaramogi Oginga Odinga University of Science and Technology, Bondo, Kenya
Correspondence to: Peter Maluki Samburu, Department of Spatial Planning, Jaramogi Oginga Odinga University of Science and Technology, Bondo, Kenya.
| Email: |  |
Copyright © 2019 The Author(s). Published by Scientific & Academic Publishing.
This work is licensed under the Creative Commons Attribution International License (CC BY).
http://creativecommons.org/licenses/by/4.0/

The objective of this study was to determine the influence of circulation space configuration attributes on the location of economic enterprises in Obunga informal settlement, Kisumu city. The study was based on street network modelling and analysis guided by the Space Syntax Theory. Spearman correlation coefficients of circulation space configuration attributes (betweenness, integration, connectivity and mean depth) were determined against the location of economic enterprises. The corresponding hypothesis was tested using a multilinear ANOVA regression model. Findings indicated a statistically significant relationship between circulation space configuration attributes with retail shops, food kiosk, M-pesas, and Barbershops and salons. Results of R-square values indicated that circulation space configuration attributes could predict the location of retail shops, food kiosks, M-pesas and barbershops and salons by 41%, 59.7%, 33.3%, and 33.4% respectively. Betweenness was found to be the best predictor of the location of economic enterprises in Obunga. The study concluded that economic enterprises are attracted along streets that can accommodate through movement in a settlement, thus, there is need to create and enhance quality of roads linking Obunga to its neighbors.
Keywords: Circulation Space Configuration, Economic Enterprises, Obunga Informal Settlement, Kisumu City
Cite this paper: Peter Maluki Samburu, Patrick Odhiambo Hayombe, Fredrick Omondi Owino, Influence of Circulation Space Configuration Attributes on the Location of Economic Enterprises in Obunga Informal Settlement, Kisumu City, Architecture Research, Vol. 9 No. 3, 2019, pp. 63-73. doi: 10.5923/j.arch.20190903.02.
Article Outline
1. Introduction
- Spatial patterns and location of economic enterprises, like other land uses - within the informal settlements is often described as spontaneous, irregular, uncontrolled, unauthorized, unplanned, self-generated, marginal, informal, or even self-help (McCartney & Krishnamurthy, 2018). This is attributed to ineffective planning and poor institutional capacity which results in uncoordinated infrastructural development as well as policies and plans that are rarely implemented (UN-Habitat, 2019). This study therefore investigates the factors that influence the location of economic enterprises in an informal settlement by presenting a theoretical and empirical analysis of circulation space configuration attributes. The case of an informal settlement is selected because they are predominantly self-grown and have not been affected by zoning plans or land use regulations.
1.1. Review of Related Literature
- Narvaez, Penn and Griffiths (2015) studied the architectural adaptation of urban economic life with a focus on the attributes of location, use and form of the commercial-residential building in Cardiff. In the study, syntactical and morphological approaches which included a combination of depth distance analysis with patterns of use and building form were applied. The study established that the identification of corner shops located within one turn of direction from main high streets within grid iron urban forms, while activities combining retail or local office businesses with residential functions are located in corner blocks along streets within radial urban morphologies.In another study, Porta et al., (2012) examined street centrality and the location of economic activities in Barcelona. The research investigated geography of three street centrality indices (integration, betweenness and straightness) in order to establish which of the indices is more closely associated with which type of economic activity (primary and secondary). In this study, circulation space configuration (centralities) were calculated purely on the street network by using a multiple centrality assessment model, and a kernel density estimation method. Results indicated that street centralities are correlated with the location of economic activities and that the correlations are higher with secondary than primary activities. In this study primary activities were considered as ‘‘those which, in themselves, bring people to a specific place because they are anchorages’’, including manufactures and nodal activities at the metropolitan and regional levels; and secondary activities are ‘‘enterprises that grow in response to the presence of primary uses, to serve the people the primary uses draw’’ (Jacobs, 1961 cited by Porta et al., 2012).Similarly, Froy (2016) explored the relationship between the spatial configuration of the city of Antwerp and the organization of its trades and occupations. The study established that some trades and occupations took advantage of the foreground network of accessible streets more than others. Those occupations with high accessibility at all scales included retailers, wholesalers and artisans.In another study, Mohamed, Van Nes, and Salheen (2015) investigated the correlation between spatial factors and the distribution of internal and edge commercial land uses by applying the space syntax methodology and statistical analysis of the economic issues and band analyzes within three informal settlements in Cairo. The study established that the distribution of commercial activities takes place on the plots that are located along the spatially most integrated, most distributed and most inter-visible parts of the neighborhoods. Further, the study found out that shops are mostly concentrated along main internal streets to capture pedestrian movement, while light industrial uses (e.g. workshops) are mainly clustered along the outer borders facing inner-city highways to get the benefit of through-travelers’ vehicular movement.Narvaez, Penn, and Griffiths (2014) studied the spatial dimensions of trade from the geography of uses to the architecture of local economies. The research investigated the relationship between urban space and urban economy focusing on the way centralities emerge across scales. The study combined three different types of distances in the street network –metric, topological and angular- with rent values of commercial and residential properties. The results of the study established that street connectivity and accessibility of a commercial-residential building can have a significant impact on how easy it is to reach a destination or how frequently a specific location is more likely to be used as a route to pass through. In conclusion, the study suggests that economy requires proximity and proximity creates opportunity for economic activity.In another study, Porta, Strano, Lacoviello and Messora (2008) conducted a study on street centrality and densities of retail and services in Bologna, Italy. The research established that retail and service activities tend to concentrate in areas with better centralities. The distribution of these activities correlates highly with the betweenness of the street network, and also, to a slightly lesser extent, with the integration. The study also established that the density of centrality and economic activity naturally increases towards intersections because of the sheer convergence of streets in one space. The study concludes that street centrality plays a crucial role in shaping the formation of urban structure and land uses. Further, a study by Sevtsuk (2014) investigated the distribution of retail and food businesses in dense urban environments with Cambridge and Somerville as case study. findings indicated that betweenness values were highly significant and positive in predicting the location of retail and food establishments. Additionally, a study by Hillier et al. (1993) and Van Nes (2005) established that street integration and spatial connectivity of the street network tend to generate successful market places.The reviewed literature suggests existence of relationships between circulation space configurations and the location of economic enterprises in several areas of the world. Therefore, notions of the spatial patterns of economic enterprises cannot be separated from the spatial attributes of built environment since circulation space configuration can be used as a predictor of economic enterprises in the urban areas. Additionally, it clearly can be justified that much studies on circulation space configuration and location of economic activities have been applied in cities of developed countries. Notably, these cities are planned with coherent and spatially organized or regular street networks and land use development. However, the notions of informality with a lens on location of economic enterprises and circulation space configuration in cities of the developing world needs to be clearly understood and explained. Additionally, there exists mixed results and conclusions on which of the circulation space configuration attributes best predicts the location of economic enterprises. For instance, Hillier et al. (1993) and Van Nes (2005) established that street integration and spatial connectivity best generate successful market places while Sevtsuk, (2014) found that betweenness values were highly significant and positive in predicting the location of retail and food establishments; and Mohamed, Van Nes, and Salheen (2015) found that the distribution of commercial activities takes place on plots that are located along spatially most integrated streets. While most of these studies have focused majorly on planned neighborhoods, there isn’t much understanding on which attributes best describe location of economic enterprises in an informal settlement of developing countries. This research will therefore bridge this gap by examining circulation space configuration attributes and their influence on the location of economic enterprises within an informal settlement.
1.2. Research Objective and Hypothesis
- Based on the identified research gap, the objective of this study was to investigate the influence of circulation space configuration attributes on the location of economic enterprises in Obunga informal settlement, Kisumu city. The null hypothesis was that there was no significant relationship between circulation space configuration attributes and the location of economic enterprises in Obunga informal settlement, Kisumu City.
1.3. Significance of the Study
- The study examines the influence of circulation space configuration attributes on the location of economic enterprises. Since informal settlements are spontaneous, highly dynamic and complex areas in terms of formation and growth, an understanding of factors influencing their formation i.e. the location and morphology attributes is a prerequisite. The study holds the premise that if the location and spatial patterns of economic enterprises could be predicted by means of measurable spatial attributes, then the probability of maximum returns can subsequently be predicted. This information is important to urban planners and policy makers in understanding the structure of informal settlements and their configurational characteristics, thus facilitating spatial planning decisions. In a broader perspective, the study contributes to the understanding of whether informality obeys some spatial order.
1.4. Theoretical Framework
- This study adopts the space syntax, which was originally illustrated by Hillier and Hanson (1984) as a tool to help urban planners explore, predict and evaluate the likely effects of their design interventions in all its diverse forms (Legeby, 2013). It is based on the assumption that spatial relationships between spaces (streets in an urbanized set up) are major structuring elements that shape people’s behavior in these spaces (Hillier, 1996). According to Alalouch, Al-Hajri, Naser, and Hinai (2019) the theory has been used to quantify the spatial configuration of urban spaces and has established a strong explanatory power regarding several activities in urban areas including land use distribution, particularly patterns of retail development. Space syntax analysis is based on three major models which include: node graphs, visibility graph and axial line models (Manum, 2006).Node Graph Models: According to Manum (2006), a node graph has two elements, nodes and connections. A node represents a convex space and a line (link) connecting node represents relations between nodes. A convex space, every point in the space is visible from every view point. The line between two random points in the space is always within the perimeter. A building space can be divided into several convex spaces without any overlap. Linking all the nodes with lines, the result is a connectivity node graph. This model is applied in building analysis (Manum, 2006).
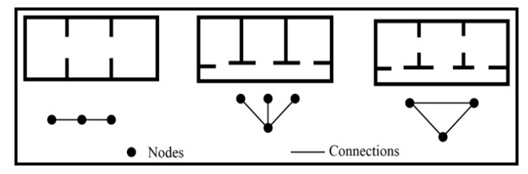 | Figure 1. Building plans and their connectivity graphs (Source: Jiang, Claramunt and Klarqvist (2013)) |
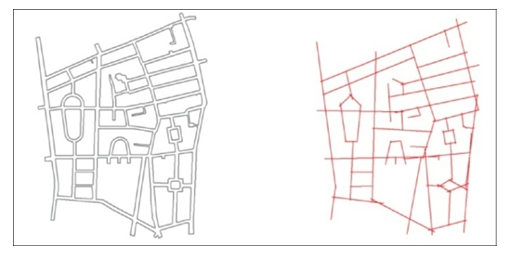 | Figure 2. Urban space and its axial map (Source: Pinelo and Turner (2010)) |
1.5. Measures of Circulation Space Configuration
- Integration: One of the most common measures of space syntax is the integration, which indicates how accessible or connected a line (street) is in relation to all the other lines in the map (Alobaydi & Rashid, 2017). Therefore, high integration values indicate streets that are well connected while low values refer to streets that have fewer connections with the other streets (Sun, 2016). The integrated values are represented graphically on the map using a scale of colors that range from red referring to highly integrated streets, to blue referring to the segregated streets (Alobaydi & Rashid, 2017). Integration values can be computed at different radii. For example, the integration value at radius-3 of a line uses only those lines that are three steps away for the given line; the integration value at radius-5 uses only those lines that are five steps away for the given line; the integration value at radius-7 uses only those lines that are seven steps away for the given line; and so on (Alobaydi & Rashid, 2017). The integration value at radius-n of a line considers the n-steps needed to cover all the lines in the whole system (Hillier, 2007). Therefore, the integration value computed at a lower radius describes a more local syntactic property than that computed at a higher radius. Based on this parameter, several empirical studies have shown positive correlations between integration and the presence of pedestrians (Hillier & Ida, 2005). A potential factor explaining the link between higher street integration and more pedestrians is land use along street segments. Commercial land uses mainly exist along highly integrated streets, because such streets are more accessible from other locations, which is important for commercial land uses (Hillier et al. 1993). Previous studies have linked integration to human behavior and perception in space (Alalouch & Aspinall, 2007; Abbasi, Alalouch, & Bramley, 2016), as well as to land use density and price (Kim & Jun, 2013).Betweenness (choice): In contrast with integration, betweenness measures another aspect of centrality in spatial networks (Hillier & Ida, 2005). It measures how often (number of times) a node appears (falls) on the shortest routes between all pairs of segments within a specified network distance, termed ‘radius’ (Yoon, Blumer & Lee, 2006). The betweenness centrality of a node reflects the amount of control that this node exerts over the interactions of other nodes in the network (Newman, 2003). Segments with high betweenness value within are important links connecting the system and more likely to attract through movement. They are therefore important to the city as they exert considerable influence within a network by the virtue of their control over other links passing between them. This implies that removal of such segments will most likely disrupt movements and communications between other segments as many routes passed through them. Boyd (2010) states that places with higher betweenness are more likely to evolve into hubs of denser and more diverse economic and human activities attracting a diversity of land uses in a neighbourhood. Therefore, such routes have the potential to support the active presence of people and the resultant urban economy (Porta, Crucitti, & Latora, 2006).Connectivity: This is a local measure of circulation space configuration. It refers to the number of other axial lines or spaces that are directly connected to any one line or space (Hillier, 1996).Mean Depth: This measure involves… “assigning a depth value to each space according to how many spaces it is away from the original space, summing those values and dividing by the number of spaces in the system less one (the original space)” (Hillier & Hanson, 1984). In other words, this parameter measures the extent to which a space is segregated or more remote or cut off from all other spaces within a settlement (Vaughan, 2015). Therefore, more segregated spaces have higher mean depth values whereas less segregated have lower values.
2. Methods and Materials
2.1. Description of the Study Area
- Obunga is located in Kisumu County of Kenya. The County abuts Siaya county to the west, Kericho county to the East, Homabay county to the south, and Vihiga and Nandi to the north. Obunga is approximately 1.39 sq.km and is situated 2 km north of the city center of Kisumu. It is located in East Kisumu sub-location and encompasses five smaller areas namely: Central 1, Central 2, Kamakowa, Kasarani and Sega (Munala, 2009). It was formed when the colonial government forced the inhabitants out of Kisumu. Its population grew when it developed as a fish market, as the economy of Kisumu expanded (Karanja, 2010). Obunga has a high density of building structures made up of mud and iron sheets (UN Habitat, 2005). The settlement is adjacent to the city’s industrial area, and many of its inhabitants are from surrounding rural areas (Maoulidi, 2012).
2.2. Target Population
- Mugenda and Mugenda (2003) defines target population as a population from which results are generalized. In this study, the target population comprised of 259 business operators (owners) from Obunga informal settlement categorized based on type of activity. This included 106 retail shops, 39 M-pesas, 30 food kiosks, 36 barbershops and salons, 16 textile shops, 7 butcheries, 3 chemists, nine entertainment shops, 7 bars, 4 cyber cafes and two welding shops documented during field survey. According to Yin (2009), this categorization approach is necessary where multiple sources of evidence is required. According to Kothari (2004) a large sample items of 30 and above renders sampling distribution of mean closer to the normal distribution. From the listed businesses, the study considered enterprises with more than 30 tallies for further examination thus, retail shops, food kiosks, M-pesas and barbershops and salons were selected.
2.3. Data Collection and Analysis
- Geo-positioning technique was used to collect and identify the geographical location of economic enterprises in Obunga. This was done by use of Global Positioning System (GPS) technology as it provides reliable locational information to facilitate decision making by its users (Kennedy, 2002). Street network data set was obtained from the County Government of Kisumu. ArcGIS 10.3.1 software was used to overlay economic enterprises and street network to determine their spatial distribution. Depthmapx software was used to compute axial maps and circulation space configuration attributes. Further, Spearman Correlation Coefficients and Multilinear Regression ANOVA model was computed to determine statistical significance and relationship amongst the study variables.
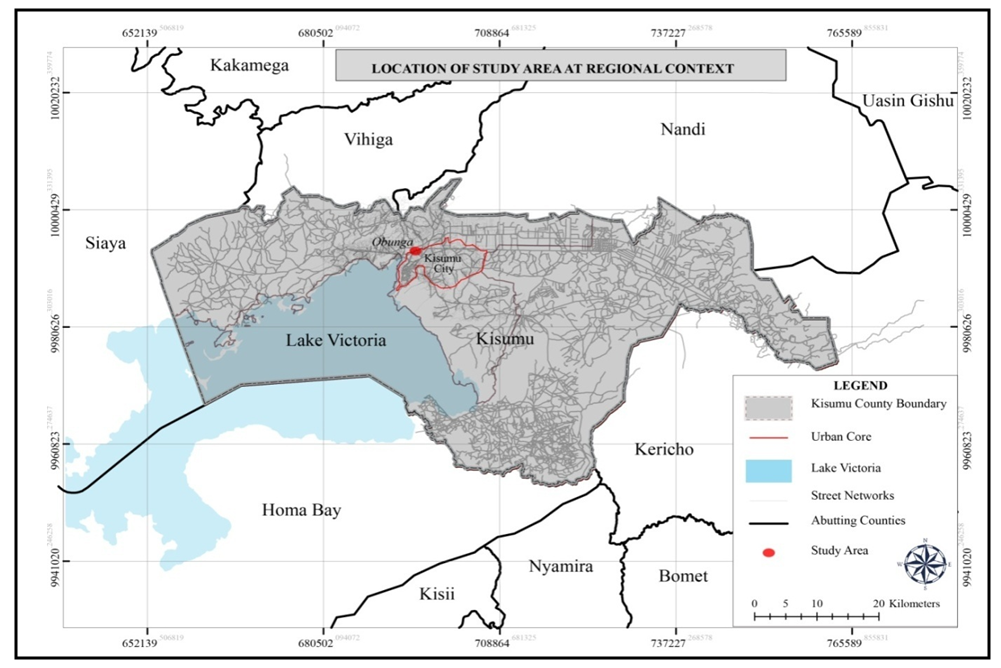 | Figure 3. Location of Obunga informal settlement. (Source: Modified from Kisumu Integrated Sustainable Urban Development Plan (ISUD), 2013) |
3. Findings and Discussions
3.1. Axial Line Analysis
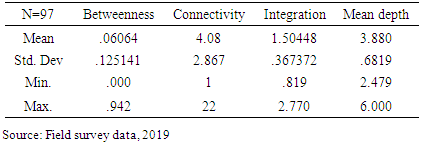
- Analysis of circulation space configuration was based on the axial map of Obunga, which was generated using Depthmapx software. Spatial attributes of integration, betweenness, connectivity and mean depth were computed and compared against the spatial location of economic enterprises. A visual examination of the axial analysis maps shows high integration, connectivity and betweenness values along major streets. The mean depth however is highest at minor or most segregated streets of the study area.The analysis depicts a high variation in connectivity as reflected by a standard deviation of 2.867 which is 70.27% (coefficient of variation) of the mean (4.08) as indicated in table 1. The importance of highly connected streets is that they facilitate movements through the neighborhood. A variation of 24.41% and 17.57% of the mean is found in integration and mean depth respectively. This indicates that streets are more segregated (mean depth) and less integrated in the settlement. A much greater variation is found in betweenness (choice) values as indicated by a standard deviation of 0.125 and a mean of 0.06. This indicates there are extremely few streets that links the settlement to the outside (ability to attract movement outside the settlement). This is justified from figure 4 which indicates few streets with relatively high betweenness (red) while majority have low values as denoted by color blue.
|
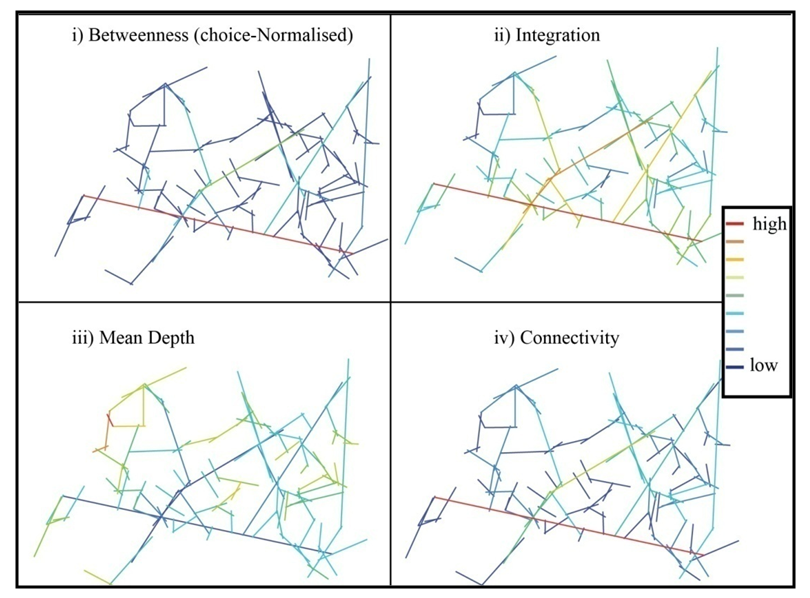 | Figure 4. The axial map analysis of Obunga informal settlement. (Source: Field survey data, 2019) |
3.2. Normality Test
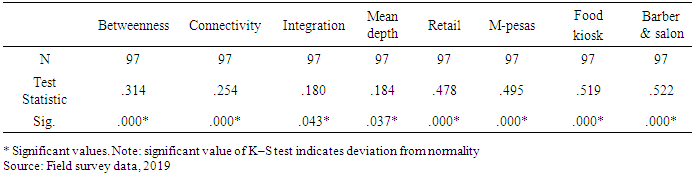
- Before any statistical test, the normality of study variables (retail shops, M-pesas, food kiosks, barbershops and salons, integration, betweenness, connectivity and mean depth) was computed by use of One-sample Kolmogorov-Smirnov test (K–S). This according to Alalouch, Al-Hajri, Naser and Al-Hinai (2019) is an important step as it facilitates selection of appropriate correlation coefficient that best describes the relationships between the variables in the data set. The result indicates that the variables are not normally distributed hence, Field (2005) recommends the use of non-parametric spearman correlation coefficient in examining the relationship between variables.
|
|
3.3. Spearman Correlation Coefficients
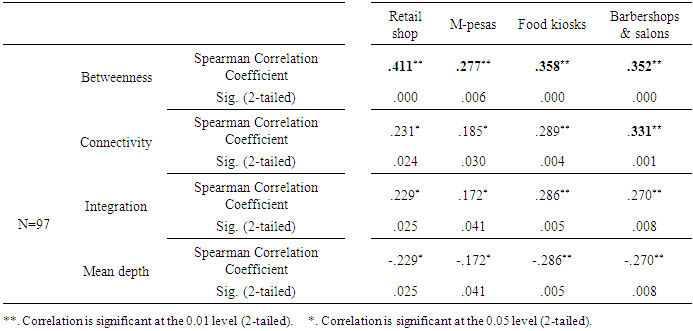
- Accordingly, a nonparametric Spearman Correlation Coefficient was used to assess the relationships between the location of economic enterprises and circulation space configuration attributes. Retail shops: Spearman correlation coefficient for retail shops indicate a significant but moderate positive relationship with betweenness (r=0.411, p=0.000). Additionally, a significant weak and positive association is established with connectivity (r=0.231, p=0.024) and integration (r=0.229, p=0.025) hence non-conclusive. Further, a significant, weak and neglectable negative relationship ensued on the case of mean depth (r=-0.229, p=0.25).M-pesas: Findings indicate a significant weak positive relationship with betweenness (r=0.277, p=0.006), connectivity (r=0.185, p=0.030) and integration (r=0.172, p=0.041). Further, a significant weak negative relationship was found with mean depth (r=-0.172, p=0.041). Although the findings are statistically significant, they are relatively weak and hence not conclusive.Food kiosks: The analysis depict a moderate, significant and positive relationship with betweenness (r=0.358, p=0.000), connectivity (r=0.289, p=0.004), integration (r=0.286, p=0.005) and negative relationship ensued with mean depth (r=-0.286, p=0.005). For the case of connectivity, integration and mean depth, the relationship is weak and hence not conclusive.Barbershops and salons: The results depict a significant moderate positive relationship with betweenness (r=0.352, p=0.000) and connectivity (r=0.331, p=0.001). A non-conclusive, significant, weak positive association is found with integration (r=0.270, p=0.008) while a weak negative relationship ensued with mean depth (r=-0.270, p=0.008).
3.4. Test of Hypothesis
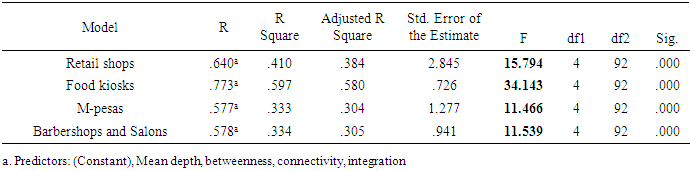
- In order to explain the nature of relationship between circulation space configuration attributes and the location of economic enterprises, a multilinear regression analysis model was computed in SPSS software. Each type of economic enterprise was computed separately against circulation space configuration attributes. The sample size of the dependent variable (211 economic enterprises) is well above the minimum sample size suggested by Miles and Shevlin (2001) for large effect when four predictors are used.Hypothesis: H01: There is no significant relationship between circulation space configuration attributes and the location of economic enterprises in Obunga informal settlement.To test this hypothesis F-values of each category of economic enterprise (retail shop: F=15.794, food kiosk: F=34.143, M-pesas: F=11.466 and barbershops and salons: F=11.539) was compared against the F-critical value (2.705) and the p-value=0.000 at α=0.05 significance level to determine the relationship. In each category, the calculated F-values are high and P-values less than 0.05. This indicates that the model in each category is fit and significant. Further, the calculated F-values are greater than F-critical value at 0.05 significance level. Thus, the hypothesis that there is no significant relationship between circulation space configuration attributes and the location of economic enterprises in rejected. Thus, integration, choice (betweenness), connectivity and mean depth are significant factors in predicting location of economic enterprises in Obunga. Table 4 below indicates that circulation space configuration attributes can predict 41%, 59.7%, 33.3% and 33.4% on the location of retail shops, food kiosks, M-pesas and barbershops and salons respectively as shown by R square values.
|
3.5. Discussion of Results
- The study established existence of significant relationship between circulation space configuration attributes and the location of economic enterprises in Obunga. The results of the Spearman correlation showed that the location of retail shops, food kiosks, M-pesas, barbershops and salons increased with increase circulation space configuration attributes namely betweenness, integration and connectivity. The locations of all the enterprises examined however decreased with increase in mean depth. Betweenness was found to correlate best with location of economic enterprises followed by connectivity then integration. These findings are in agreement with those of Porta, Strano, Lacoviello and Messora (2008) who established that economic activities such as retail shops and service enterprises tend to concentrate in areas with better street betweenness (choice) and less well with integration. This is because these enterprises depend on streets that have high potential for natural movement to attract more customers (Acharya, Karimi, Parham, Guven & Uyar, 2017). However, the findings differ with those of Mohamed, Van Nes, and Salheen (2015) who found that spatial integration better predicted location of commercial land uses than other measures of street centrality in three informal settlements of Cairo. The case of Obunga indicates that streets with higher betweenness (choice) values have the highest potential of evolving into hubs of denser and more diverse economic enterprises.
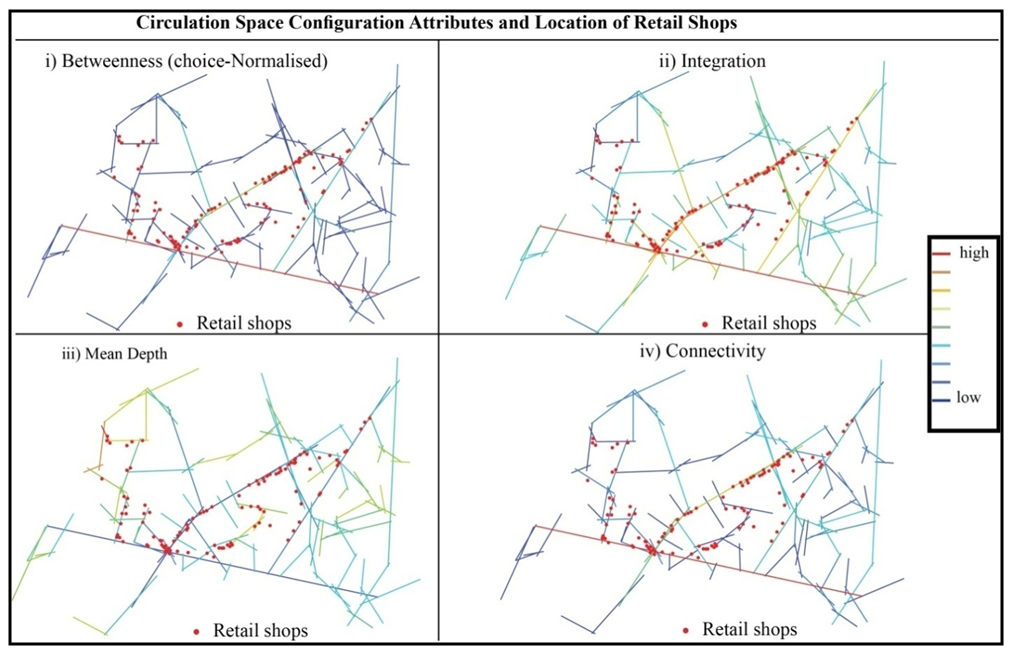 | Figure 5. Circulation space configuration attributes and location of retail shops. (Source: Field survey data, 2019) |
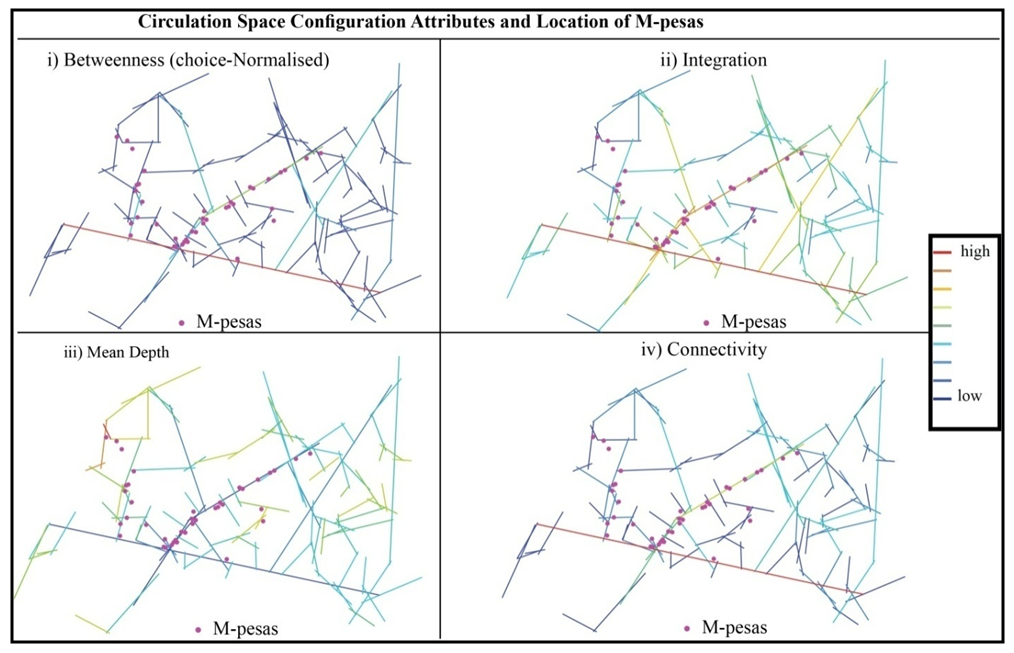 | Figure 6. Circulation space configuration attributes and the location of M-pesas. (Source: Field survey data, 2019) |
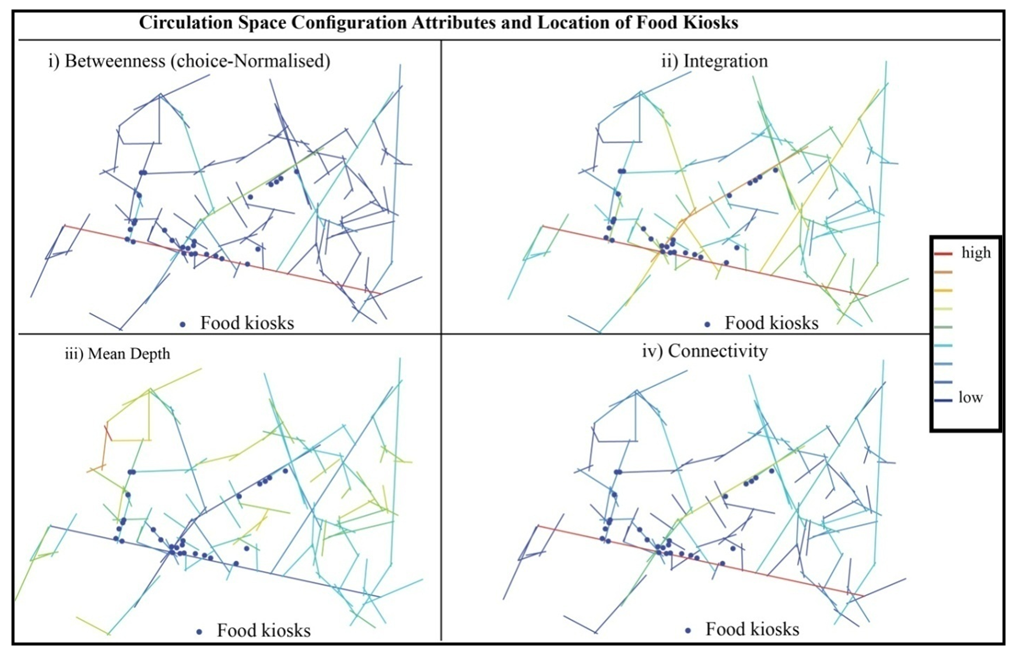 | Figure 7. Circulation space configuration attributes and location of food kiosks. (Source: Field survey data, 2019) |
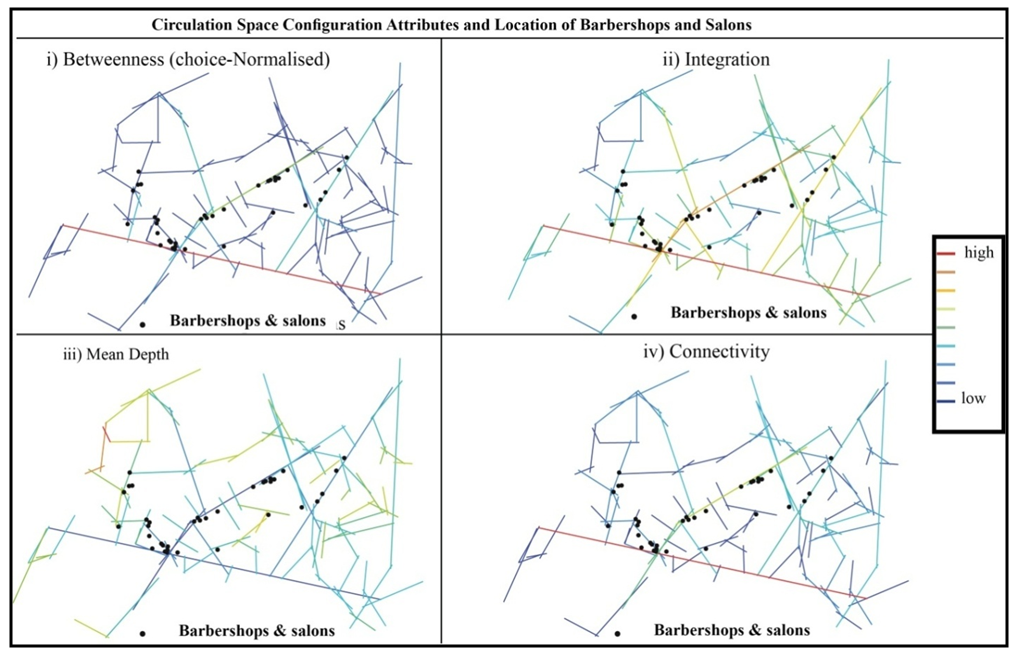 | Figure 8. Circulation space configuration attributes and location of barbershops and salons. (Source: Field survey data, 2019) |
4. Conclusions
- The study findings did confirm that there exists a significant relationship between dependent and independent variables subjected in this study. Particularly, circulation space configuration attributes indicated a significant relationship with the location of economic enterprises. The study concludes that betweenness is the best predictor of economic enterprises. Thus, streets with higher betweenness values attract economic enterprise location more than integration, connectivity and mean depth parameters.