Wilfred Ochieng Omollo1, Patrick Odhiambo Hayombe2, Fredrick Omondi Owino2
1Department of Planning and Development, Kisii University, Kisii, Kenya
2School of Spatial Planning and Natural Resource Management, Jaramogi Oginga Odinga University of Science and Technology, Bondo, Kenya
Correspondence to: Wilfred Ochieng Omollo, Department of Planning and Development, Kisii University, Kisii, Kenya.
| Email: |  |
Copyright © 2018 The Author(s). Published by Scientific & Academic Publishing.
This work is licensed under the Creative Commons Attribution International License (CC BY).
http://creativecommons.org/licenses/by/4.0/

Abstract
The objective of this study was to determine the extent to which residential developments in Kisii Town complied with Building Coverage Ratio (BCR) and Floor Area Ratio (FAR) physical planning standards. To attain this, analysis was undertaken using paired sample t-test, one sample t-test and correlational analysis. Results revealed that on average, though the recommended mean standard for BCR was 69.10%, the observed mean compliance was 75.55%, depicting noncompliance. At the same time, the observed mean compliance for FAR was 189.81 against the mean recommended standard of 311.51, suggesting overall compliance. Nevertheless, when developments were individually analysed, it was found out that 42%, 18.6%, 20%, 16.1%, 9.8%, 15% and 43% in Nyanchwa, Jogoo, Nyamataro, Egesa, Daraja Mbili, Mwembe and Nyamage did not respectively comply with the recommended FAR. The null hypothesis of no statistically significant difference between the recommended physical planning standards and their observed extent of compliance was as well tested. Results found a statistically significant difference (M=199.62, SD = 130.26) and (M = 136.84, SD = 60.21), that was significant, t (12) = 3.001, p = .011, an indication of inadequate development control. The study concluded that the County Government of Kisii had failed to effectively regulate residential building developments in the study area, thus negating the objective of sustainable urban development. A policy recommendation was made for adoption of a strict enforcement and monitoring regime that ensures overall compliance with recommended FAR and BCR in Kisii Town.
Keywords:
Physical Planning Standards, Residential Developments, Development Control, Kisii Town, and Kenya
Cite this paper: Wilfred Ochieng Omollo, Patrick Odhiambo Hayombe, Fredrick Omondi Owino, Compliance with Physical Planning Standards by Residential Developments in Kisii Town, Kenya, Architecture Research, Vol. 8 No. 2, 2018, pp. 62-73. doi: 10.5923/j.arch.20180802.03.
1. Introduction
Physical planning standards are approved guidelines indicating the amount of space required to accommodate certain facility, infrastructure or use, and are usually presented in unit of areas or estimated in form of persons per unit area. They are commonly stated in form of minimum or desirable standards. In this case, developers are not to go below the minimum standards while the desirable standards are the upper limit. The standards are formulated by statutory planning authorities and applied in the regulation of use and control of land and building development (Olujimi, 2008). Overarching objective is to attain an orderly spatial development, leading to sustainable urban land use. From this background, this introductory section begins by chronologically reviewing some of the previous studies undertaken on compliance with physical planning standards. The aim is to identify existing research gaps.
1.1. Review of Related Literature
Alnsour and Meaton (2009) examined the factors which impacted on to extent at which residential developments complied with physical planning standards in the Old Salt City, Jordan. They found out that the most flouted standards were Building Coverage Ratio (BCR), ventilation and housing typology, with reference to building materials, windows, doors and entrances to houses, a challenge instigated by demographic variables such as developers’ income, educational levels, household size and occupation. A further study by Rukwaro (2009) in Buru Buru Estate, Nairobi City County, Kenya, revealed that most violated standards, owing to poor development control included BCR, setbacks, inner courts areas, side and ear spaces, Floor Area Ratio (FAR) and recommended building heights. In Wa Township, Ghana, Ahmed and Dinye (2011) found out that 57% of developers who were aware of the recommended physical planning standards did not comply with them on account of inadequate development control. This study compares to that of Orgen (2010) who also investigated use of building plans in Ghana, and found out that over 90% of developers were using unapproved building plans, in consequence flouting recommended physical planning standards. In view of this, Elnaz, et al. (2012) sought to find out why most developments did not comply with the recommended FAR in Tehran Municipality, Iran. Results showed that noncompliance was mostly induced by developers’ lack of awareness on the requirement of the standard. A corresponding study by Opata et al (2013) in Kenya further enlightened that factors facilitating noncompliance included poverty, weak institutional framework, bureaucracy in plan approval, corruption and lack of capacity to undertake development control. In Asia, results of a study covering eight towns of Yavatmal District of Maharashtra State, India, undertaken Boob and Rao (2014) revealed that that 68.27% and 67.86% of violations were observed on left and right sides margins of plots; 56.60% on front margins; 63.83% on the back side margin; and 74.82% on FAR. Similarly, though developers had approved building plans, they did not comply with the recommended physical planning standards. These findings resonates with that of Karibasappa et al. (2016) in Bangalore, also in India, that established that average violations were 49%, 87.17%, 73.32%, and 98.36%, rear 38.93%, 51.61%, 68.29%, 53.9%, and 208.8% for road width, plinth height, building height, front setbacks, left setbacks, right setbacks, plot coverage and FAR respectively, attributable to lack of monitoring and enforcement. Recently, a study by Olufemi and Adebayo (2018) in Ado-Ekiti, Nigeria on conformity with development control regulations also established that 55.21% of developments encroached on setbacks and open spaces, a problem motivated by lack of effective development control, leading to challenges such as low environmental quality and loss of urban aesthetics.From the foregoing review, although most studies have acknowledged the significance of complying with physical planning standards along with demonstrating how they are infrequently complied with by developers, there is still scarcity in literature on how extent of compliance can be tested statistically, a gap filled in the current study.
1.2. Research Objective and Hypothesis
Based on the identified research gap, the objective of this study was to establish if residential developments in Kisii Town complies with the recommended BCR and FAR physical planning standards. The null hypothesis was that there was no statistically significant difference between recommended physical planning standards and their extent of compliance by developers in Kisii Town.
1.3. Scope of the Study
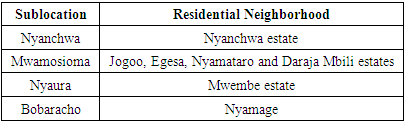
While the scope of the study in terms of compliance assessment covered FAR and BCR physical planning standards, the scope as regards to units of analysis on the other hand delved on residential developments in four sub-locations of Kisii Town, that is, Mwamosioma, Nyaura, Bobaracho and Nyanchwa. Table 1 relates each sublocation with their corresponding neighbourhoods.Table 1. Residential Neighbourhoods per Sub-location
 |
| |
|
Enforcing FAR and BCR in Kisii Town is generally envisioned to contribute towards fulfilling the following strategic spatial planning interventions:a) Regulating density or intensity of land use development. In this context, the higher the FAR and BCR values, the higher the floor area and coverage within the same plot, yielding to increased pressure on land and attendant infrastructural demands.b) Permitting establishment of increased provision for essential services such as on-plot parking and circulation, thereby promoting development control principles of safety and convenience. c) Maintaining the skyline line of the urban area, as a result promoting development control principal of aesthetics.d) Providing practising physical planners, architects and other relevant practitioners within the built environment with options of designing additional habitable and open urban spaces, thus enhancing quality of buildings along with increased monetary returns to the developer by maintaining the ratio of open space to built-up space. e) Increasing mandatory open spaces around the building which enables sufficient natural lighting and ventilation by reducing the amount of built-up environment, and so positively impacting on urban macro climate.The study was anchored on the Public Interest Theory of Regulation (PITR) which according to Christensen (2010) assumes that the economic markets are very fragile and have a tendency to operate inefficiently and in favour of individual’s concern while ignoring the importance of the society. For this reason, to direct and monitor the economic markets such as land, the State intervenes through enforceable regulations. Applied to the current study, PITR explicates why residential building developments in Kisii Town requires regulation, essentially to ensure compliance with recommended BCR and FAR physical planning standards. In this case, the County Government undertakes enforcement by assigning and restricting rights to development and improvements, and as such, development control intervenes in the processes of building development and occupancy.
2. Methods and Materials
2.1. Description of the Study Area
Kisii Town is located in Kenya, 120 km South of Kisumu City and about 400 km West of Nairobi, the capital city of Kenya. It covers an area of 35 km2 (Figure 1). The town’s population is approximately 93,959 with annual population growth rate of 2.7%, which is higher than Kenya’s average of 2.6%. It is also the most densely populated town in the western part of Kenya with 2,862 persons per square kilometre (Republic of Kenya, 2009). Administratively, the town is the headquarters of Kisii County, one of the 47 devolved county governments that collectively constitutes the Republic of Kenya. As regards spatial planning, the town is guided by a Physical Development Plan prepared in 1972.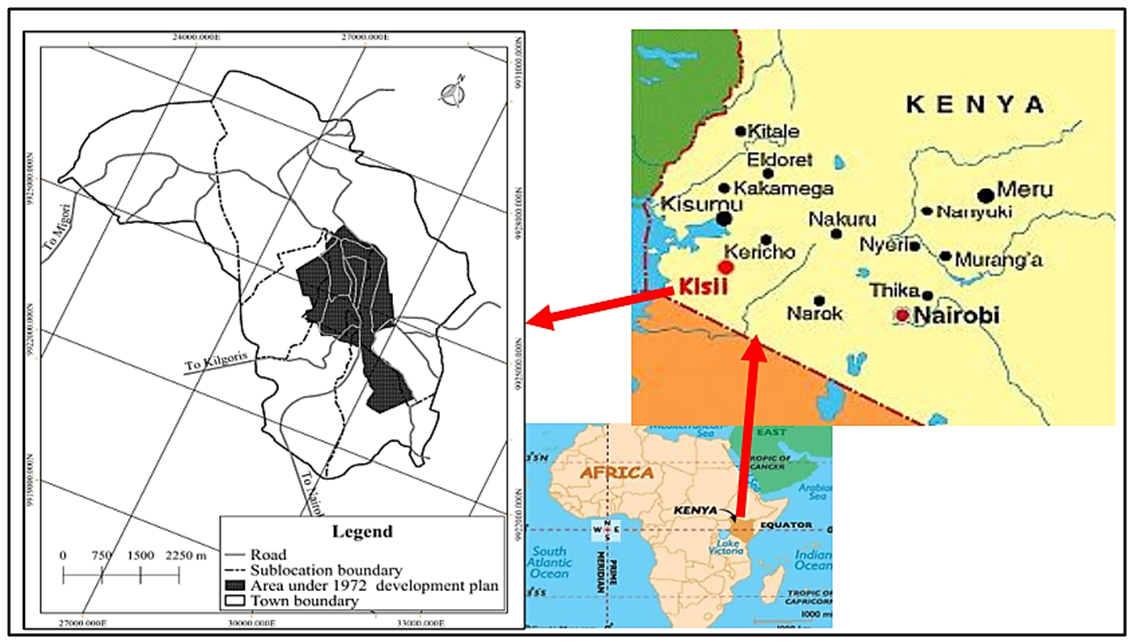 | Figure 1. Location of the study area |
The County Government of Kisii as a statutory planning authority has the mandate of formulating and enforcing BCR and FAR physical planning standards in the town as mandated by various legislations such as the Physical Planning Act (Cap 286), County Government Act (2012), Urban Areas and Cities Act (2012) and the Building Code (1968). Overall objective is to ensure compliance with the town’s approved physical development plan.
2.2. Computation of FAR and BCR
As illustrated (Figure 2), while FAR is defined as the ratio of total floor area divided by land (site) area (where total floor area means the total of all the floor space in a building), BCR refers to the ratio of the building area divided by the land (site) area, where building area means the floor space of a building when looking down at it from the sky.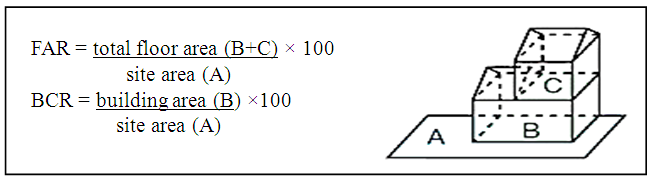 | Figure 2. Computation of FAR and BCR (Source: UN Habitat (2013)) |
2.3. Target Population
All items of inquiry, thus target population, comprised of 7,430 residential building developments.
2.4. Sample Size and Sampling Design
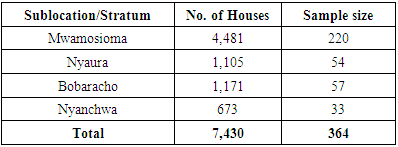
The study used stratified random sampling technique to sample 364 residential developments. In this type of sampling, Kothari (2004) suggests that population should be divided into several sub-populations that are individually more homogenous than the total and then items selected from each stratum to constitute a sample. In the current study, four sublocations formed the strata out of which proportional random samples were drawn from their residential neighbourhoods to attain the sample size of 364. These neighbourhoods included Jogoo, Egesa, Nyamataro and Daraja Mbili (Mwamosioma sublocation); Nyanchwa (Nyanchwa sublocation); Mwembe (Nyaura sublocation) and Nyamage (Bobaracho sublocation) (see table 1).Escamilla et al. (2014) suggested that because obtaining sampling frames for urban residential developments is always a challenge since such records are seldom maintained by relevant authorities, high resolution satellite images and geographic analysis software may be used to digitize each development within an area of interest in order to generate an accurate list inform of a representative sampling frame, which can then be used to draw random samples. Based on this recommendation, since there were no records maintained by the County Government of Kisii on the number of residential building developments in Kisii Town, their numbers were first identified using a high spatial resolution satellite image (pre-processed QuickBird-2, 0.34 metres spatial resolution) obtained from the Regional Centre for Mapping of Resources for Development (RCMRD), Nairobi, and thereafter digitized using QGIS software version 2.18.4 to establish a sampling frame in the form of feature attribute table. The process entailed delineation of sublocation boundaries of Kisii Town, followed by digitization of all building developments and thereafter spatial segregation of neighbourhood boundaries from respective sublocations. This was attained through a participatory mapping exercise incorporating Assistant Chiefs drawn from respective sublocations, thus giving credence that there were no overlaps in data collection. Warner (2015) justified that such participatory mapping approach has the advantage of collecting and agglomerating local knowledge of different people to create a high-resolution composite map that serves to provide a greater level of knowledge than can be achieved from traditional mapping methods. Ground truthing to ascertain that delineated boundaries were accurate in addition to confirming that digitized developments were residential was additionally undertaken. A total of 7,430 developments were successfully mapped from the neighbourhoods of the four sublocations. This formed the target population as well as provided the sampling frame for data collection (Table 2).Table 2. Sampling proportion per stratum for developers
 |
| |
|
To obtain a proportional representative sample size for residential developments per stratum (sub-location neighbourhoods), the number of buildings from each stratum was divided by the total number of buildings for all strata (7,430) and the product multiplied by desired sample size of 364 (Table 2). Because Mwamosioma sublocation (strata) was the largest, its four neighbourhoods (substrata) were further demarcated for sampling. These included Jogoo (4,481 buildings), Nyamataro (808 buildings), Egesa (821 buildings), and Daraja Mbili) (1,301), totalling to 4,481 buildings. Since the desired sample size for the sublocation was 220, to get the corresponding sample size for each neighbourhood, their respective number of buildings were further divided by total number of buildings in the sub-location (4,481) and the product multiplied by 220, resulting to sample sizes of 76, 40, 40 and 64 respectively for Jogoo, Nyamataro, Egesa and Daraja Mbili. Regarding other sublocations, in Nyaura, Mwembe was the only dominant neighbourhood. The same ensued in Bobaracho and Nyanchwa sublocations where Nyamage and Nyanchwa were respectively the only dominant neighbourhoods. Samples from each strata and substrata were afterward drawn using Random Number Table as provided by Saunders et al. (2003).
2.5. Data Collection and Analysis
2.5.1. Data Collection
Direct measurements were undertaken to establish if residential developers complied with the recommended BCR and FAR. To attain this, a structured direct observation checklist was used as recommended by Cohen et al (2007) that they enables the researcher to generate numerical data from the observations, which facilitates making of comparisons between settings and situations, and frequencies, patterns and trends to be noted or calculated. The adopted format for the checklist had four columns. While the first column described the physical planning standard under investigation, the second column indicated the value of the recommended physical planning standard. The third column recorded the observed/measured value in relation to the recommended value of the physical planning standard. The last column reported ensuing deviation, consequently showing the extent at which each physical planning standard was complied with by developers.
2.5.2. Data Analysis
The research objective was analysed using descriptive and inferential statistics that included means, standard deviation, one sample t-test and correlational analysis. As pointed out by Kim (2015), one-sample t-test is used to compare the mean score found in an observed sample to a hypothetically assumed value. Usually the hypothetically assumed value is the population mean. In the current study, mean score in observed sample was taken as the observed extent of compliance obtained through on site measurement for each sampled residential development, while the theoretically derived value was the value of recommended physical planning standard. Spatial analysis was also conducted using QGIS software to further describe extent of compliance within selected neighbourhoods. Reliability, that is, the degree to which results are consistent over time, thus an accurate depiction of the total population under study, was tested using intra-class correlation coefficient/test-retest, accomplished through an initial pilot survey outside the main sample area. The process entailed using the same observational checklist (with the two physical planning standards, that is, BCR and FAR) to undertake onsite measurements targeting same residential developments within a span of two weeks. The checklists for each onsite measurement was completed using different research assistants. Resulting inter-class correlations were respectively 0.89 and 0.92 for BCR and FAR, a score classified by Vieira and Garret (2005) as almost perfect agreement. This gave credence to research methodology.
3. Findings and Discussions
3.1. Recommended BCR and FAR in Kisii Town
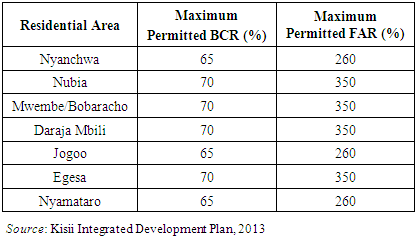
Recommended BCR and FAR physical planning standards per residential area that are currently used to enforce development control in Kisii Town by the County Government are presented in Table 3.Table 3. Recommended BCR and FAR in Kisii Town
 |
| |
|
3.2. Extent of Compliance with FAR and BCR
3.2.1. Nyanchwa Estate
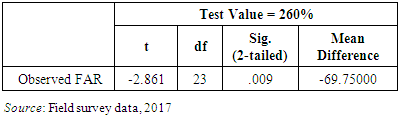
a) FARDescriptive results demonstrated that observed FAR (M = 190.25, SD = 119.43) was less than the recommended FAR (260%), in general portraying compliance. The proposition set for testing was that the mean of population (observed FAR compliance) was equal to the test value (recommended FAR of 260%). Results of statistical significance test however demonstrated that observed FAR was statistically significantly lower by -69.75 than recommended FAR standard of 260%, t (23) = -2.86, p = .009, further corroborating general compliance (Table 4).Table 4. One sample t test on FAR compliance, Nyanchwa
 |
| |
|
Although the above test creates a general impression that compliance with the standard was not widely flouted, perception changes substantially if each case is examined individually. In this context, it was found out 42% of developers failed to observe the recommended FAR, hence revealing inadequate development control.b) BCRIn relation to BCR, results of descriptive one-sample statistics revealed that observed mean BCR (M = 76.625, SD = 24.054) exceeded the recommended BCR (65%), and was at the same time statistically significant, t (23) = 2.368, p = .027. Compliance therefore declined by a mean difference of 11.625. These observations were further demonstrated both graphically and spatially (Figure 3 and Figure 4).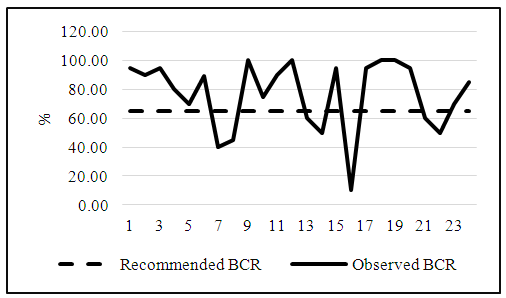 | Figure 3. Descriptive variations in BCR compliance in Nyanchwa (Source: Field survey data, 2017) |
The graphical presentation shows that most observed BCR were above the test value of 65% (Figure 3). A similar consequence is depicted spatially from a neighbourhood within Nyanchwa w most noncomplying buildings coalescing around key educational institutions such as Nyanchwa Boys High School, Nyanchwa Mixed Primary School and Nyanchwa Adventist College (Figure 4).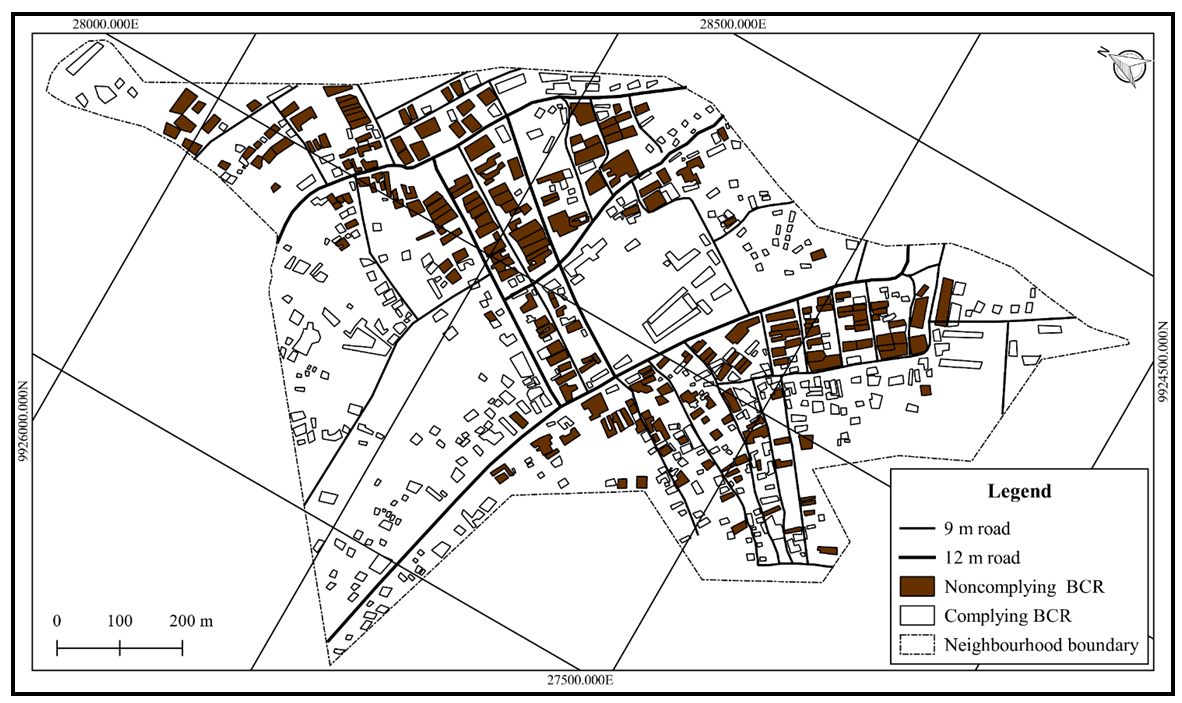 | Figure 4. Spatial variations in BCR compliance, Nyanchwa Estate (Source: Field survey, 2017) |
3.2.2. Mwamosioma Sublocation
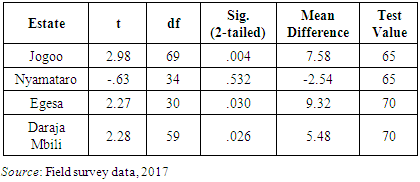
Mwamosioma, the largest sublocation in Kisii Town has four residential neighborhoods namely Jogoo, Egesa, Nyamataro and Daraja Mbili. The following subsections presents research findings on the extent at which BCR and FAR were complied with by developers in these neighbourhoods.a) BCRJogoo and Nyamataro are classified as medium density residential neighborhoods with a BCR of 65%. Conversely, Egesa and Daraja Mbili are zoned as high density development with respective BCR of 70%. Descriptive statistics showed that at Jogoo, the existing BCR (M = 72.59, SD = 21.31) exceeded 65%. However, in Nyamataro, observed BCR (M = 62.46, SD = 23.81) was less than 65%. In Egesa, the observed BCR (M = 79.32, SD = 22.85) surpassed the recommended 70%. Relatively, in Daraja Mbili, the average BCR (M = 75.48, SD = 18.68) exceeded recommended BCR, as the case of Egesa, of 70%. Proportionally, in Jogoo, while 37.2% of developers complied with the set BCR, 51.3% flouted the same. At Nyamataro, 57.1% did not exceed the standard compared to 40% who did. Similarly, only 25.8% of developers in Egesa did not exceed BCR of 70% compared to 74.2% who exceeded. A similar trend was observed in Daraja Mbili where only 36.1% of developers complied with BCR of 70% compared to 63.9% who surpassed the same.A one-sample t-test was as a result run to determine whether observed BCR were different from normal/test values, defined as recommended BCR for Jogoo (65%), Nyamataro (65%), Egesa (70%) and Daraja Mbili (75) (Table 5). Observed BRC were normally distributed, as assessed by Shapiro-Wilk test.Table 5. One sample t-test on BCR, Mwamosioma sub-location
 |
| |
|
Above Table shows that BCR in Jogoo was statistically significantly higher by 7.58 than recommended BCR of 65, t (69) = 2.98, p = .004. On the other hand, BCR for Nyamataro was also statistically insignificantly lower by 2.54 than recommended BCR of 65, t (34) = 2.98, p = .532. In Egesa, BCR was statistically significantly higher by 9.32 than recommended BCR of 70, t (30) = 2.27, p = .030. Finally in Daraja Mbili, BCR was as well statistically significantly higher by 5.48 than recommended BCR of 70, t (59) = 2.28, p = .026. Spatial analysis was further conducted in a selected neighbourhood within the precincts of Jogoo to further illustrate the magnitude of the problem (Figure 5).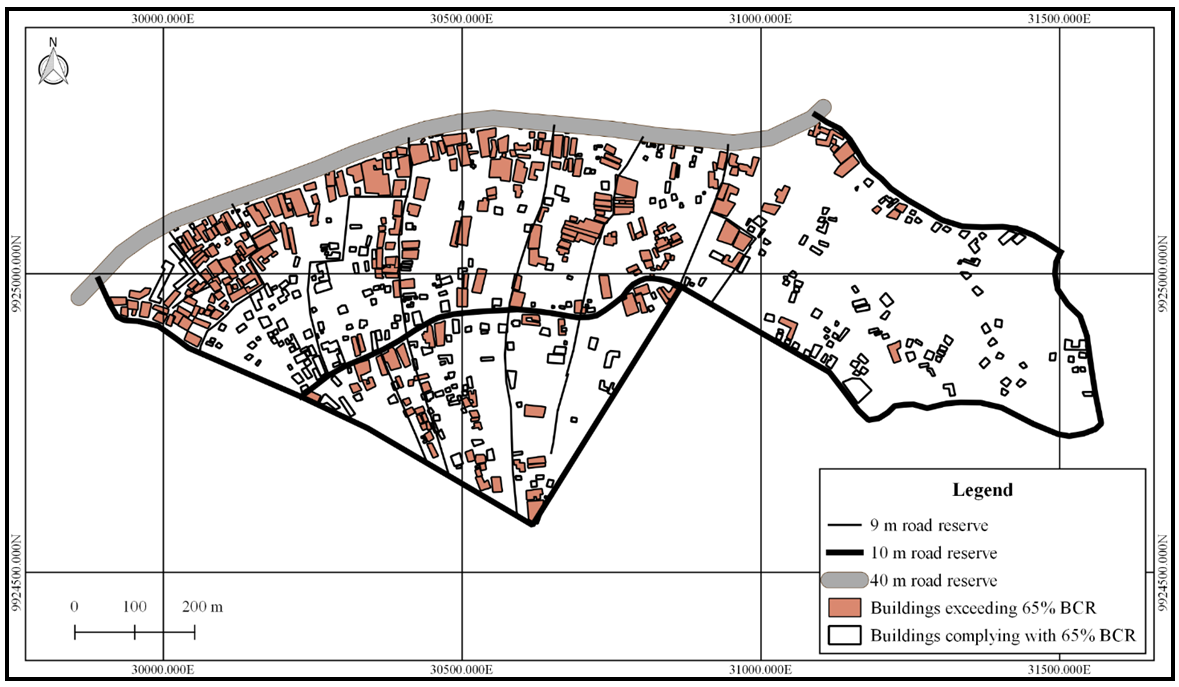 | Figure 5. Extent of spatial compliance with BCR in Jogoo (Source: Field survey, 2017) |
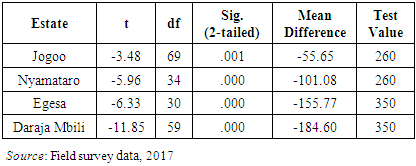
It can be seen in Figure 3 that most residential developments failed to comply with the recommended minimum BCR of 65%, attributable to inadequate development control by the planning authority. It is generally observed that immense majority of nonconforming buildings were located along key transportation corridors with a particular reference to the 40 metre wide Kisii –Nyamira Road, owing to ease of access to Kisii Town centre. b) FARWhile recommended FAR for Jogoo and Nyamataro was 260%, in Egesa and Daraja Mbili, the standard was 350%. Descriptive statistics on extent at which these neighborhoods complied with the standard showed that mean FAR for Jogoo (M = 204.34, SD = 133.79) was within the recommended FAR of 260, signifying overall conformity. However, when specific compliance for each sampled development was examined, it emerged that while 18.6% exceeded the set FAR of 350%, 80% complied with it. Likewise, in Nyamataro, observed FAR (M = 158.91, SD =100.26) was additionally lower than the recommended FAR of 260, again giving a picture of an overall compliance with the standard. Nevertheless, as the case of Jogoo, analysis of each sampled residential development showed that 20% of developers flouted the standard. In Egesa, observed mean (M = 194.22, SD = 136.93) was also within the recommended FAR of 360%, so was the case of observed mean for Daraja Mbili (M = 136.93, SD = 120.60), yet information from sampled individual developers from the two neighborhoods (Egesa and Daraja Mbili) showed that 16.1% and 9.8% of developers respectively flouted the recommended FAR of 350%. Further analysis on significance of the observed deviations was conducted using one sample t-test (Table 6).Table 6. One sample t-test on FAR, Mwamosioma sub-location
 |
| |
|
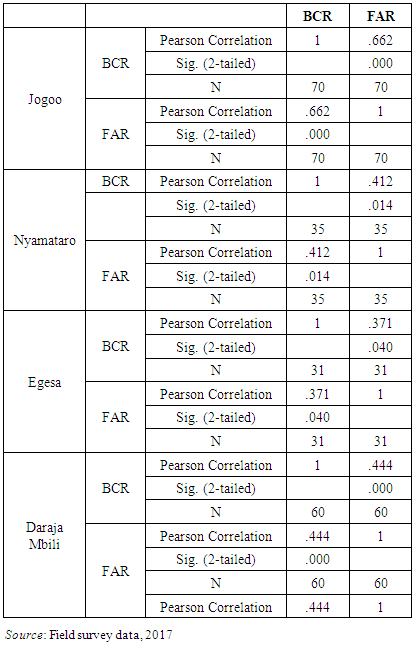
Results showed that in Jogoo, observed FAR was significantly lower by -55.65 than recommended FAR, t (69) = -3.48, p = .001. In Nyamataro, observed FAR was also significantly lower by -101.08 than recommended FAR, t (34) = -5.96, p = .000. The same applied to Egesa where observed FAR was as well significantly lower by -155 than recommended FAR of 260, t (30) = -6.33, p = .000. In Daraja Mbili, observed FAR was additionally significantly lower by -184.60 than recommended FAR, (59) = -11.85, p = .000. The study thus sought to determine if there were any statistical significant correlations between FAR and BCR (Table 7). Research findings demonstrated a positive and significant correlations between BCR and FAR, for each neighbourhood, where, Jogoo (r = .662, p = .000); Nyamataro (r = 412, p = .014), Egesa (r = .371, p = .040) and Daraja Mbili (r = .444, p = .000), revealing that as BCR increases, the size of available space in a plot reduces, as a result, developers opts for vertical development in an attempt to leverage on financial returns per additional floor area.Noncompliance may have occasioned owing to the fact that 92.6% of developers were not aware of any applicable physical planning standard in Kisii Town.Table 7. Correlation between FAR and BCR, Mwamosioma sub-location
 |
| |
|
3.2.3. Nyaura and Bobaracho Sublocations
Compliance with recommended physical planning standards in Nyaura and Bobaracho sub-locations were jointly analysed for the reason that their applicable BCR and FAR were the same. Whereas the notable residential neighbourhood in Nyaura sub-location is Mwembe, Nyamage on the other hand is the major neighbourhood in Bobaracho sub-location. a) BCRApproved maximum BCR for Mwembe and Nyamage was 70%. The two neighborhoods are classified as residential with permitted high density development of muilti-family dwelling units. Descriptive one sample statistics indicated that observed BCR compliance means for Mwembe and Nyamage (M = 84.35, SD = 19.11; M = 82.00, SD = 16.22) apparently exceeded the recommended planning standard/test value of 70%. Additionally, when each development was examined on a case by case basis, it was found out that in Mwembe, 80% of developers exceeded the prescribed BCR. The same trend came to light in Nyamage where a majority of developers (83%) exceeded the recommended BCR. Noncompliance with BCR may suggest why most residential plots in these neighborhoods are congested, as illustrated, on account of insufficient development control (Figure 6).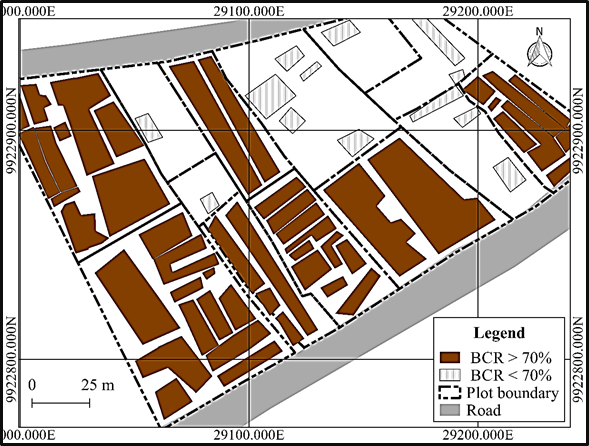 | Figure 6. Extent of spatial compliance with BCR in Jogoo (Source: Field survey, 2017) |
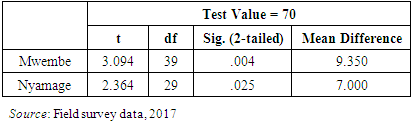
As shown, the spatial analysis demonstrates that one of the challenges affecting sustainable urban development in Mwembe and Nyamage is continuous noncompliance with recommended BCR. In the cited example, the current state precipitates other logistic challenges such as lack of adequate space for car parking, provision of utilities and inaccessibility of structures during unforeseen disasters, in consequence negating development control objectives of access, convenience, safety and more important, compliance.. A further analysis was conducted using one-sample t-test to determine the significance of the observed deviation. Results demonstrated that in Mwembe, the mean difference (9.35) was highly significant, t (39) = 3.09, p = 0.00. The same applied to Nyamage where the mean difference was also highly significant (7.00), t (29) = 2.36, p = 0.03. Both test results corroborated that the means between the observed and the test variable (70%) were significantly different from zero, thus denoting noncompliance by developers. This additionally discloses that enforcement of BCR as a physical planning standard in these neighborhoods by the County Government of Kisii so far remains inadequate (Table 8).Table 8. Significance test for BCR conformity, Mwembe and Nyamage
 |
| |
|
b) FARThe recommended maximum FAR for Mwembe and Nyamage was 350%. Results postulate that both observed means for Mwembe and Nyamage (M = 205.25, SD = 127.48; M = 203.00, SD = 119.29) were less than the test value of 350%. On the face of it, this gives an impression that on average, most developers did not exceed this standard. However, in order to obtain a detailed variation on compliance, descriptive statistics for each sampled development was scrutinized to determine the developments which were within and beyond the recommended FAR. Results postulated that in Mwembe, while 85% of developers were within the threshold of 350%, 15% on the other hand exceeded the limit. The highest recorded FAR was 500%, while the lowest was 40%. In contrast, in Nyamage, 57% of residential developers were within the confine of 350% compared to 43% who surpassed the set standard. On the other hand, the highest recorded FAR in Nyamage was 450% and the lowest 20%. Implications of nonconformity with recommended FAR standard was also demonstrated pictorially (Figure 7).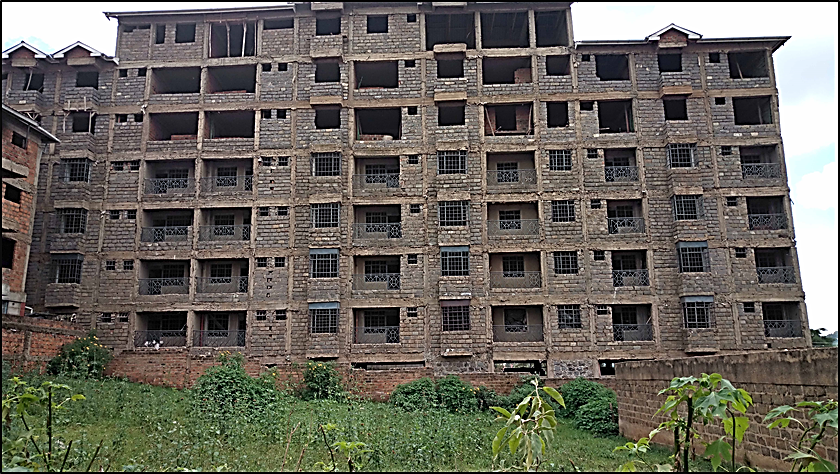 | Figure 7. Apartment blocks exceeding recommended FAR and BCR (Source: Field survey, 2017; Note - The photograph describes blocks of multi-family dwelling units under construction which disregards all recommended physical planning standards with a particular mention to BCR and FAR.) |
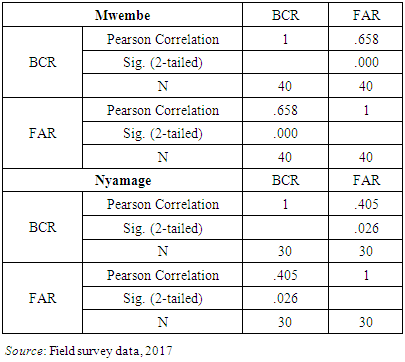
After observing the extent of noncompliance as regards FAR, analysis was undertaken to determine their statistical significance. Results confirmed that while the mean difference in Mwembe (-144.8) was highly significant, t (39) = -7.18, p = 0.00, the same applied to Nyamage where the mean difference of -147.0 was also significant, t (29) = -6.75, p = 0.00. This shows that on average, most developers did not flout the prescribed minimum FAR and was further validated by the fact that when sampled developments were individually analyzed, only 13% and 15% in Nyamage and Mwembe respectively exceeded the standard. Noncompliance may be explained by the fact that most developers were not aware of the standard as well as the current Kisii Town Physical Development Plan. As a consequence, using Pearson bivariate correlation, the study established if a correlation ensued between FAR and BCR. Results indicated that in Mwembe, there was a positive correlation between FAR and BCR, which was significant (r = .658, p = .000). The same occurred in Nyamage (r = .405, p = .026), showing that as BCR increases, available space for development reduces, thus, developers are motivated to increase the number of floors through vertical developments so as to maximize on anticipated residential rental income (Table 9).Table 9. BCR and FAR Bivariate correlation, Mwembe and Nyamage
 |
| |
|
3.2.4. Summary on Compliance with BCR and FAR
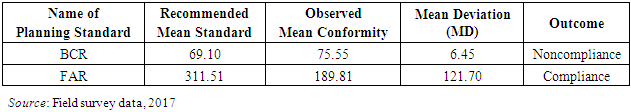
From the foregoing analysis, a summary is presented indicating the extent to which each recommended physical planning standard was complied with. Since same standards (for example BCR) could have had different requirements depending on the neighbourhoods’ characteristics (for example 65% for Nyamataro and 75% for Jogoo), recommended mean standard was taken as the average for the same standard across all residential neighbourhoods where data was collected. The same concept as well applied to observed mean compliance (Table 10).Table 10. Overall compliance with physical planning standards
 |
| |
|
When it comes to enforcement, developers are expected not to go below the minimum physical planning standards while the desirable standards are the upper limit. (Olujimi, 2008). Results maintains that on average, only FAR (MD =121.70) was complied with by developers. Notwithstanding this perception, when sampled residential developments were individually analysed, it was established out that 42%, 18.6%, 20%, 16.1%, 9.8%, 15% and 43% in Nyanchwa, Jogoo, Nyamataro, Egesa, Daraja Mbili, Mwembe and Nyamage did not respectively comply with the recommended FAR. The planning standard on BCR nevertheless registered a high noncompliance (MD = 6.45).
3.2.5. Test of Research Hypothesis
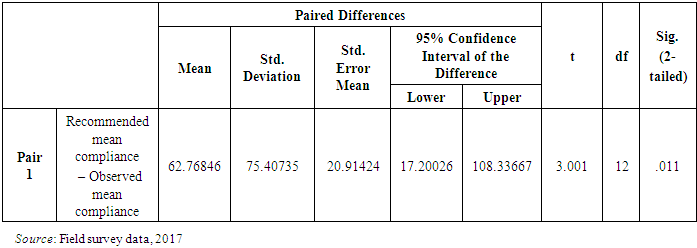
The research hypothesis stated that there was no statistically significant difference between recommended BCR and FAR physical planning standards and their extent of compliance by developers in Kisii Town. It was tested using paired sample t-test. Whereas the first pair was the mean of each of the two (2) recommended physical planning standards in the seven (7) neighbourhoods, the second pair comprised the observed mean conformity, likewise for each of the two (2) recommended physical planning standards per seven (7) residential neighbourhoods. The test found a statistically significant difference between the recommended physical planning standards (M=199.62, SD = 130.26) and their extent of compliance by residential developers (M = 136.84, SD = 60.21), t (12) = 3.001, p = .011 The null hypothesis was therefore rejected at 95% confidence level since on average, compliance with the recommended physical planning standards in the study area significantly declined by a mean of 62.769, an indication of inadequate development control by the County Government of Kisii (Table 11). If the existing state of affairs remains, it is anticipated that the challenge is bound increase in a foreseeable future at the detriment of the envisioned sustainable development control framework in Kisii Town.Table 11. Significance test for the research hypothesis
 |
| |
|
4. Conclusions
Development control as currently enforced by the County Government of Kisii has not ensured that developers comply with recommended physical planning standards. This negates section 29 (a) of the Physical Planning Act (Cap 286) that empowers the County Government to prohibit or control the use and development of land and buildings in the interests of proper and orderly development. The problem continues irrespective of other existing policy guidelines and legislative frameworks that grants the mandate of undertaking development control. This undermines the implementation of the current Kisii Town Physical Development Plan owing to the fact that conformity to its approved development zones can only be effectively implemented if applicable physical planning standards, with a particular mention of BCR and FAR, are judiciously enforced. Challenges in enforcement aggravates due to the fact that the current physical development plan is not only outdated (prepared in 1972), but likewise covers a paltry 12.79% of the town’s spatial extent of 35 km2. This insinuates that 87.21% of the town remains unplanned, as such, lacking policy guidelines in terms of physical planning standards which can be used in enforcing development control. The problem exacerbates due to the fact that development control as a process in Kisii Town is concurrently handled by other County Government departments. For example, the National Construction Authority (NCA) which is established under the National Construction Authority Act (2012) is mandated to promote quality assurance in the construction industry. This includes compliance with physical planning standards such as FAR and BCR. At the same time, the National Environment Management Authority (NEMA) also plays a pivotal role in approval of residential building developments through issuance of Environmental Impact Assessment (EIA) licenses whose Environmental Management Plans (EMP) forms the basis for enforcing building development control. The Public Health Act (Cap 242) further empowers the County Public Health Officer to also approve and subsequently inspect proposed building developments. Lack of coordination among these stakeholder departments significantly contributes to noncompliance with physical planning standards by creating a gap in enforcement, a circumstance where some developers ignore or bypass other departments while obtaining development permission, and in so doing contributing towards unregulated land use change. The prevailing state of affairs further create room for non-registered practitioners such as architects to participate in development control process, consequently failing to appropriately advice developers on the need to observe compliance with recommended BCR and FAR. The following recommendations are therefore made towards ensuring compliance with BCR and FAR in the study area:a) In consultation with key stakeholders, the current physical development plan should be revised at the earliest opportunity to cover the entire town. The revised development plan should specifically be delineated into distinct zoning districts, each with specific BCR and FAR physical planning standards that relates to each residential neighbourhood. The objective is to ensure that physical planning standards applies to the entire spatial extent of Kisii Town.b) While granting development permission, at all times, the approving authority should clearly indicate the BCR and FAR physical planning standards that each developer should comply with. It was observed during the field survey that most granted residential development permissions did not stipulate applicable BCR and FAR physical planning standards.c) The County Government, upon approval of development permission, should at regular and planned intervals monitor building development process, to promote quality assurance and enhanced compliance with BCR and FAR physical planning standards.d) Kisii Town has only two physical planners. The County Government of Kisii should therefore prioritise and develop its capacity in physical planning by recruiting adequate physical umber of planners, a strategy for improving spatial planning, monitoring and enforcement of physical planning standards. The physical planning sector should not be seen as subsidiary to other sectors since it should at all times precede socio-economic planning.e) The County Government should establish a County Spatial Planning Coordinating Committee (CSPCC) to harmonize and coordinate multiple institutions and related agencies that deal with development control processes in the study area. This is envisaged to eliminate overlaps in approvals and policy formulation.This study has therefore contributed to the existing body of planning literature by demonstrating how compliance assessment with recommended physical planning standards may be statistically analysed, a departure from previous approaches which are largely limited on descriptive analysis.
References
| [1] | Ahmed, A., and Dinye, R.D. (2011). Urbanization and the challenges of development controls in Ghana: A case study of Wa Township. Journal of Sustainable Development in Africa, 13 (7), 210-235. |
| [2] | Alnsour, J., and Meaton, J. (2009). Factors affecting compliance with residential standards in the City of Old Salt, Jordan. Habitat International. 33, 301–309. |
| [3] | Boob, T.N., and Rao, Y.R.M. (2014). Zoning within plot–an approach to land sub division to control violation of development control rules. International Journal of Multidisciplinary and Current Research, 2 (4), 48-59. |
| [4] | Christensen, J. G. (2010). Public interest regulation reconsidered: From capture to credible commitment. A paper presented at the 3rd Biennial Conference, University College, Dublin, 17th-19th June, 2010. Retrieved from http://www.regulation.upf.edu/dublin-10-papers/1J1.pdf. |
| [5] | Elnaz, S., Ayyoob, S., Mojtaba, R., Mohammad, B., and Akito, M. (2012). An investigation of the reasons for non-compliance with FAR regulations in Tehran. Cities, 223–233. |
| [6] | Escamilla, V., Emch, M., Dandalo, L., Miller, W., Martinson, F., and Hoffman, F. (2014). Sampling at community level by using satellite imagery and geographical analysis. Bull World Health Organ, 690–694. |
| [7] | Karibasappa, H., Arun, A.T., Jayakkumaran, B., and Jegan. M. (2016). Violation of development control rules and regulations: A case study at Neeladri Nagar, Electronic City Phase-1, Bangalore-560100. Journal of Mechanical and Civil Engineering (IOSR-JMCE), 2 (3), 8-12. |
| [8] | Kim, T.K. (2015). T-test as a parametric statistic, KJA Korean Journal of Anesthesiology, 68(6): 540-546. |
| [9] | Kothari, G.R. (2004). Research methodology, methods and techniques (second revised edition). New Age International (P) Limited Publishers: New Delhi. |
| [10] | Kisii County Integrated Development Plan, 2013-2017. (2013). |
| [11] | Olufemi, O.F., and Adebayo, A. (2018). Development control regulations compliance: Paradigm Change to Reinvent Disrupted Public Spaces and Make Future Great Place in Ado-Ekiti, Nigeria. Civil Engineering and Architecture 6(1): 1-17. |
| [12] | Olujimi, J.A.B. (2008). Administration of physical planning in Nigeria: The Ondo State experience. Landscape and Urban Planning Journal, 25, 115 – 126. |
| [13] | Opata, G., Mulongo, L., Omuterema, S., and Ngetich, J.K. (2013). Urbanization and urban environmental development control policies and practices in Kenya. Research Journal in Organizational Psychology and Educational Studies, 2(3), 132-138. |
| [14] | Orgen, N.K. (2010). An investigation into the use of unapproved drawings in the construction industry in Ghana In: Laryea, S., Leiringer, R. and Hughes, W. (Eds) Proceedings of West Africa Built Environment Research (WABER) Conference, 27-28 July 2010, Accra, Ghana, 153-65. |
| [15] | Republic of Kenya (1999). Population and Housing Census Surveys. Nairobi, Government Printer. |
| [16] | Republic of Kenya (1996). Physical Planning Act. Nairobi: Government Printer. |
| [17] | Republic of Kenya (2012). Public Health Act (Cap 242). Nairobi: Government Printer. |
| [18] | Republic of Kenya (2012). National Construction Authority Act. Nairobi: Government Printer. |
| [19] | Republic of Kenya (2012). County Government Act. Nairobi: Government Printer. |
| [20] | Republic of Kenya (1968). The Building Code. Nairobi: Government Printer. |
| [21] | Republic of Kenya (2012). Urban Areas and Cities Act. Nairobi: Government Printer. |
| [22] | Republic of Kenya (1999). Population and Housing Census Surveys. Nairobi: Government Printer. |
| [23] | Rukwaro, R.W. (2009). Owner occupier and violation of building by-laws. Habitat International, 33, 485-498. |
| [24] | Saunders, M., Lewis, P., and Thornhill, A. (2003). Research methods for business students. Edinburgh: Prentice Hall. |
| [25] | UN Habitat. (2013). State of the world’s cities 2012/2013: Prosperity of Cities. UN-Habitat: Nairobi. |
| [26] | Viera A J, Garrett JM. (2005) Understanding interobserver agreement: the kappa statistic. Fam Med, 37(5): 360-3. |
| [27] | Warner, C. (2015). Participatory Mapping: a literature review of community-based research and participatory planning. Retrieved from http:/web.mit.edu/cwarner/www/SocialHubfinal.pdf. |

 Abstract
 Reference
 Full-Text PDF
 Full-text HTML