A. B. M. Golam Rabbany1, Samiul Islam2, Md. Hasan-Uz-Zaman3
1Civil Engineering Department, Tung Hing (BD) MFY Ltd, Comilla, Bangladesh
2Structural Engineering Department, Hifab International AB, Dhaka, Bangladesh
3Engineering Department, Northern Techno Trade, Dhaka, Bangladesh
Correspondence to: A. B. M. Golam Rabbany, Civil Engineering Department, Tung Hing (BD) MFY Ltd, Comilla, Bangladesh.
| Email: |  |
Copyright © 2018 The Author(s). Published by Scientific & Academic Publishing.
This work is licensed under the Creative Commons Attribution International License (CC BY).
http://creativecommons.org/licenses/by/4.0/

Abstract
Actually no particular theory or method is perfect for pile cap design. Strut & Tie Model (STM) is more reliable to design a pile cap; considering the pile cap as a deep beam. But in STM approach punching shear cannot be checked directly. Column size may be different in many cases but the punching shear value cannot be separated from STM approach. To get details calculation of punching shear, beam method can be used. During design work the column load may be changed for some reasons (Architectural purpose or client requirements). With the change of column load and pile spacing, strut & tie forces are changed in a significant amount. In this study the changing pattern / behavior of strut & tie forces would be studied which may help the designer to predict the pile cap capacity in different consequences. In this study, spacing as per CRSI handbook 2008 is used. Strut & tie model is used to design a typical pile cap here. Beam theory is also used to check the punching shear.
Keywords:
Strut & Tie model, Pile cap, Pile spacing
Cite this paper: A. B. M. Golam Rabbany, Samiul Islam, Md. Hasan-Uz-Zaman, Pile Cap Performances in Different Consequences, Architecture Research, Vol. 8 No. 2, 2018, pp. 51-61. doi: 10.5923/j.arch.20180802.02.
1. Introduction
1.1. Background of This Study
(a) Pile cap design by beam method gives a very lower value of pile cap depth which generally cannot be used practically. And the Reynolds chart gives an empirical formula about pile cap depth which is uneconomical in some cases. But in strut & tie model the depth is quite sufficient which can be practically used by the designer. This study includes the comparative result study using different method to select an optimum pile cap depth which is a governing factor of pile cap performances. It may help the designer to select a safer and economical dimension of pile cap.(b) During design work the column load may be changed for some reasons (Architectural purpose or client requirements). With the change of column load; strut & tie forces are changed in a significant amount. In this study the changing pattern / behavior of strut & tie forces would be studied which may help the designer to predict the pile cap capacity in different consequences and give sufficient information regarding the revision of pile cap design.
1.2. Pile Spacing
Pile spacing depends on different factors. Geotechnical engineers make their decision as per field condition and different lab test and analysis (Which is not covered in this study). The center to center distance of pile is related to different factors such as type of pile (Friction pile, end bearing pile etc.) type of soil (Less compressive soil, high compressive soil etc.). The small change in pile spacing initiates a significant change in pile cap design which is directly related to economy & safety. In usual practice piles are spaced 2.5 times the diameter for the end bearing piles or 3.0 times the diameter for friction pile. [6] When bending moments are large it may become more economical to increase the spacing of piles. [6] But not neglecting the CRSI handbook guidelines [1].
2. Guideline
Before proceeding for calculation, at first some guidelines are to be studied. From CRSI handbook 2008, pile spacing and edge distance (Ed) can be fixed from Figure 1.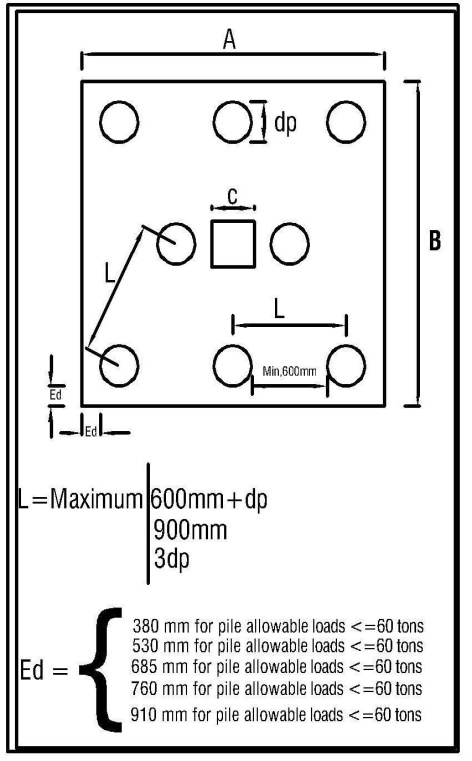 | Figure 1. Pile spacing and edge distance guideline as per CRSI handbook 2008 |
Previously one way shear & two way shear are calculated at d/2 distance from the column face but in recent days both the shear is calculated at the face of column [3].This small change in shear location has a significant effect in the depth of pile cap calculation. Comparison from experimental result indicates that the traditional flexural design for beams and two way slabs are unconservative for deep pile caps. [3] In this study the shear is calculated at the face of column.Clear cover: A cover of 75 mm is usually provided for the pile cap surfaces in contact with earth. In marine situations the cover should be increased to a minimum of 80 mm.
3. Design of Pile Cap
3.1. Deep Beam Concept
A beam is considered as a deep beam if the span and depth ratio is less than or equal to 4.(APPENDIX-A of ACI-318 Strut and tie Method code provisions)Any reinforced concrete structures may be divided into B-regions and D-regions. In B-regions beam theory is valid but in D-regions discontinuities affect member behavior. Deep beams are an example of having D-regions. The Strut & Tie model is conceptually simple and is generally regarded as an appropriate approach for the design of D regions. [5] Pile cap generally considered as deep beam. The pile spacing is considered as the span.
3.2. Design Methodology
3.2.1. Strut & Tie Model
Strut & Tie model is used to calculate the strut capacity & tie reaction. The designer is required to approximate internal stress fields with an idealized truss, which is constructed from uniaxial concrete struts and reinforcement ties and concrete nodal zones. [4] If the angle between the strut & tie is θ (In Figure 2 the strut is AC and tie is CB), then Strut force = Reaction/Sin θ Tie force = Reaction/Tan θθ = 0.75 is used for struts & tiesACI code 11.8.3 limits the nominal shear strength of deep beam to 10 √ f'c bwDpThis limit should be checked at the beginning of design.Load capacity or nominal shear strength,  | (1) |
Here, bw = width of deep beam which is equal to pile diameter (dp) in inch, Dp = depth of pile cap in inch, f'c = concrete compressive strength (in psi).The angle between strut & tie should be more than 25° [2]. For equilibrium at least 3 forces act in nodal zone. A model with shortest tie and least tie forces is the most effective arrangement in pile cap. [6]Another important point is that struts and ties cannot resist bending moments. Bending moments applied at the top of column can be replaced by a set of axial loads [6]. Other step can be done as usual.
4. Example Calculation
4.1. Case 1
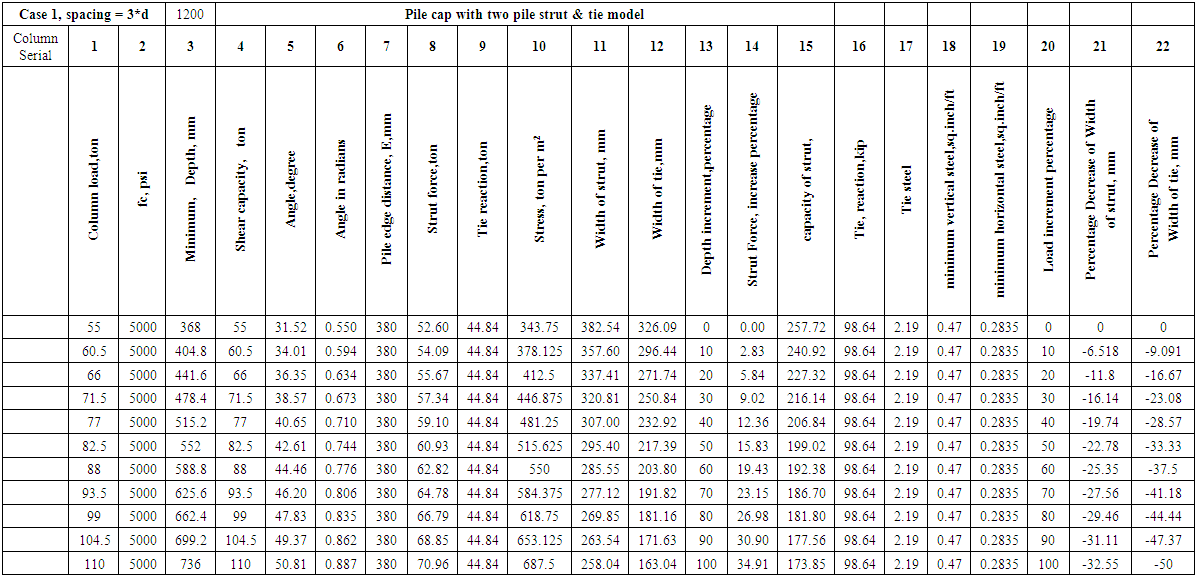
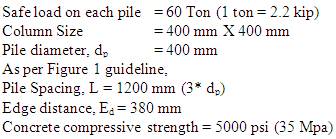 From the calculation Table 4 in Appendix A, for column load 55 ton (Loading pattern and other measurement shown in Figure 2 & 3), minimum pile cap depth is 368 mm. (Using strut & tie model) and for the same pile (Dia 400 mm), pile cap depth is 900 mm as per the Reynolds chart [8] (Shown in Table 1).
Table 1. Reynolds guideline of pile cap depth
 |
| |
|
 | Figure 2. Pile cap (02 piles) with strut & tie model (STM) approach |
 | Figure 3. Reaction and forces on the two (02) piles by strut (AC & AB) & tie (CB) at an angle between strut & tie |
Comparing this two values we can choose the depth of pile cap as 900 mm for safety but it is uneconomical.
4.2. Case 2
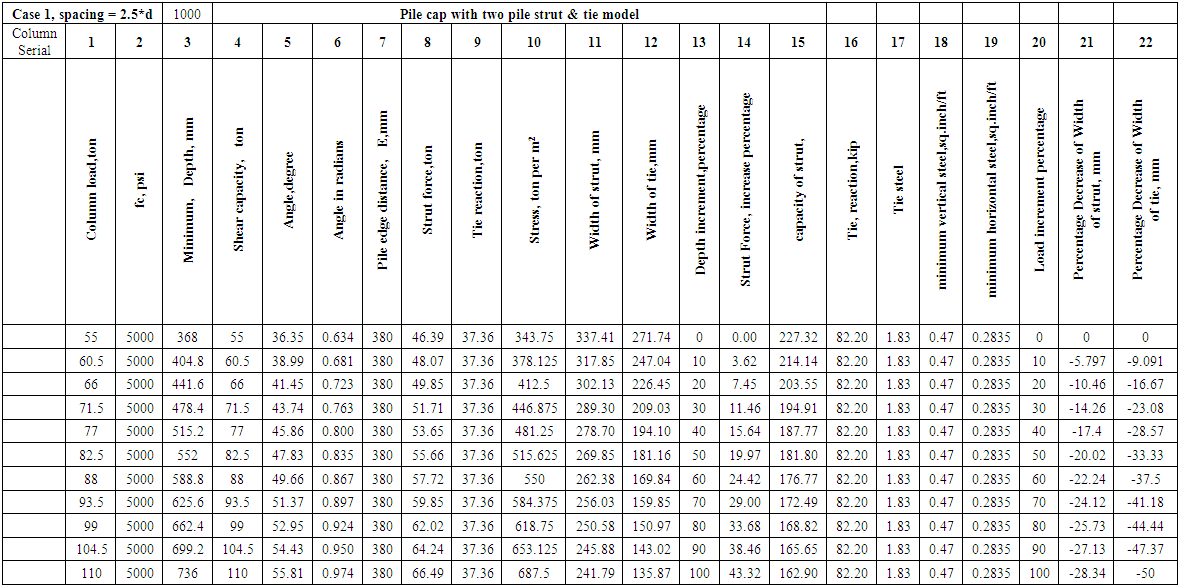
Other parameters are same as case 1, only pile spacing changes from 3 dp to 2.5 dp (Details calculations shown in Table 5 in Appendix A).
4.3. Case 3
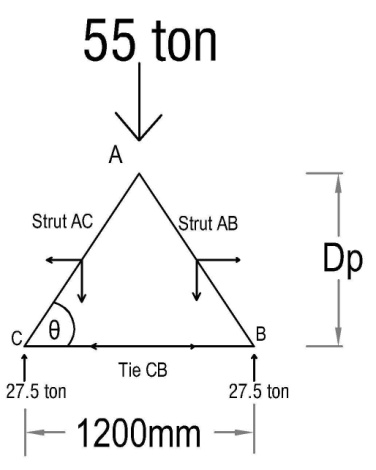
In this case, the column load 220 ton is selected to compare the effect easily because each pile has to be carried same load 55 ton as like as in case 1. Pile dia, spacing and other parameters are as like as case 1.  | Figure 4. Pile cap with 12 piles, column load 220 ton, and each pile contribution 55 ton |
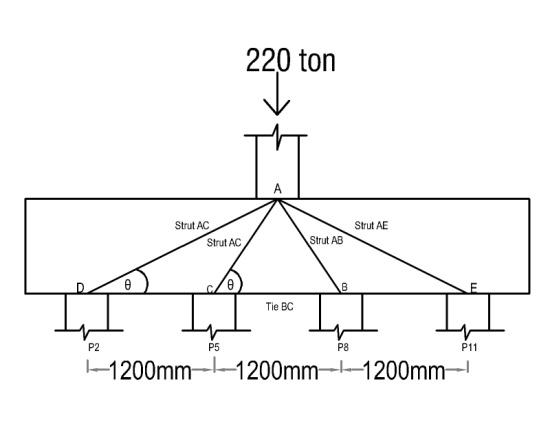 | Figure 5. STM approach in pile group P2-P5-P8-P11 and one possible strut & tie formation pattern (Pattern may vary with the designer’s choice) |
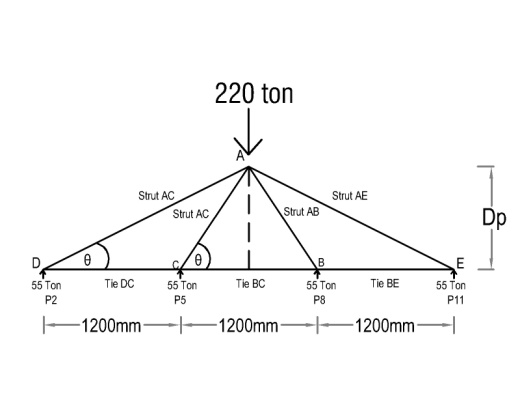 | Figure 6. Reaction and forces in case of pile spacing 3dp in pile group P2-P5-P8-P11 |
4.4. Case 4
The pile spacing is 2.5dp and all parameters are as like as Case 3.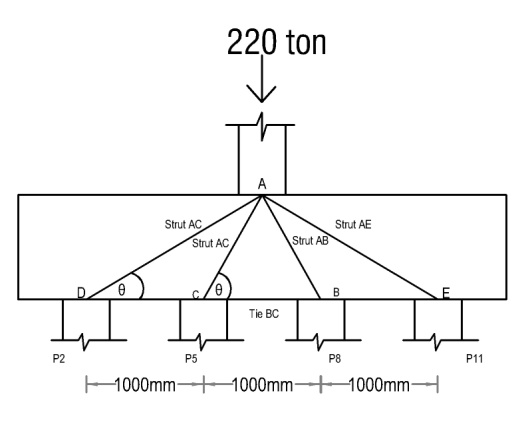 | Figure 7. Strut & tie forces in case of pile group in P2-P5-P8-P11 in both Case 3 & Case 4 (Spacing 3dp & 2.5dp) |
5. Result Analysis
5.1. Result Analysis from Table 4
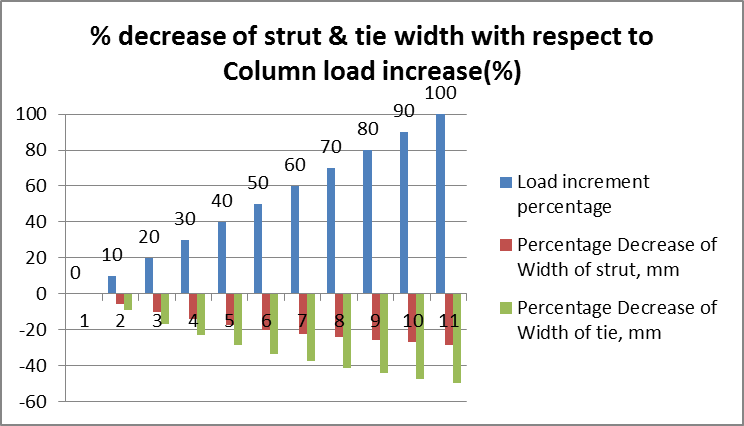
For case 1`Two piles, pile spacing 3 dp, Column load 55 ton (Initial) and then gradually increase 10% and result studya) For every 10% increase of column load, depth is increased as same percentage as compared to the column load.b) Strut capacity decreases with the increase of column load. (Figure 8) c) For 10% increase of column load, strut force increases by 2.83%. (Shown in Figure 9). Gradual strut force increase % is also shown in same figure for 100% column load within the strut capacity limit.d) The increase of column load, the strut & tie width is decreased with a significant amount because the more column load concentrated in a comparatively lesser area and the same strut & tie portion adds possibility of crushing and decrease the strut capacity. (Shown in Figure 10)e) Tie performance is actually measured by amount of steel needed in a specified area is wide enough or not to accommodate the required steel. Economy is also a major consideration about tie steel requirement.f) It is seen that tie reaction (44.84 ton) is constant. Because with the increase of column load depth is increased as same percentage and tie reaction is same for this case actually tie reaction is generally changes when pile spacing is changed.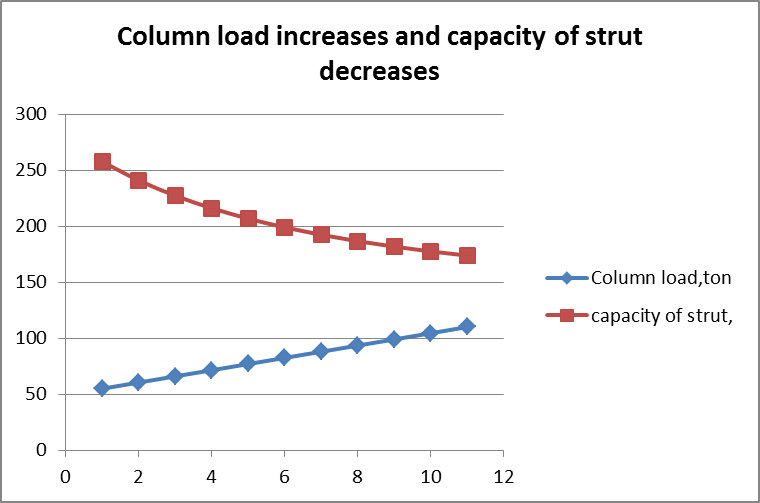 | Figure 8. Strut capacity decreases with the increase of Column load (Column Serial 01 & 15 in Table 4 in Appendix A) |
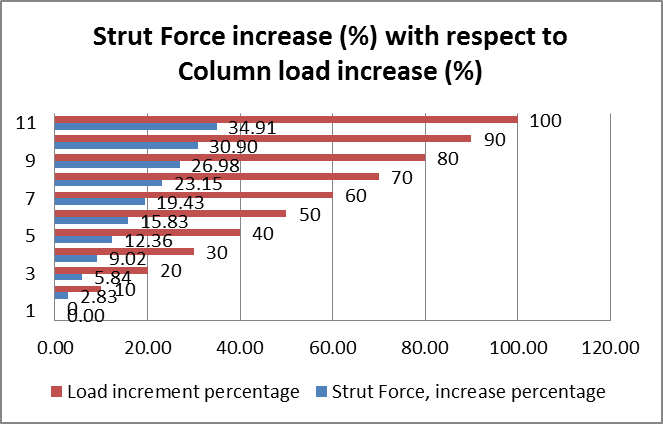 | Figure 9. Strut force increase with the increase of Column load (Column Serial 14 & 10 in Table 4 in Appendix A) |
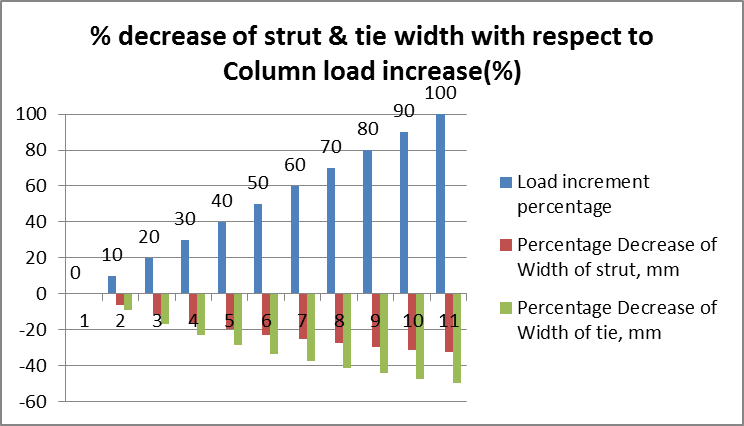 | Figure 10. Strut & tie width decreases with the increase of Column load (Column Serial 20, 21 & 22 in Table 4 in Appendix A) |
5.2. Result analysis from Table 5 of Appendix A: For case 2
Other parameters same, only pile spacing changes from 3 dp to 2.5 dpa) Same as described as case 1b) Strut capacity decreases with the increase of column load. (Figure 11) c) For 10% increase of column load, strut force increases by 3.62%. (Shown in Figure 12). Gradual strut force increament % is also shown in same figure for 100% column load within the strut capacity. (Figure 12)d) Same as Case 1 (Shown in Figure 13)e) Same as Case 1f) It is seen that tie reaction (37.36 ton) is constant. Because with the increase of column load depth is increased as same percentage and tie reaction is same for this case. Tie reaction is generally changes when pile spacing is changed.The tie reaction is 37.36 ton when L=2.5dpThe tie reaction is 44.84 ton when L=3dp, which is 20% greater than that of when L= 2.5dp.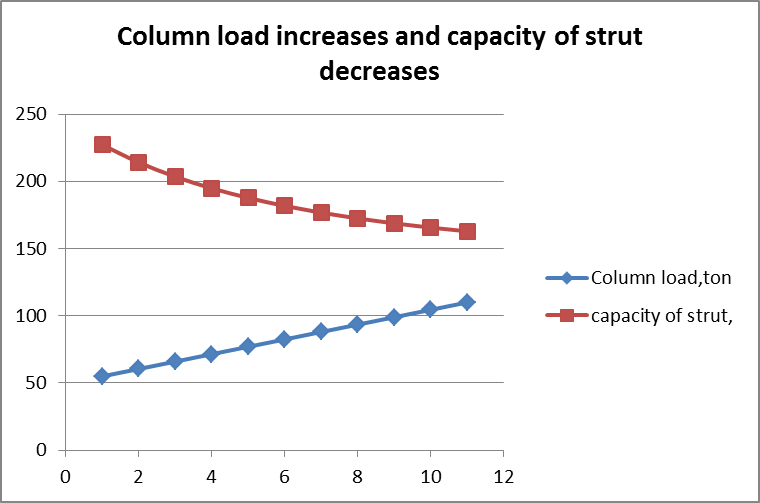 | Figure 11. Strut capacity decreases with the increase of Column load (Column Serial 01 & 15 in Table 5 in Appendix A) |
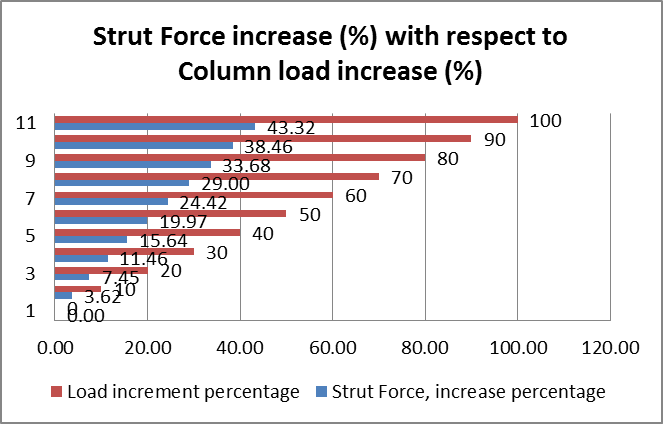 | Figure 12. Strut force increase with the increase of Column load (Column Serial 14 & 10 in Table 5 in Appendix A) |
 | Figure 13. Strut & tie width decreases with the increase of Column load (Column Serial 20, 21 & 22 in Table 5 in Appendix A) |
5.3. Result Analysis of Table 2
Table 2. Strut & Tie force in different points
 |
| |
|
If Dp=736 mm (For example) and spacing 2.5dp, a) The strut force at pile point P5(θ=55.81°), FAC=66.5 ton and at P2(θ=26.14°), FAD=124.84 ton (+87% more than that of pile point P5)b) The tie force at pile point P5(θ=55.81°), TBC=37.4 ton and at P2(θ=26.14°), FDC=112 ton (+200% more than that of pile point P5)If Dp=736 mm and spacing 3dp, a) The strut force at pile point P5(θ=50.81°), FAC=70.96 ton and at P2(θ=22.24°), FAD=145.32 ton (+104% more than that of pile point P5)b) The tie force at pile point P5(θ=50.81°), TBC=44.84 ton and at P2(θ=22.24°), FDC=134 ton (+200% more than that of pile point P5)For constant depth Dp=736 mm,a) Strut force in P5 is 66.49 ton (For L=2.5 dp) and 70.96 (For L=3 dp), that means more than 6% b) Tie force in P5 is 37.36 ton (For L=2.5 dp) and 44.84 (For L=3 dp), that means more than 20% Similarly,a) Strut force in P2 is 124.84 ton (For L=2.5 dp) and 145.32 (For L=3 dp), that means more than 16% b) Tie force in P2 is 112.07 ton (For L=2.5 dp) and 134.50 (For L=3 dp), that means more than 20% Tie reaction is constantly increasing by 20 % in case of 2.5dp and 3dp.From this 12 pile arrangement we can see that strut force is double in pile point P2 with compared to P5.That means spacing of pile directly influence the strut force & tie force.If the pile is located more distance from the column, it creates more strut force and tie force.To satisfy the increased strut force we need to increase the capacity of strut which is discussed in the previous sectionAnd similarly, tie force is satisfied by adding more steel in tie zone.For same column load if we change the pile spacing then we can found that the strut force is 70.96 ton for P5 which is 66.59 ton for P5 when spacing is 3dp.That means for increase the distance for pile cap force increases by about 6%For same column load the strut force is 70.96 ton for P5 which is 66.59 ton for P5 when spacing is 3dp.Similarly the tie force is 44.84 ton for P5 for spacing is 3dp.We may employ some technique to increase the strut capacity. We can do it by many waysa) Increase the concrete characteristic strengthb) Increase the width of imaginary beamc) Increase the depthd) Provide steel But in a particular case we may not do the way described in point a,b,c. In that case, we have only one (01) option to increase the strut capacity by providing Compression steel by the following formulafns=fcuAc + A’sf’sWhere f’s is based on the strain in the concrete at peak stress. For grades 40 and 60 reinforcement, f’s=fy.
6. Beam Theory Approach
6.1. Bending Moment Calculation
Bending Moment should be calculated at Y-Y point,Load on each pile 55/2=27.5 ton=269.5 KNMu= 269.5 X ((1.2-.4)/2)= 107.8 KNCheck for pile cap depth from this equation 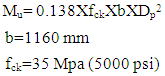 | (3) |
From the above equation, Dp=138mm.
6.2. Punching Shear
Punching shear at face of column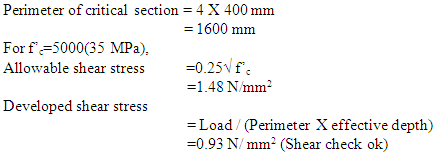 Effective depth is from the STM model.That means effective depth is automatically satisfying the punching shear.But what happens if we check the punching shear in the d/2 distance from the column face?In this case Perimeter of critical section = 4 X (400+d/2) mmIf d=368, perimeter = 2336 mmFor f’c=5000(35 MPa),
  | (4) |
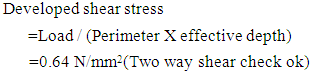 | (5) |
7. Comparison Study
7.1. Comparison of Pile Cap Depth from Different Method
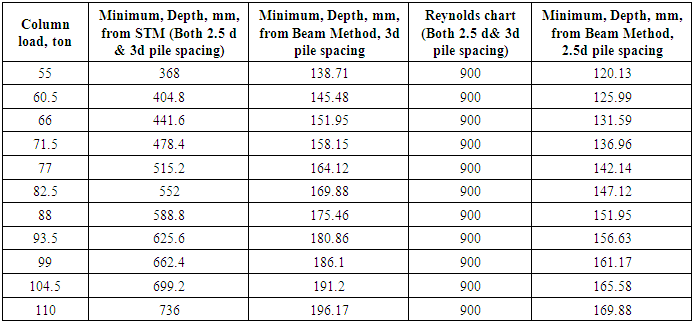
Minimum depth in different column load is calculated in Column Serial 3 in Table 4 & Table 5 in Appendix A (Using STM approach).In STM approach, depth is independent of pile spacing.But in beam method, depth is varied with pile spacing.Reynolds Chart for pile cap depth guideline is related to pile diameter only. Details calculation is shown in Table 4.
7.2. Result analysis of Table 3
Table 3. Comparison of pile cap depth from different method
 |
| |
|
The depth of pile cap is dependent on pile diameter in the Reynolds chart. But this empirical formula is very uneconomical. But more stiffness can be achieved in this chart.In STM method the calculated depth is automatically satisfy the punching shear in most cases. In STM approach, spacing of pile is not affecting the depth. Pile cap depth should be kept on the high side (optimum) to affect economy of steel and also to provide adequate rigidity to pile cap.In Beam method the calculated depth value is very low. Generally we cannot use this lower depth in pile cap. In Beam method, depth is varied with the pile spacing. For example in Table 4, for column load 55 ton, the depth is 138mm (when pile spacing is 3d) and the depth is 120 mm (when pile spacing is 2.5d). Generally in most of the cases, the calculated depth does not meet the allowable shear stress. For this reason we have to revise the depth. Alternatively at first allowable shear stress can be calculated from equation (3). Then we put it in equation (4) and by back calculation the minimum safe depth can be found. Although the depth is quite lower for confinement and overall stability of pile cap.Alternatively from practical field and calculation comparison it can be suggest that the coefficient in equation (3) give optimum depth if this value ranges from 0.07~0.90. Further study is needed to change this coefficient or multiply some factor of safety to get optimum depth of pile cap for greater stiffness of the structure.
8. Regression Line Analysis
From the comparison, the Reynolds guideline is very safe but not economical in some cases and it’s an empirical guideline.For this reason, a regression line using the value from STM method and Reynolds chart (From Table 3) can be used for a safe value of pile cap depth.(As the depth from Beam method is very low, those values are not used in the graph.)R-squared is a statistical measure of how close the data are to the fitted regression line.Figure 18 have a comparatively good R-squared value. The equation is y=3.3455x+450. From this equation of regression line a safe value of pile cap design for any load can be obtained.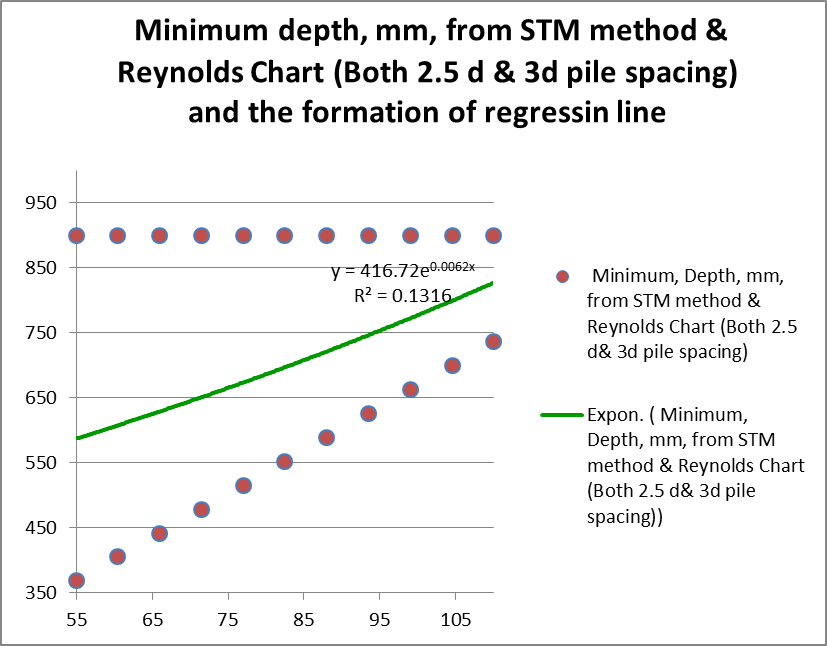 | Figure 14. Suggested regression line (Exponential) to get safe depth value (R2= 0.1316) |
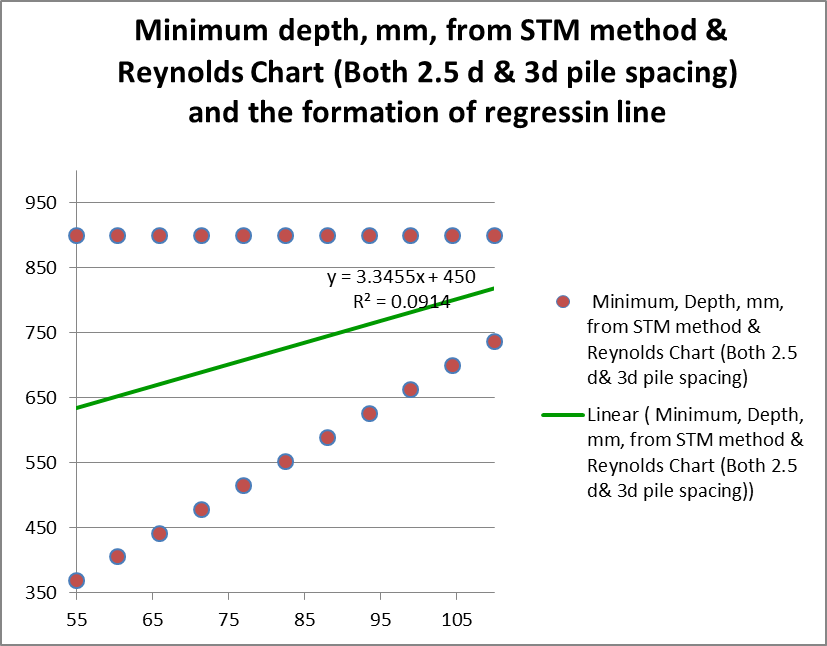 | Figure 15. Suggested regression line (Linear) to get safe depth value (R2= 0. 0.0914) |
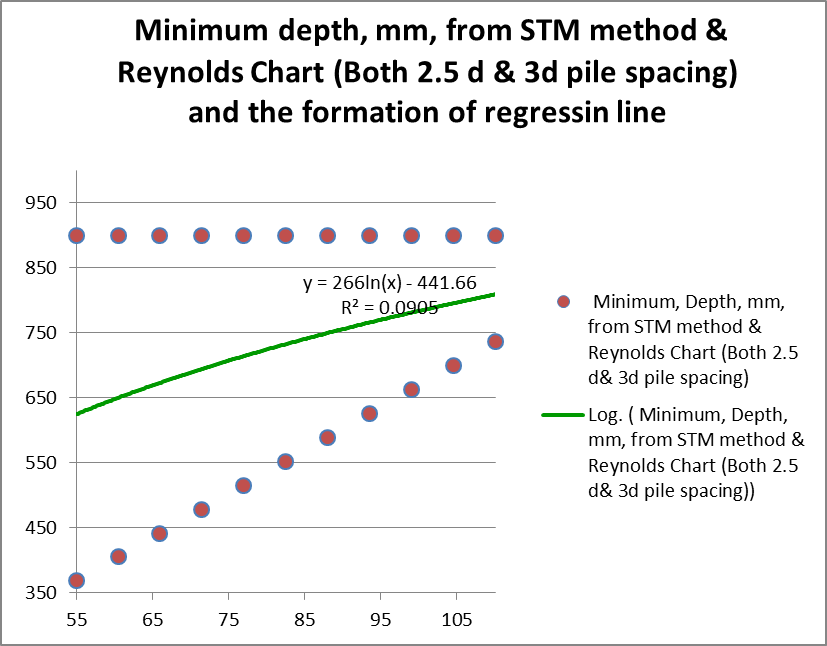 | Figure 16. Suggested regression line (Logarithmic) to get safe depth value (R2= 0.0905) |
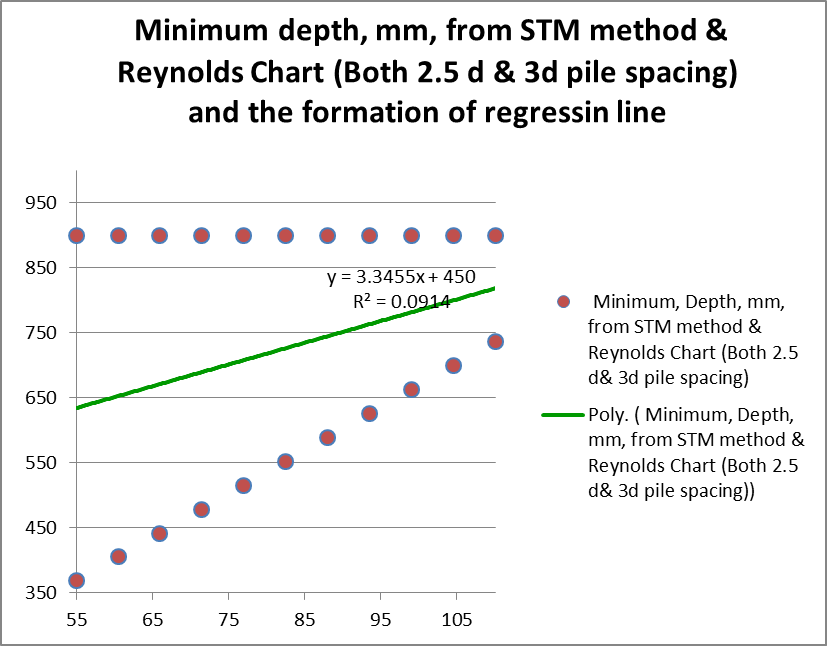 | Figure 17. Suggested regression line (Polynomial) to get safe depth value (R2= 0.0914) |
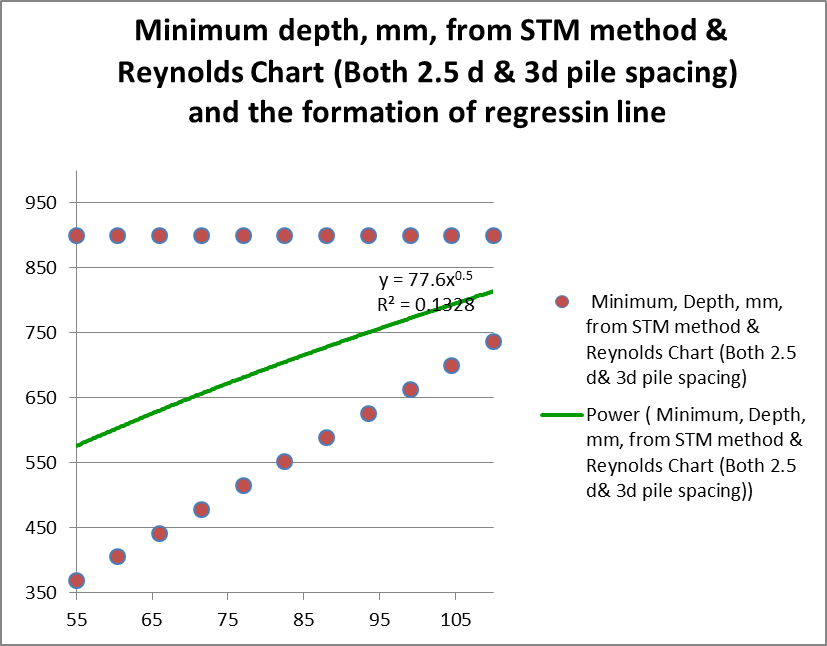 | Figure 18. Suggested regression line (Power) to get safe depth value (R2= 0.1328) |
9. Application of This Study
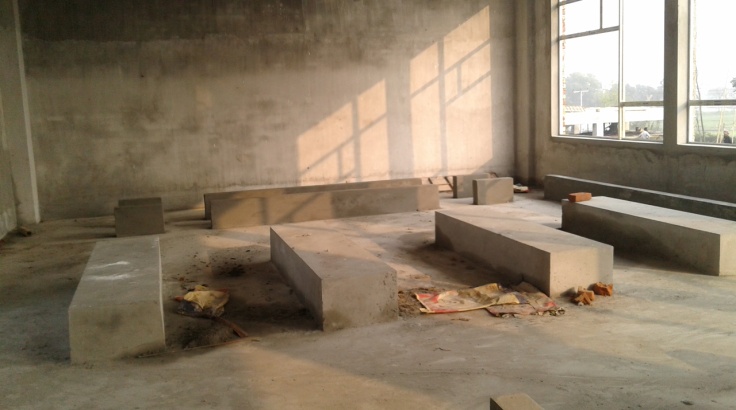
i) Due to construction mistake/problem it is found that one pile head is not found in the specified depth. The hard casting portion is more than 3 m below the GL. It’s a practical case. It’s needed to correct the pile cap design. It is simple that the defected pile capacity is decreased. We need to modify it or the portion of some load should be transfer to the adjacent pile if the geotechnical engineers agree about the overall safety of the each pile.Another approach we can make, for this practical case of the author the pile length = 20m.After crushing the top head cursing, the pile length = 17m.We may ask the geotechnical engineers about the calculated load carrying capacity of the pile of length of 17m.From the load carrying capacity we can make an extended circular or rectangular RCC shaft (Diameter or width larger than pile) and calculate the punching shear in the GL level. After that pile cap can be constructed on the piles group.From this study we can get an idea what amount of load we need to transfer to the adjacent pile if possible. If not possible to transfer the load an extended shaft may be constructed. Before this decision the strut & tie forces have to calculate and infer an idea which is studied in different cases in example calculation in this study.ii) For architectural or client requirement the column load may be increased. The light machine type plan replaced by heavy machine and the author experienced such situation after the construction of pile.Generally structural designer do their design work with the help of computer analysis but such situation requires more involvement of the designer compared to software.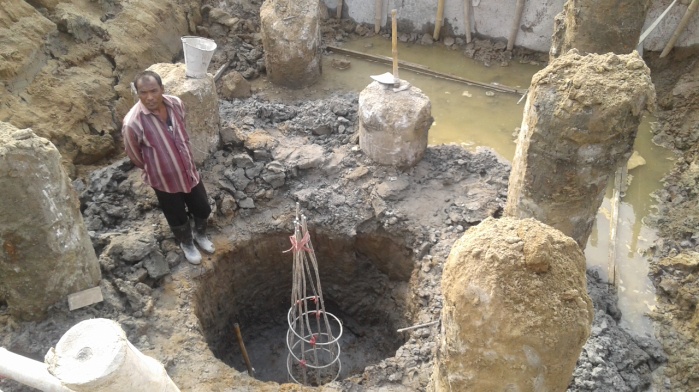 | Figure 19. Pile head is not found in the specified depth [9] |
 | Figure 20. Pile head is not found in the specified depth which may affect the pile cap performances [9] |
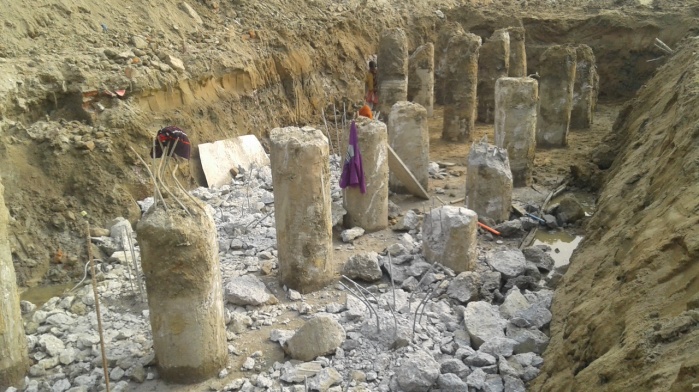
 | Figure 21. The author experienced in such situation of increased column load due to rearrangement of architectural plan and loading pattern after the pile construction work and rechecks the pile cap design |
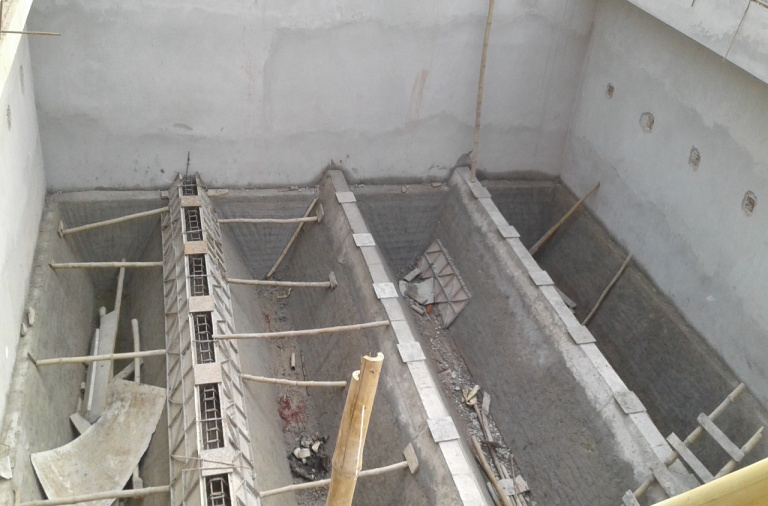 | Figure 22. The author experienced in such situation of increased column load due to rearrangement of architectural plan and loading pattern after the pile construction work and rechecks the pile cap design (This picture is about an ETP construction work) [9] |
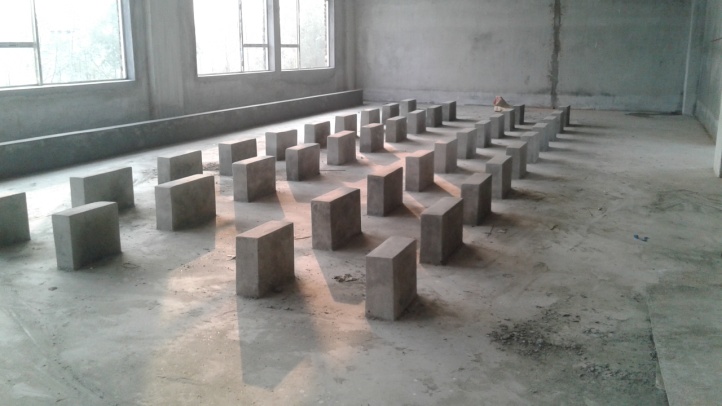 | Figure 23. The author experienced in such situation of increased column load due to rearrangement of architectural plan (Changing of machine placement decision from the client) and loading pattern after the pile construction work (Just before pile cap construction work) and rechecks the pile cap design [9] |
10. Analysis Summary
a) The depth obtained from beam method (From shear calculation) cannot be used practically. It does not meet the minimum value and lacks sufficient stiffness.We need to modify the depth for practical use if we design the pile cap by beam methodb) In case of group pile (More than 4 pile group) the distant pile experiences more strut & tie forces as compared to the nearest pile from the column. From the example calculation it can be assumed that the strut force & tie reaction associated with distant pile is the governing value for the overall design.
11. Conclusions
a) Spacing acts significant effect in strut & tie forces. It is shown from this study that the distant pile form the column induces larger strut & tie forces in the pile cap. It should be considered during the design work. The percentage increase amount may be used to know the different strut & tie force without details calculation of another strut & tie.b) From the above regression line analysis discussed in Section 8, the last one comparatively more accurate R2 which can be used as a safer pile cap depth value for design of pile cap. The equation y=77.6 X (x)^0.5 is proposed to select safe depth of pile cap in mm which can be used practically. (Here,x=load in ton,y=depth in mm) c) Further study is needed for the modification of the coefficient (0.138) in the moment equation (Equation No. 3) described in Section 6.1. The authors have an intend to modify the coefficient to get a safe pile cap depth value in their future attempt.d) Further study is needed to make a revised design of pile cap in case of defected pile and modify the pile cap design and check its performances in different practical condition.
Appendix A
 | Table 4 |
 | Table 5 |
References
| [1] | CRSI Design Handbook 2008-10th Edition, Concrete Reinforcing Steel Institute, Illinois, 2008. |
| [2] | Arthur H. Nilson, David Darwin, Charles W. Dolan-Design of Concrete structures-13th Edition, “Chapter 10-STRUT-AND-TIE MODELS,”, McGraw Hill Higher Education, 2006. |
| [3] | Perry Adebar and Luke (Zongyu) Zhou-“Design of Deep Pile Caps by Strut-and-Tie Models,” ACI Structural journal, V.93, No 4, July-August 1996. |
| [4] | William Buswell and Vinh Dao-“Pile Cap Design Using Strut-and-Tie Modelling,” In: Vinh Dao and Peter Dux, Concrete 2013: Conference Proceedings. Concrete 2013: 26th Biennial National Conference of the Concrete Institute of Australia, Gold Coast, QLD, Australia, (1-10). 16-18 October, 2013. |
| [5] | Jung Woong Park, Daniel Kuchma and Rafael Souza- “Strength Predictions of Pile Caps By a Strut-and-Tie Model Approach,” NRC Research Press Website at cjce.ca on 21 November 2008. |
| [6] | V. V. Nori and M. S. Tharval-“Design of Pile Caps-Strut and Tie Model Method,” Indian Concrete journal, April, 2007. |
| [7] | ACI Committee 318, Building Code Requirements for Structural Concrete (ACI 318-02) and Commentary (ACI 318R-02),”American Concrete Institute, 2002, Appendix A. |
| [8] | Charles E. Reynolds and James C. Steedman-“Reinforced Concrete Designer’s Handbook”-10th Edition, 1999. |
| [9] | https://rabbanypalash.blogspot.com/p/guhiuh.html. |

 Abstract
 Reference
 Full-Text PDF
 Full-text HTML