-
Paper Information
- Paper Submission
-
Journal Information
- About This Journal
- Editorial Board
- Current Issue
- Archive
- Author Guidelines
- Contact Us
Architecture Research
p-ISSN: 2168-507X e-ISSN: 2168-5088
2018; 8(1): 19-38
doi:10.5923/j.arch.20180801.03

Analyzing Emerging Environmental Issues in Major Areas: The Case of Lagos in South West Nigeria
 Abstract
 Reference
 Full-Text PDF
 Full-text HTML
E. C. Merem1, Y. Twumasi2, J. Wesley1, P. Isokpehi1, S. Fageir1, M. Crisler1, C. Romorno1, A. Hines3, G. S. Ochai4, S. Leggett4, E. Nwagboso5
1Department of Urban and Regional Planning, Jackson State University, Jackson, MS, USA
2Department of Urban Forestry and Natural Resources, Southern University, Baton Rouge, LA, USA
3Department of Public Policy and Administration, Jackson State University, Jackson, MS, USA
4Department of Health Policy and Administration, Jackson State University, Jackson, MS, USA
5Department of Political Science, Jackson State University, Jackson, MS, USA
Correspondence to: E. C. Merem, Department of Urban and Regional Planning, Jackson State University, Jackson, MS, USA.
| Email: |  |
Copyright © 2018 Scientific & Academic Publishing. All Rights Reserved.
This work is licensed under the Creative Commons Attribution International License (CC BY).
http://creativecommons.org/licenses/by/4.0/

With the many glowing promises painted about Lagos State over the past decades, several environmental challenges do exist in the area. This is evident with the pace of unprecedented urban development expansion and incursions into areas deemed ecologically fragile through the conversion of wetlands to human settlements in low-lying zones prone to the threats of sea level rise hazards and intense flooding. Additionally, the metropolitan area has also seen intense environmental degradation emanating from the pressures of unprecedented influx of people into the area. As the various land use activities and land reclamation projects in the state intensify to meet rising demands for settlements, the carrying capacity of the ecosystem remains threatened. The declining quality of the ecosystem as manifested with recurrent waste generation, limited access to fresh water supply, poor drainage and power outage, translates into extra burden for a place saddled already by fatalities from the outbreak of epidemics of water contamination and building collapse, emission of atmospheric toxics, the displacement of citizens and damages from climatic variability. With the problems attributed to a host of socio-economic and physical factors, very little exists in the literature to capture these trends spatially using a mixscale approach. This study will fill that void in research by assessing emerging environmental issues in the Lagos area. Using a mix scale approach of descriptive statistics and Geographic Information Systems (GIS) to analyze the trends, the results showed a mix of gains and declines in the land use parameters with major increases in areas devoted to urban development from 1976-2008 and 1976-2015, followed by losses in agricultural land and wetlands from 1976-2015. The issues remain compounded by the surge in population and water supply demands and instances of deficits from 1963-2020. While the GIS mapping revealed the gradual dispersion of ecosystem degradation indicators spread across the state, there exists clusters of areas vulnerable to environmental hazards across Lagos. To mitigate these risks, the paper offered several recommendations ranging from the need for effective policy to green planning education for city managers and developers and risk assessment.
Keywords: Environment, Climate Change, Sea Level rise, Degradation, Lagos, Hazards, Coast, Factors, GIS
Cite this paper: E. C. Merem, Y. Twumasi, J. Wesley, P. Isokpehi, S. Fageir, M. Crisler, C. Romorno, A. Hines, G. S. Ochai, S. Leggett, E. Nwagboso, Analyzing Emerging Environmental Issues in Major Areas: The Case of Lagos in South West Nigeria, Architecture Research, Vol. 8 No. 1, 2018, pp. 19-38. doi: 10.5923/j.arch.20180801.03.
Article Outline
1. Introduction
- Being a coastal state located in a low lying area as well as the largest state and the economic and financial capital of Nigeria with a teeming population [1-7], The state of Lagos faces very serious environmental challenges consistent with its physical location and economic stature [9, 10]. Confronting the Lagos area are recurrent ecological issues such as the threats of heavy rainfall, flooding, pressures from overcrowding and the continual encroachment of rapid urban development activities into fragile natural areas to the detriment of ecosystem stability [11-13, 8, 10]. Because many parts of Lagos risk submergence by 2050, the liabilities from the threats of sea level rise in Lagos could top the $117.3 billion mark. For that, Lagos state not only faces the exposure to ecological hazards in the form of potential sea level rise from changing global climate [14-21, 3]. But Lagosians have for decades endured the daily experience of lethargic power supply, filthy surroundings filled with uncollected wastes and poor sanitation caused by daily waste generation capacity of 6000-10,000 metric tons which threatens water quality and community health [10, 14, 22, 12, 5]. With all these happening in the face of limited access to portable water [23, 24], uncontrolled growth and the 600,000 yearly growth in population in the state [12]. The recent outbreak of water crisis in the state prompted the prohibition of unauthorized digging of new water boreholes, the transportation or marketing of water resources until a public backlash forced a reversal of the new law [25]. Notwithstanding the gravity of the aforementioned challenges, many of the current studies on the state of Lagos over the last several years showed a blind obsession with its economic potentials as the commercial nerve center of Nigeria and the emergence of its metro area in the global arena with projected growth rates surpassing other mega cities worldwide [26, 11, 27-30]. While there is no attempt herein to diminish the commercial potentials of Lagos and the importance of its linkages to the orbit of global capital, limiting that analogy solely to the economy overlooks the broader ecological problems impeding quality of life from decades of unprecedented urbanization and growth. Considering how such unparalleled urban expansion in the past years leads to the daily threats of environmental degradation and its impacts in a place with widespread sites and sources of environmental pollution [11]. The mounting dangers to the overall health of the ecosystem in that setting as manifested with recurrent waste generation, simultaneously limits access to a clean water supply, leads to poor drainage, power outages and the rising causalities from building collapse [31, 32, 12, 33-35]. These problems and the huge strain on the carrying capacity of the environment continually translate into extra burdens for the inhabitants due to many factors [23]. In the face of these concerns, it remains rather unusual that the literature on Lagos has for decades focused on the narrow confines of the subject with much of the emphasis placed on its fiscal attributes and successes under the orbit of global capital without the analysis of environmental challenges. Because many of the glowing promises often painted of the economic might of Lagos ignored the associated environmental liabilities and several socio-economic, demographic, and policy elements fuelling its hidden challenges. There have been no serious attempts to assess the actual ecological issues facing the state of Lagos with the latest advances in methodological tools like mix scale approaches to optimize decision support in the at risk areas. This comes at a time, when such problems as water crisis and stress involving rising demands, climate change hazards and other forms of environmental declines continue to be key concerns in the city for planners [36-39]. The problems are further compounded by the increasing challenges faced by planners in serving the needs of the city in the face of unprecedented growth and limited access to information to aid decision-making. This not only widens the data gaps, but it hinders the analytical capability of city managers in tracking the critical environmental risks facing the state. With such lapses, and given the state of current vulnerabilities, there is an urgent need for the analysis of emerging environmental issues affecting Lagos from a mix scale perspective. However, over the years, Merem has assessed environmental degradation at different scales under a mix scale orientation of GIS and descriptive statistics with relevance to the study area. Even though some of the themes covered ranged from environmental changes, impacts, ecosystem liabilities, pollution threats, urbanization and energy use [40-45], this study will fill that void in the literature. This paper examines the growing environmental issues facing Lagos in the Southwest region of Nigeria. Emphasis is on the issues, environmental analysis of the trends, factors fuelling the problems, and future actions to mitigate the risks. The paper has five objectives. The prime objective is to contribute to the literature. The second objective is to provide a conceptual framework; the third objective focuses on the factors behind ecological declines and the impacts, while the fourth objective is to design a management tool for decision-making. The fifth aim is to generate a decision support tool for managers. The paper is divided into five sections. The first section contains the introduction and background information; the second section is devoted to the materials and methods. The third section highlights the discussions and results of the environmental and spatial analysis of the trends and factors of change. The fourth section presents the discussions and findings while the fifth and final portion provides the recommendations and closure of the paper.
2. Methods and Materials
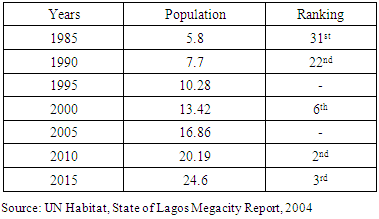
- Lagos state as shown in Figure 1 is one of the 36 states that constitute the Federal Republic of Nigeria with a population of over 24 million in 2015 (Table 1). It is located in the Southwestern part of Nigeria with its southern boundary formed by about 180 km of Atlantic coastline and a border with the Republic of Benin along the western boundary.
|
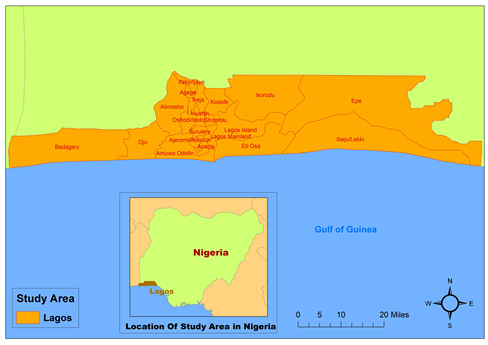 | Figure 1. The Study Area of Lagos |
|
2.1. Methods Used
- This paper stresses a mix scale approach involving the integration of secondary data connected to GIS to analyze the environmental issues confronting Lagos in the South West region of Nigeria. The spatial information for the research was obtained from the United States Geological Surveys (USGS), and the University of Maryland Online Free data unit, Lagos State Government, the Nigerian Bureau of statistics (NBS), the Lagos Bureau of Statistics and The Lagos State Building Control Agency, (LASBCA) and the Lagos State Ministry of Environment. All in all, the population data came from the UN habitat while the flood info were obtained from the Lagos Physical Planning and Development Authority (LASPPADA), other data like rainfall frequency and port cargo information originated through the Lagos State Ministry of environment and the Nigerian Ports Authority (NPA) respectively. On the one hand, The Lagos State Government sources provided the land use inventory. On the other, the Lagos State water cooperation produced the hydrological data pertaining to changes in water use coupled with additional data on buildings and energy from Lagos State Building Control Agency, (LASBCA), Lagos Bureau of Statistics and The Lagos State Electricity Board. While the federal geographic identifier codes of the state were used to geo-code the info contained in the data sets. This information was processed and analyzed with basic descriptive statistics and GIS with attention to the temporal-spatial trends of environmental issues at the state and local government levels in Lagos. The relevant procedures consist of two stages listed below.
2.2. Stage 1: Identification of Variables, Data Gathering and Study Design
- The first step involves the identification of variables needed to assess the issues resulting from environmental impacts of development on the city of Lagos at the state level in the Southwest region. The variables consist of socio-economic and environmental information, including the size of land area, percentage of development, wetlands change, wetland percentage, wetland loss, the people impacted by floods, structures destroyed from flooding, people displaced from flooding, volume of waste generation, causes of flooding, volume of port shipment, and cargos. The others encompasses the costs of building materials like cement, volume of ship traffic, the number of building collapse, the number of victims injured by building collapse and the number of casualties from building collapse. Added to the list, are the population and rankings, land use change, metro land area structure, land area occupied, the volume and frequency of rainfall, environmental pollutants and water volumes. Additionally, access to databases that are available within the federal and state archives in the Lagos area and other agencies quickened the search process. The process continued with the design of data matrices for socio-economic and environmental variables covering the periods from 1963, 1976, 1985, 1986, 2006, 2008, 2010, 2013, 2014 to 2015. The design of spatial data for the GIS analysis required also the delineation of state boundary lines. With boundary lines unchanged, a common geographic identifier code was assigned to each of the units to ensure analytical coherency. This approach was vital considering the record pace of new state creations and the impacts of boundary adjustments in enabling the emergence of new cities or local government areas. Surely, the spatial boundaries of the core cities or counties of local government areas of interest under analysis remained constant within a common geographic identification code. This process helped delineate the location of the vulnerable areas in space gravely impacted by environmental degradation.
2.3. Stage 2: Step 2: Data Analysis and GIS Mapping
- In the second stage, descriptive statistics and spatial analysis were employed to transform the original socio-economic and environmental data into relative measures (percentages/ratios). This process generated the parameters for estimating and assessing the trends, water volume and supply, population distribution, port cargo traffic and volumes, waste generation state-wide, and the dispersion of environmental pollutants. This was facilitated by measurements and comparisons of the trends over time. While this approach helps track the use of such resources as water and others, the tables highlight the changes, population size, cargo volume, land use change, wetlands variations and the people impacted by flooding. The maps highlighted the frequency of building collapse and casualties and the concentration of environmental degradation and ecological risk factors. The remaining steps involve spatial analysis and output (maps-tables-text) covering the study period, using Arc GIS 10.4 and SPSS 20.0. The spatial units of analysis under a mix scale consist of state, region, the local government areas and cities, and the boundary and locations where environmental declines and factors precipitating it are common. The geographic data for the city of Lagos and the state which covered its boundaries and local government areas, also include ecological data of land cover files, and paper and digital maps from 2002-2015. The outputs of the spatial data were mapped and compared across time from the 1970s to 2015 to see the dispersion of the trends in atmospheric pollution, waste generation, building calamities, rainfall volume, the socio-economic factors associated with development and the ecosystem degradation ravaging the study area.
3. The Results
- This section of the paper presents the results of the descriptive statistics on the temporal trends and spatial analysis of the environmental issues and changes occurring in Lagos state with GIS. The initial emphasis covers the temporal profile of coastal environmental change and flood hazards. This is followed by a description of land use change, water supply trends and pollution and miscellaneous issues of wastes generation and energy use, GIS mapping and factors fuelling the ecological challenges in Lagos state. The others comprise the discussions of the findings and the conclusions.
3.1. Coastal Environmental Change
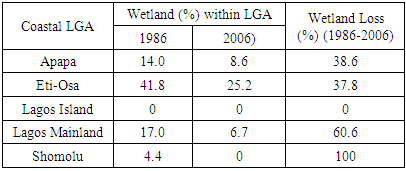
- In the context of environmental impacts of globalization on coastal areas in the state, the analysis of changing land cover in the Lagos coastal area showed extensive changes on various land use types. Between 1986-2002, when growth reached a peak, developed land cover indicators like residential, industrial, commercial, transportation and other man-made use of land increased from 85.44 km2 (43.36%) to 111.89 km2 (56.78%). Similarly, natural vegetation cover including mangrove and swamp areas fell from 59.24 km2 (30.06%) to 38.31 km2 (19.44%) while natural water bodies like ocean, lagoons and streams dropped from 52.39 km2 (26.58%) to 46.87 km2 (23.78%) during the same period. In addition, all through 1986 and 2006, wetlands, an important buffer against floods declined in coastal Lagos (Table 3) in the face of pressures unleashed from global economic growth. Considering all these forces, in four coastal local government areas of Lagos, wetland loss of 38% to 100% occurred during the same period. Among local government areas of the state from 1986 to 2006, the changes in the percentage of wetlands spread across the areas showed that the Apapa local area whose wetland coverage stood at 14.0% in 1986, dropped to 8.6% in 2006. Elsewhere the coastal LGA of Eti-Osa also started with a wetland area of 41.8% in 1998 until it dwindled to 25.2% by 2006. In a similar order, Lagos Mainland that was covered by 17% of marshes in 1986, by the following decade of 2006, the area of wetland fell to 6.7% while Shomolu had only 4.4% of its area covered by wetland in 1986. Even though Eti-Osa local government area outpaced the other areas in wetlands coverage, the percentage of loss among communities in the coastal wetlands that emerged all through 1986-2006 shows Apapa and Eti-Osa local government areas with identical losses of 38.6-37.8% whereas Lagos Mainland finished with about 60.6% (Table 3).
|
3.2. The Hazards and Damages from Flooding
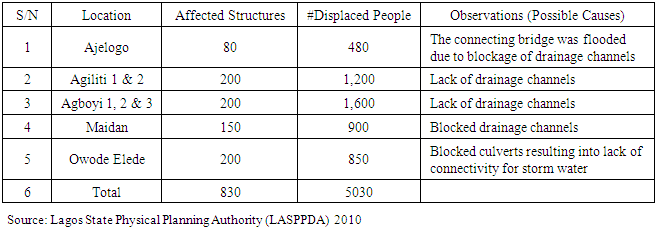
- Realizing that many parts of Lagos are prone to flooding during the rainy season, spillovers from mounting urban growth that pushes human settlements into ecological marginal areas put the citizens’ safety at a huge risk. With the major causes of floods in built-up areas centered on uncontrolled expansion of impermeable surfaces due to rapid urbanization (Table 5), there remains a danger in building new homes on areas adjacent to floodplains and localities lacking storm water drainage capability, where failure to maintain existing drainage systems are recurrent. Given these dangers, one need not overlook the fact that changes in the intensity and pattern of storms have also emerged as key elements driving the risks of flooding in the Lagos metro and the way it affects ordinary citizens who are often at the epicenters of potential hazards and victims of displacement. Such emerging risks in growth patterns has major effects as the design of Lekki Peninsular with limited consideration for sea level rise raises concerns about environmental justice. It is one thing to promote opulent developments in the face of inclement weather hazards in a global city, but planners should not lose sight of the impacts on citizens at the margin. Furthermore, from the barrage of damages unleashed by the overwhelming impacts of flooding in 2010 in Lagos, about a total of 830 structures were affected, followed by the dislocation of 5,030 citizens, with the lack of drainage channels and drainage blockages viewed as the principal causes. Judging from the locations, note that while the community of Ajelogo saw the destruction of 80 structures and the displacement of 480 people. In other parts, most notably Agiliti 1, 2, and Agboyi 1, 2 and 3 areas badly hit by the flooding, suffered considerably with each sustaining serious structural damages amounting to about 200 followed by additional displacement of citizens numbering 1,200-1,600 individuals. Elsewhere, similar debacles also visited the communities of Maidan and Owode Elede who endured more damages estimated at 150-200 homes coupled with the displacement of 900-850 people during the same period (Table 4).
|
|
3.3. Land Use Change 1976-2008 and 1976-2015
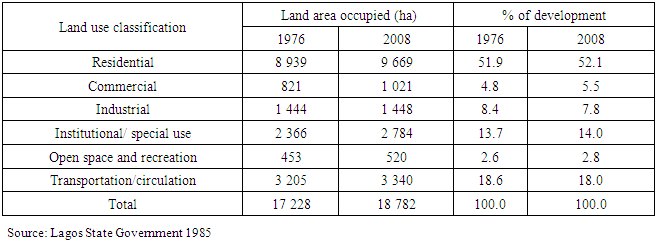
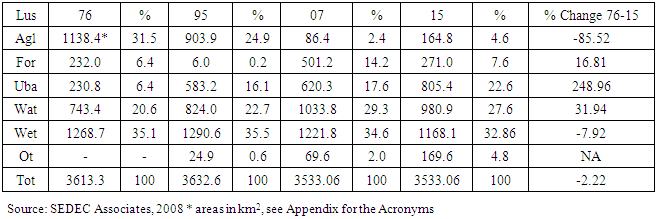
- The role of urbanization as a predictor of the prevailing environmental problems in the Lagos metro area shows that the listed land uses from residential to transportation occupied 17,228-18,782 hectares between 1976 through 2008. Amongst the additional land uses, residential areas, outpaced the others with 8,939 to 9,669 hectares at quite a considerable percentage levels (51.9-52.1%) from 1976-2008. The other competing land use types (institutional and transportation) emerged as the second largest with considerable areas measured at 2,366-2,784 hectares to 3,205-3,340 hectares. This represents an equivalent percentage level of land development estimated at under -14.0% to 18% respectively for 1976 through 2008 fiscal years. Given that, the land areas devoted to industrial development reflects identical values of 1,444-1,448 hectares and percentage of development in the neighborhood of 8.4-7.8%. The commercial and open space land areas not only ranged from levels (821-1,021 hectares to 453-520 hectares) below the previous competing land uses herein analyzed, but their percentage points hovered at mostly the low single digits (2.6-2.8 to 4.8-5.5) (Table 5). The temporal distribution of urban land use change in the Lagos between 1976 to 2015 covers different uses that encompass agriculture, forest, urban areas, water, wetlands and others. From the data on table 6, based on an overall area of 3,613.3 km2 in 1976, the total estimates for different land uses of the other years (1995, 2007, and 2015) showed slight variability of 3,632.6 km2 until a back to back leveling of 3,533.06 km2 crept in between 2007-2015. Besides that, in 1976, agriculture and wetlands opened at a much higher size of 1,138.4 -1,268.7 km2 that surpassed the other land use types. Amongst the remaining land uses during that period, the area under water covered 743.4 km2 while forest and urban areas under the built environment were contained in a land area measured at 232.0 to 230.8 km2. In the ensuing 19 year period of 1995, when the land available for farming activities dropped to 903.9km2, the size of natural habitats in the form of wetlands, water and the land devoted urban development stood at 1,290.6km2, 824.0km2, and 583.2km2 respectively. Furthermore, the forested landscape in place did decrease significantly to just 6.0km2. Of the eight remaining years 2007-2015, as agricultural land area went from 86.4 km2 to 164.8km2, forestland followed up at 501.2km2 and 271.0km2. In the same periods, urban land use, water and wetlands areas in the state saw some variations in the neighborhood of 620.3- 805.4, 1,033.8 to 980.9 and, 1,221.8 – 1,168.1km2 while land areas classified as the others varied by 69.6 to 169.6 km2. With wetlands as the largest single land use element in the state, the percentage equivalence of the land uses for 1976 and 1995 showed the dominance of wetlands and agriculture at 31.5 -24.9 and 35.1 -35.5% compared to 2007 and 2015 during which water and wetlands overtook the other land use parameters by sizable margins of 29.3-34.6 and 27.6-32.86%. At that period, urban land area as a major indicator of the ongoing change patterns posted valuable percentage increases in size beginning with 6.4-16.1 and 17.6 -22.6% all through 1976 to 2015 while land devoted to agriculture showed recurrent soft percentage margins of 2.4% to 4.6% compared to the levels for wetlands. To buttress the extent of change for 1976-2015, the table highlights also a mix of gains and declines involving the various land use types of which agricultural land areas and wetlands declined by -85.52 to -7.92 percentage points respectively. Conversely in as much as areas covered by forestland and water rose by 16.81-31.94%, urban land use areas grew at a triple digit rate of 248.96 % from 1976-2015 (Table 6).
|
3.4. Water Supply and Pollution Trends
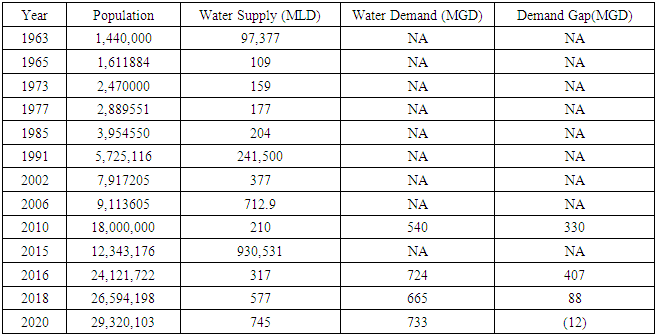
- Inadequate water supply stands as a recurrent constraint for residents and businesses in metro Lagos as folks regularly resort to private boreholes to meet daily needs. With only about 30% of citizens covered by the state water corporation, over 50% of water demand of the metropolis remains unmet. While the current daily total demand for water stands at 540 million gallons per day (mgd), the state’s carrier has only a total installed capacity of 210 mgd leaving a deficit of 300mgd daily. The situation was so bad that during an acute water crisis in March of 2017, Lagos state promulgated a law prohibiting the drilling of new boreholes and the marketing of water. This came in the wake of serious objections from well-meaning environmental groups who forced to authorities to withdraw the draft regulation as many saw the government rules as a pretext to privatize water use in the city at the expense of ordinary citizens. Surely, the legal actions taken by the state government to regulate access to water are vital steps to attain safe drinking water. However, the across the board prohibition that was reversed did not seem like the ideal solution in a place where only 10 percent of the residents have access to pipe borne water with the rest of the populace dependent on natural sources for portable water.To understand the current water challenges facing the state of Lagos as part of the broader environmental problems over the years, it is pertinent to put that into the context of the pressures placed on water production by growing population between 1963 through 2020. In these periods, most notably, beyond the mid-20th century era of 1963 to 1973, the state’s population not only showed a mild rise of 1.4, 1.6 to 2.4 million, but the available water supply increased remarkably by 0.97,377, 109, and 159 million gallons daily. In the following years of 1977, 1985 and 1991 came additional demographic pressures in the midst of mounting population levels of 2,889551, 3,954550 and 5,725,116 with the volumes of water supply in the 177,204, 241,500 mld level. During the opening decades of the 21st century through the periods of 2002, 2006 to 2010 under a teeming population (7, 917205-9, 113605 and 18,000,000), water needs in the state of Lagos fluctuated by 377, 712.9, 210 mld. At another period (2015, 2016, 2018) marked by very high population levels (12,343,176, 24,121,722, 26, 594,198), water supply for citizens changed by 930,531, 317, and 577 mld respectively while projections for 2020 estimated at 29,320,103 million will require record levels of 745 mld of water. Added to that, there are also problems of gross disparity between water supply and local demands in some of the years beginning in 2010 and 2016 when the water needs of the populace at 540 to 724 mld exceeded supply with disparity levels of 330 – 407 mld. The projections for the upcoming years (2018-2020) show water demand estimates of 665-733 mld with gaps of 88 to 12 mld. For these challenges, the state will require about US $2 billion in the next two decades to upgrade its water infrastructure (Table 7).
|
3.5. Miscellaneous Issues of Wastes Generation and Energy
- Considering its size, cities such as Lagos continues to pile increasing pressure on the ecosystem through huge demands for energy, water, food, and the disposal of wastes and toxics that affect the well-being of communities and the carrying capacity of ecosystem. Of the ecological challenges confronting the city of Lagos, the generation of 10,000 tons of wastes daily stands as a major concern given the threats to public health. An important dimension in this regard is the inability of city management authorities to handle waste disposal promptly. With the unsolved problem of accumulated wastes a source of concern, over 33% of the city lacks access to a coordinated hauling service. In that case, garbage generation and waste disposal problems in Lagos have compounded the long-standing problems of seasonal flooding and sewage holdup. Another constraint to efficient operation in waste management in the state is that up to 60% of residents in the metro live in inaccessible areas, which often impede regular waste collection. With the over stretched drainage scheme in place, water ways have become preferable in the movement of wastes compared to uncluttered gutters. Furthermore, the inadequate dumping of solid and liquid trash close to built-up areas coupled with poor refuse gathering and management, as well as inaccessible roads and the lack of high tech infrastructure compounds the sewage glitch in the state. Against this background, the belief is that local and nearby aquifers and ground water sources are threatened by the infiltration of microbes, organic and inorganic pollutants. With much of the local and commercial trash produced reused and directed towards land recovery efforts, substantial amounts are littered across the metro area of the state. However, they constitute major sources of contaminants including chlorides, nitrates, heavy metals and organic materials threatening environmental and public health. Another noteworthy point herein is that the city of Lagos has a high concentration of industries engaged in textile production, food processing, pharmaceuticals, tanneries, automotive manufacturing and assemblage, and car maintenance shops known to produce large volumes of wastes and contaminants. While part of the wastes from these facilities are disposed of either by sewer system or through open water, the small-scale industrial facilities operating amongst them without functional discarding systems, allow residues from generated effluents to flood the ground and impede ground water quality and aquifers. Within the energy realm, the metro area of Lagos accounts for 40% of the total electricity use in Nigeria for being at the center of global capital. The deregulation of the sector still has not solved power outages for Lagos despite its large population and big industrial presence. At the same time, the services offered by the Power Holding Company of Nigeria (PHCN) are riddled by insufficient power supply for growing industrial and residential demands. The rising sporadic power outages have forced all commercial entities in the metro area into securing their own stand-by generators. The major effects are low capacity utilization and higher costs of production for trans-nationals and small-scale local businesses. As a common problem faced in nearby ECOWAS nations, insufficient power supply not only inhibits economic growth, but it creates energy poverty in Lagos. While lethargic power supply triggers annual declining rates of 4.9% in sales in the ECOWAS region, with much of that in Nigeria. The price of gas at $5 billion for backup supply in 2012 impedes profits. For that, any electricity power interruption also prevents water treatment plants from operating and supplying regular water in the metro area of the state where state carriers currently run on huge daily deficits of 300 million gallons of water. To demonstrate additional components of the energy dimension to the environmental problems of the city, it is safe to point out that based on current projections; the power sector suffers from limited capacity due to electricity power deficit of 9,000-10,000 MW and low operational capacity. In light of that, 40% of citizens not only lack access to power grid amidst insufficient or scarce transmission capacity at 150k Wh/yr average energy use, but 80% of the citizens depend on diesel powered generators for electricity. For that, state authorities opine that about 16,000-27,000 MW of power generation capacity are needed in the state by 2030. Notwithstanding all these, the delivery of portable water for urban dwellers and water treatment facilities and the agricultural activities in the state suffer enormously from lethargic power supply. The Mega City of Lagos, with a market sphere of operations under the orbit of international capital, extends beyond the confines of the state to neighboring ECOWAS states where daily business depends heavily on power supply. Access to uninterrupted regular power supply in that setting is crucial to every life and survival in hospital maternity wards and the overall quality of life in the built environment. Accordingly, the continual interruption of electric power generation, given its relevance in development, is a major drag on society and an impediment to energy security in a region of Africa rightfully acclaimed as the emerging frontier of renewable energy.
3.6. GIS Mapping and Spatial Analysis
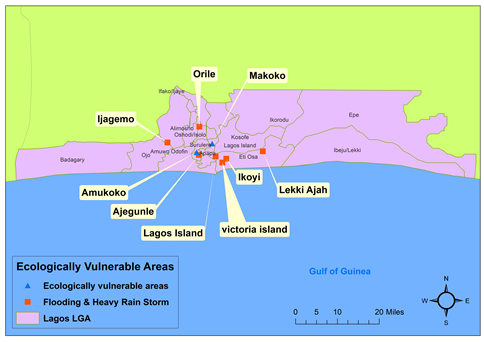
- This segment of the paper presents the geographic aspects in the evolution of various environmental stressors and the associated risks to the study area’s ecosystem. The multi-shade legends depict various indicators in a GIS map. For efficient planning and regular tracking of pollution, waste generation, land reclamation, and rainfall, building collapse, wetlands loss and sustainable land use, designing an index for environmental management for Lagos state spatially under this outline holds promise for planning. This involves the geographic visualization of degradation parameters under different variables in a way not seen in the past in the study area. The mapping under various scales germane to environmental degradation, points to an evolution and gradual dispersion of the risk levels and trends in various areas of the state over time.Based on the information on the map, the environmental pollution pattern in the state adds major insight on the state of the environment in the state. With the common types of stressors listed as atmospheric and environmental pollution apparently visible over the years, the distribution patterns show more concentration of contaminants in the air sheds of the upper northern part of the metro area and the state. With that, the occurrence of pollution seemed clearly present in the heavy industrial hub of the country along Ojata axis in the Ikeja Local government area. Considering the vast concentration of industrial activities in areas around the air sheds of the north side of the city it is no surprise they are threatened by air pollution and atmospheric contaminants. This phenomenon seems further manifested on the mainland and the central part of the city. These areas are where more clusters of communities have continued to see proliferations of environmental degradation involving water contamination, the declining quality of fresh and surface water and health hazards from open sewerages and ditches associated with built up and overcrowded communities of the state in the mainland, especially along the industrial base of oshodi, Orile and Mushin. The other areas on the lower south and coastal zones consists of places like Amuwo, Odofin, Ajegunle, Apapa and Isale Eko that are vulnerable to various forms of pollution as well. Of great concern about the pollution exposures in the coastal south, is the situation in Maroko known for its slums and filthy environmental conditions where open ditches turned into dumpsites for domestic and human wastes pose health risks to the poor in the area (Figure 2).
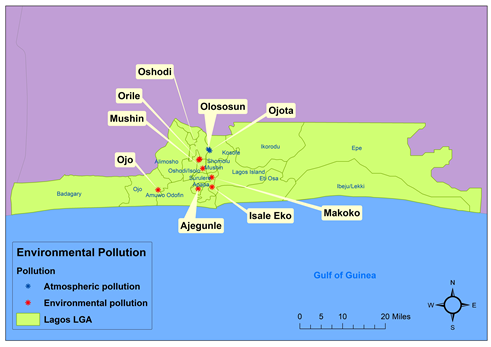 | Figure 2. Environmental Contamination Sites |
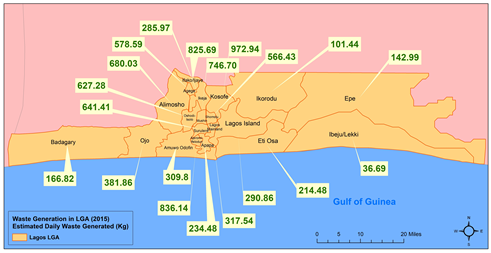 | Figure 3. Waste Generation Volumes, 2015 |
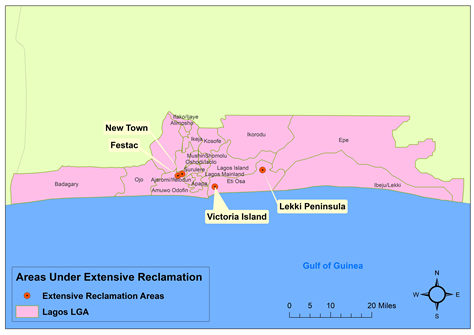 | Figure 4. Areas under Extensive Reclamation |
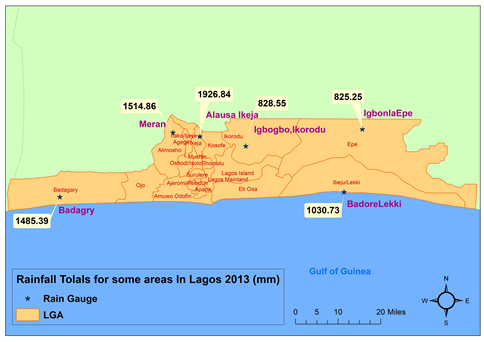 | Figure 5. Rainfall Patterns In 2013 |
 | Figure 6. Flooding Events in Hazards Prone Areas |
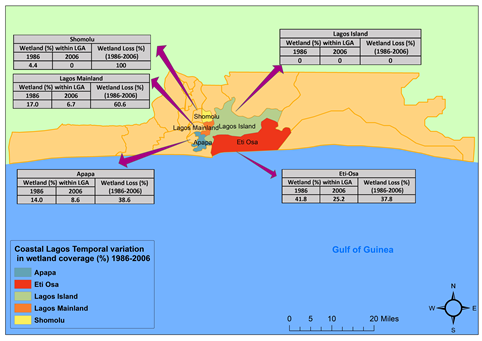 | Figure 7. Coastal Wetlands Loss 1986-2006 |
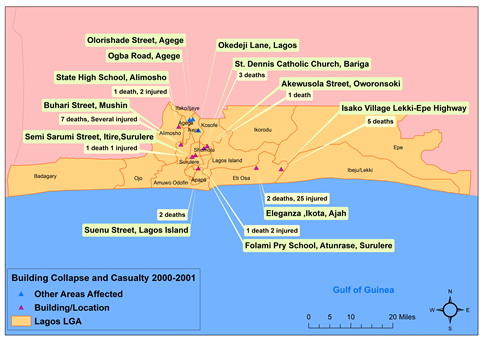 | Figure 8. Building Collapse Incidents, 2000-2001 |
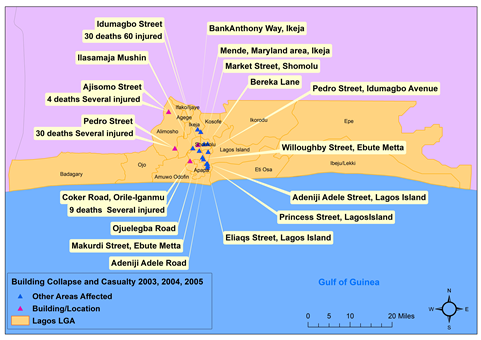 | Figure 9. Building Collapse Incidents, 2003-2005 |
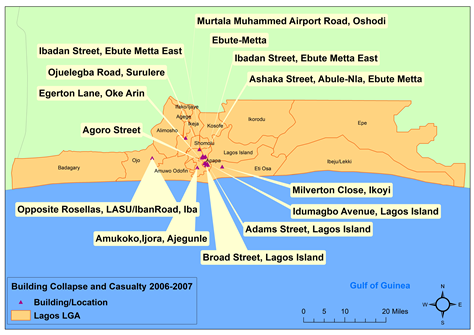 | Figure 10. Building Collapse Incidents, 2006-2007 |
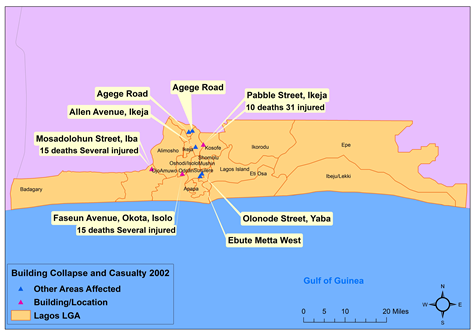 | Figure 11. Building Collapse Incidents, 2002 |
3.7. Factors Responsible For the Mounting Environmental Problems
- The environmental issues facing Lagos does not operate in a vacuum; it seems predicated on a set of factors. Essentially, they emanate from a set of policy, socio-demographic and economic elements, physical and environmental parameters and land use activities. The detailed analysis of these elements is highlighted in the following paragraphs.
3.7.1. Policy, Social and Demographic Elements
- The role of policy and socio-demographic factors stems from Lagos’ position as the seat of economic power in Nigeria with influence on the directions of fiscal policies. Not only did the attributes and strategic position of Lagos factor in the country’s development plans under the aegis of global prominence and the quest for unprecedented growth, it prompted exposures to the environmental challenges besieging the area. This occurred without clearly defined policy shaped by strategies of how and when and where development should take place under growth management. The added advantage of access to West Africa’s Atlantic coast’ global maritime trade route built on network of ports, roads and bridges linking nearby states and nations in those circumstances without growth management increases incursions into natural habitats. This could be buttressed by the changing demography and unprecedented growth rates despite Lagos ranking as the smallest state by land area (only 0.4% of Nigeria land space) and 10% of population. At a growth rate of over 9% yearly resulting in 600,000-1.4 million persons and 4,000 people daily and population density growth of one person per km2 16 times the national average; it is the most urbanized state and places enormous pressure on the environment. Meeting the demands of such a teeming population projected at 25 million for basic city services in the areas of clean water, storm flow and flow deterrence, public hygiene, and sewer management pushed development activities into the conservation belt, which resulted in the conversion of ecologically fragile zones into urban use [5]. Such population growth also translates into increasing pressure on land for housing in marginal areas, business premises, vulnerability of low-lying areas coupled with overcrowding slums and exposure to ecological hazards of building collapse. In a setting where construction of houses has not kept pace with urban growth and expanding populations leading to severe congestion in slums, communities are put in harm’s way by forces unleashed by building in physically marginal areas, resulting in building collapse and the threats of environmental change, hence the role of weak policy elements.
3.7.2. Economic Activities
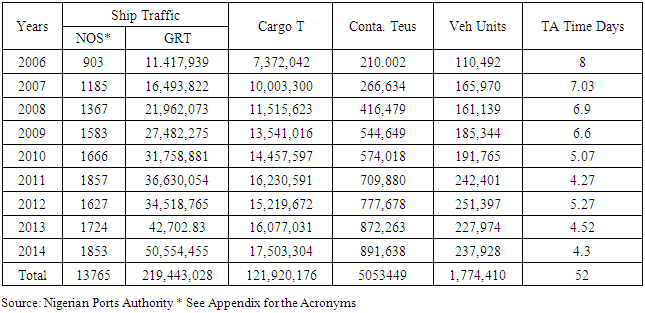
- Lagos being a place known for aquatic natural endowments spanning through large areas, has vast pools of pricey beachfront communities with industrial and commercial development activities ranked high as the economic capital of Nigeria. With its iconic global city representing 40% of Nigeria's GDP and its own GDP of $131 billion surpassing many nations, it has the highest concentration of industries in Nigeria estimated at 70% and connected to about 2,700 km of road network of which 40% are tarred with three major bridges linking Lagos Island and the mainland. As part of the economic engine, an important development in Lagos city over the years stems from the construction and expansion of road networks, canals and seaport to drive commerce with some effects on the ecology. While in response to globalization in 2016, the state initiated 300 road repairs with the addition of 114 new roads, there came a spark in market activities involving distribution, consumption, exchange and transportation of goods and people. The vast flow of merchandizes and, services from various locations via mass transit systems and others over the years epitomizes the volume of economic activities therein. Taking these into account, the role of the vehicular movement as impediments to environmental quality of the state comes with the daily presence of 2 million cars on the road accounting for 30% of them in the country and the volume of yearly movement of cargo operations in the Lagos Port. Given the large dependence of 12,862,000 people (or 57% as passengers) on automobile means of transportation for daily mobility, Lagos exhibits some vulnerability to the emission of CO2 and greenhouse gases at the expense of environmental quality. Added to that, it accounted for a total of 13,765 ship traffic activities and over 5 million containers from 2006 through 2013 (Table 8). The key port performance indicators not only surged on a yearly basis, but also moving them around to and from final destinations for distribution, demand the use of large network of trucks in and out of the city. Such back and forth movements of trucks through the port involving the distribution of goods and daily vehicular activities of millions of cars add further strains to the functional capacity of local ecosystems. This occurs with periodic oozing of leaked oil from trucks that often ends up in the soil and surface and ground water as effluent discharge and runoffs with risks to environmental quality.
|
3.7.3. Physical and Environmental Parameters
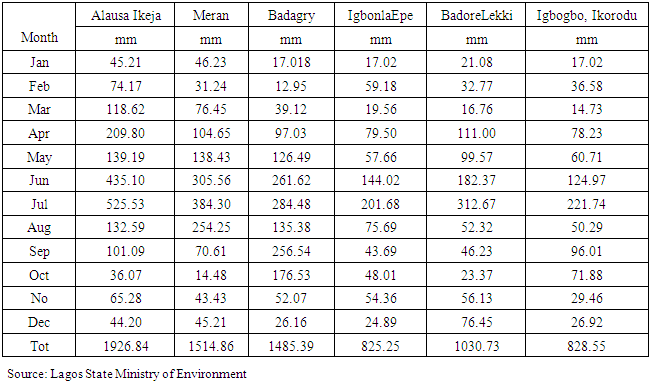
- Different parts of Lagos are located within low-lying areas with high vulnerability to the threats of sea level rise and coastal inundation. On top of that, the humid tropical climate of the areas stems from her coastal location and nearness to the equator. The state also has two distinct seasons; dry and wet seasons. The wet season occurs mainly between April and October while the dry season arrives during the remaining months of the year. Because of that, during rainy season, numerous portions of the state experience storm hazards. In the process, the frequency of inundation in built-up areas from poorly managed growth of impervious surfaces during urbanization lead to increased runoff from precipitation. The other root causes of degradation come from building on floodplains, lack of storm water drainage and poor maintenance of drainage systems. Under these circumstances, the variations in the strength of rainstorms and concomitant inundation pose significant risks to Lagosians. The assessment of heavy rainfalls for Lagos from 1960-1980 indicates that most rainstorms for those two decades seemed lower in intensity at less than 12.7mm of precipitation but still very deadly enough. Data for rainfall in the coastal areas like Lagos Island from 1971-2005 reflect a pattern of substantial storms during 1996-2005 despite the fact that the frequency of precipitation days yearly waned (Figure 4). Another element is that Lagos is a place where much of the upscale residential developments are adjacent to 100 meters of fragile coastline prone to flooding and sea level rise. These risky attributes are consistent with recurrent high tides and violent rainstorm floods common in the coastal zone and mainland Lagos. In July of 2011, when heavy tidal waves from rainfall overwhelmed the state of Lagos for 21 days, most areas besieged suffered from shoreline erosion with impediment to circulation and destruction of infrastructure and assets. Furthermore, the sea level surge of 2006 measured at 4.9 feet (1,5 meters), was so huge that it exceeded standard thresholds under 48 hours with threats to many coastal areas. Under these circumstances, the associated pollution threats originate from the emission rates for Lagos estimated at 1,44 Trigrams annually. This remains exceedingly higher at levels surpassing Beijing, Tokyo, and London where the corresponding emission levels comprise of 1.23,0,46 Tg/year,- 0.13 Tg/year. With over six million automobiles on Lagos high ways annually, coupled with gas emissions from millions of electricity generators in the state, the air toxics from all the mobile and stationary sources pose enormous threats to community health due to exposure to carcinogenic materials and related ailments and food contamination. Furthermore, the emission of and high concentration of greenhouse gases in the city is also a major purveyor of climate change induced hazards implicated in environmental degradation. This is consistent with storm surge and torrential rainfalls associated with flooding in the state.
3.7.4. Land Use Development and Urbanization
- The phenomenon of chaotic mix land use in the Lagos metropolitan region includes lack of compliance in a setting in which existing commercial places, especially markets are being expanded without due compliance with appropriate planning regulations. In the process, mandatory planning guidelines such as car park requirements and set‐backs, and green spaces among others are usually unmet. Historically, religious places have always been part of residential facilities in the mixed land use structure of Lagos that saw rapid development. The mounting needs for urbanization infrastructure in those settings, reflects the seemingly growing prices of cement. In the periods of unparalleled urban development in the Lagos area, the price of building materials like cement, essential in the design of new homes, surged significantly year after year from 1986 to 2010 at an initial of N23.50 to N1,800.00 (Figure 12). This in turn hastened the quest for conversion of open land to development activities and uses, pitting natural areas against other competing land uses. These practices accelerated developments in ecologically fragile zones prone to recurrent hazards like flooding and exposure to sea level rise dangers for coastal communities of the state. This is also evident with the proposed emergence of a new artificial city island from the sea off the coast of Lagos as part of shoreline land use despite known vulnerabilities including coastal flooding in the face of climate change. The proposed area is likely to sit on a foundation built on sand dredged from the ocean floor over a distance of 10 km in a city of soaring buildings and housing for 250,000 people sustained by sewage and a great wall of 100,000 five-ton concrete against flooding. The downside is that the pursuit of such ambitious developments in light of the threats of sea level rise, could compound exposure to low lying areas frequently besieged by coastline flooding and torrential rainfalls.
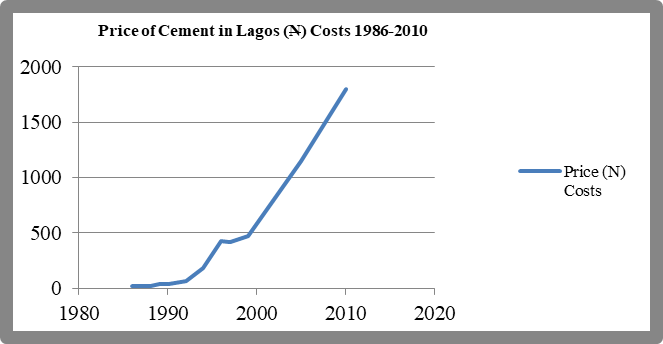 | Figure 12. The Costs of Cement in Lagos State, 1986-2010 |
4. Discussion
- In the context of environmental issues facing the study area of Lagos state, the data analysis revealed the widespread occurrence of ecological changes in the form of gains and declines in some of the parameters. With much of the variability statewide, emanating from forces located within the larger socio-economic, physical and ecological elements. Based on the mix scale tools of descriptive statistics and GIS all through 1963-2017, Lagos saw visible ecological change along the coastal areas with notable exposures to climatic hazards. This involved heavy rainstorms resulting in flooding and the destruction of structures and displacement of citizens in affected areas. Further instances of change involves the variability in the coastal land cover of the state, which underwent extensive changes that effected different competing land uses from 1986-2002. During that period, the development of land cover components surged extensively given the sizable proliferation of residential, industrial, commercial, and transportation components alongside other man-made uses with increases from 85.44 km2 (43.36%) to 111.89 km2 (56.78%). Considering the declining pace of fragile natural areas made up of mangrove and swamp habitats from 59.24 km2 (30.06%) to 38 km2 in these periods. It is then not surprising that the rapid pace of urbanization fuelled partly by teeming population resulted in unprecedented development along the shorelines that attracted the presence of metro residents who moved into ecologically fragile areas in droves. Such a massive buildup accelerated the vulnerability to sea level rise on coastal shorelines classified as potentially prone to flooding and submergence as result of changing global climate parameters.Notwithstanding the risks from heaving flooding and sea level rise, and the spillovers from urban growth at the expense of environmental safety, the patterns of urban land use trends between 1976 to 2008 not only point to a soaring pace, but residential development surpassed the others by 8,939 to 9,669 hectares at sizable percentage rates (51.9-52.1) from 1976-2008. Besides, the risks of inundation faced in the state remains further compounded by the growing magnitude of wetland disappearance among the coastal area counties or Local Governmental Areas. With the rapid pace of urban development and population growth overstretching the available space, natural storm barriers such as wetlands, which ought to be serving as protective reservoirs and buffers to absorb rainstorms in coastal areas, continued to decline. This was the case in the coastal Local Government areas in the ten-year span from 1986 to 2006. At that time, the counties of Apapa and Eti-Osa posted similar levels of declines of 38.6-37.8% while the Lagos Mainland area emerged with losses in wetlands estimated at 60%. The dangers therein is that with many sources of inundation in urban areas emanating from unrestrained increase of impermeable surfaces from reclaimed areas, serious risks do exist in erecting new homes on areas adjacent to floodplains and communities lacking storm water drainage capability where failure to maintain existing systems exposes citizens. To mitigate these challenges, considering their gravity in the state, the paper offered several suggestions ranging from the need for effective policy to the regular assessment of local ecosystems. See the Appendix for more on these recommendations.
5. Conclusions
- This paper has examined the growing environmental issues facing Lagos state in the southwest region of Nigeria. Building on the analysis of the ecological trends in the study area, the enquiry revealed some notable findings captured under the following rubrics. 1) The Study area faced with mounting environmental problems; 2) Mix scale approach quite fundamental in the analysis; 3) Ecological issues in Lagos associated with several factors; 4) Competing land uses leading to soaring coastal development in ecologically fragile areas.From everything observed so far in the study, it is clear that, as an epicenter of environmental disasters, the state of Lagos faces mounting challenges as manifested over time. With these problems evident through heavy precipitations resulting in inundation and damages to fragile natural areas, variability in climatic patterns continually threatens the ecology of surrounding areas. For that, Lagos state not only encountered exposures to possible sea level rise emanating from climate change, but the residents have for many years been subjected to the daily discomfort of excessive waste production littered along surroundings amidst uncoordinated waste management impeding surface and ground water quality and ecosystem health in different areas of the state including the metro. This came in the wake of rapid urban development, which resulted in degradation, and pollution of water resources. The precarious position of the state remains compounded by geology, and the emergence of new settlements on poorly drained marshlands and the concentration of people on unsafe floodplains and riverbanks threatened by sea level rise and flooding. The city suffers from the proliferation of tainted water, leaky water pipelines and the daily deficit of 300 million gallons of portable water supply. Lethargic power source impedes water flow and treatment facilities resulting in sporadic production and losses in the state. Considering that, this amounts to deprivation of water resources at the expense of local citizens in the state of Lagos as part of the mounting environmental problems. This enquiry held up very convincingly in furnishing an exceptional compilation on the issues and state of Lagos environment for decision makers in a way not done before. Such contributions will sharpen their focus on mounting environmental issues while keeping them grounded on the gravity of threats in the face of uninterrupted development and the need to manage it sustainably. In that way, highlighting a compilation of the state’s ecological issues reinforced the significance of this enquiry in improving the ability of mangers with many opportunities for the adoption of best management practices as part of the mitigation measures in affected areas of the state. Based on the research outcomes, the applications of mix scale methods emerged quite timely and clearly in helping set the contours shaping the analysis of the environmental issues convulsing Lagos state. The use of descriptive statistics and GIS mapping as analytical tools of the approach, injected a fresh mindset on approaches to regional and state level enquiry on the environmental impacts of development. Seeing that effective assessment and management of the environment ranks high in sustainable development and ecological health of any geographic area be it cities, regions, and states communities. The mix scale approach did emerge crucial in designing the indices vital in sustaining decision support tools at different levels of governance. This approach was quite vital in outlining the study area and in highlighting the trends, as well as the gathering of data on environmental variables, land use, socio-economic elements, pollution and land degradation. The other dimension to the technique’s significance involves the design of temporal and spatial information and dispersal of ecological and socioeconomic and physical parameters of land use, water and demographic and degradation elements tied to development activities in Lagos over time. The model also drew attention to variability in the frequency of water supply, the population served by water supply, the consumption and distribution, land use under different categories from urban, open space to institutional types, the conversion of coastal wetlands and loss of natural areas and the volume of heavy precipitation. Being part of a visual analytical template, the system serves an essential purpose as decision support for managers tasked with spatial analysis of environmental degradation involving flood damages, heavy precipitation, wetland loss and development impacts in the state. Accordingly, GIS mapping was quite vital in stressing the spatial dispersal of predictors of environmental degradation throughout the state and the metro areas of Lagos by focusing on the hazards of ecological change and their diffusion as a prelude to effective planning. Identifying the spatial temporal distribution of environmental risks from development in the form of damages from building collapse, coastal wetland loss and the problems of climate change as presented herein assists decision makers in the formulation of effective measures and novel guidelines to manage the natural and built environments. The concrete applications of a mix scale model comprising of mappings and the assembling of environmental and demographic indices, as investigative tools herein, augments our common understanding of environmental challenges germane to Lagos state. The socio-economic and physical elements located within the larger ecosystem including the natural forces, changing demography and the pressures from the interactions between these elements occupy an essential spot in evaluating the extent of environmental degradation in Lagos. With Lagos iconic global city representing 40% of Nigeria's GDP and its own GDP of $131 billion, surpassing many nations built on pro-growth policies, the state has the highest concentration of industries in Nigeria. Added to that, the city’s port saw rising volumes in its operations totaling 13,765 ship traffic activities and over 5 million containers distributed to destinations by trucks known for high CO2 emissions from 2006 through 2013. Another consideration is the population growth rate of over 9% yearly with over half a million new people yearly, and the fact that it optimizes incursions into natural habitats with pressures on the environment. The frequency of inundation in built-up areas, prompted by poorly managed growth in impervious surfaces during urbanization, accelerated runoff intensity from rainfall and building on floodplains with major risks. Other instances of ecological factors stem from the dangers posed by heavy rainfalls, and wetland disappearance in coastal counties and atmospheric contamination from emissions involving mobile and stationary sources such as millions of cars plying through the roads and generators. All these pose enormous threats with the concentration of greenhouse gases as a source of climate change induced hazards like storm surge and torrential rainfalls associated with flooding in the state hence the ecological changes. In so doing, the enquiry on the one hand echoed the significance of socio-economic and physical parameters shaping the changing environment and the impact of industrial activities and physical forces. On the other hand, it did show the mode upon which the fragile ecology may have been affected by spillovers driven by stressors through contamination, degradation and water pollution from physical elements, mobile and stationary objects and other elements at the expense of ecosystem quality. Reaffirming those linkages given the exclusion in previous studies puts a major issue into the spotlight through this enquiry. Without the efforts herein, there would have been no way of knowing how the changing ecology of Lagos emanates from different factors. Given the focus on ecological issues and the effects, the research outcome has the potentials to shape the way states or regions and managers respond to environmental impacts of development utilizing the indices assembled herein. They are not only vital devices built to strengthen policy by injecting best management practices; the belief is that it will make people become better custodians of the ecosystem. This would enable the state and its cities formulate strategies best suited to the containment of degradation threatening delicate ecosystems from development. Accordingly, the enquiry offers managers a better knowledge of unidentified hazards.The other vital exposé from the study comes from the impacts of competing land uses on soaring coastal development in ecologically fragile areas over time and the way it sparked parts of the growing evolution of the Lagos environment. The effects and pressures of competing land uses on the local ecosystem most particularly urban land use activities all through 1976 to 2008 shaped changes in areas devoted to residential, commercial, industrial, institutional and transportation in Lagos state. During the periods of 1976-2008, when residential land varied from 8,939-9,669 hectares, industrial, institutional and transportation types soared. This trend continued unabated among other land use categories during the periods of 1976 to 2015. At that time, urban land area as a key predictor of the change showed notable percentage levels than the others, beginning with 6.4-16.1 and 17.6-22.6% all through 1976 to 2015 while land devoted to agriculture went from 2.4% to 4.6%. As part of that, the percentage size of wetlands not only fluctuated in 1976, 1995, 2007 and 2015. The percentages of change highlighting a mix of gains and declines from 1976-2015 involving various land uses showed agricultural land areas and wetlands declined by -85.52 to -7.92 percentage points respectively. On the contrary, forestland and water rose by 16.81-31.94%, urban land use areas grew at a triple digit rate of 248.96% from 1976-2015. Added to that, wetland disappearance among coastal local government coastal areas of the state between 1986 to 2006 culminated in changes as manifested in the percentage of wetlands areas spread across three counties at rates of 38.6- 37.8- 60.6%. With the effects of the pressures and stress from competing land uses on ecological fragile areas now apparent, the state saw rising cases of storm surge, and heavy hazards in low-lying communities. In process, the 2010 flooding event in Lagos destroyed 830 structures that rendered 5,030 citizens homeless. At that pace, much of the areas in the state are not only prone to the threats of sea level rise and possible submergence to water in the coming decades due to climate change hazards. There will be potential damages to the economy and the environment estimated in the hundreds of billions of dollars. While evaluating these risks offers new avenues for mitigating recurrent hazards during the development of human settlements in ecologically fragile coastal areas through rehabilitation. Identifying these connections, given the limiting capacity to predict the effects of development in a sensitive coastal ecosystem, stands out on its merits as a key leap in research, knowledge building and management. Pinpointing such problems as the disappearance of wetlands attributed to uninterrupted urban expansions into coastal areas and the pressures of competing land uses as shown herein not only affords the state an opportunity to pursue the right path towards restoration and mitigation, but it puts future management of the coastal environment Lagos on a much stronger level than ever. Seeing the pervasive environmental problems faced in Lagos state, the prevailing factors fueling it, the economic potentials and ecological risks as shown this enquiry, researchers and decision-makers in the state would be eager in the years ahead to seek thoughtful responses to many pressing queries relevant to the management of the ecosystem. The questions involve what are the vulnerabilities of Lagos to the impacts of climate change? How sustainable are the development approaches in Lagos? How will Lagos adapt to environmental change? In what ways can Lagos contain its rapid urban expansion? How can current regulatory approaches address emerging environmental crises pertaining to pollution and limited water access in Lagos? Building on these queries, there are ample possibilities for scholarship and the decision making to refocus development strategies with guidelines stressing ecological protection. This will enable Lagos to keep its current development approaches bound by sustainability for posterity.
Appendix
- 4.1. Recommendations To address some of the concerns that were identified in the research, five recommendations are presented below as part of the remedies. 1) Adopt effective policy to ensure the prompt mitigation of recurrent environmental hazards in the city. This would enable managers tackle such critical issues as the vulnerability of the state and its mega city to extreme climate events including incessant flooding with proactive actions built on mitigation and adaptation. 2) Develop regional environmental and economic information System to promote efficient tracking and inventorying of greenhouse emissions and the emission of CO2 and scale of degradation statewide. The belief is that this could address concerns about limited access to data on the area and the calls for the design of a central data infrastructure on ecological and economic information so that planners can effectively track the risks from development pressure.3) Incorporate growth management principles into the policy framework in a way that would ensure orderly development. While the emphasis should center on containing spillovers from unprecedented urban expansion that ravaged the fragile ecosystem in metro Lagos and other parts of the state. This should be an improvement from the chaos witnessed over the past decades given the frequent pace of building collapse in different areas prompted by uncontrolled urban growth, massive pressures from population increases in the city, decaying infrastructure and the lack of adherence to safe building standards. Without the adoption of growth containment principles, the city runs the continual risk of uncontrolled growth that is overstretching the carrying capacity of the environment and local resources. 4) Provide green planning education for city managers, developers, and the public in the state. This would go a long way in raising awareness about the dangers of initiating future developments in areas deemed adjacent to sensitive natural habitats known for their ecological services for communities while aquatinting them of the risks of encroaching on ecologically fragile areas. Instilling these principles in citizens would help minimize the practice of issuing development permits resulting in coastal wetland conversion and continual emergence of new settlements in geologically unstable low-lying terrains. 5) Carry out regular assessment of the local ecosystem quality in the face of widespread degradation ravaging the state. With some of these concerns made up of inadequate waste disposal, water pollution, epidemics of water borne diseases with human causalities and the fact that much of Lagos water is undrinkable, the paper calls for regular risk assessment of the state’s environmental resources so that citizens can be assured of safe access and better use of their surrounding ecosystem.
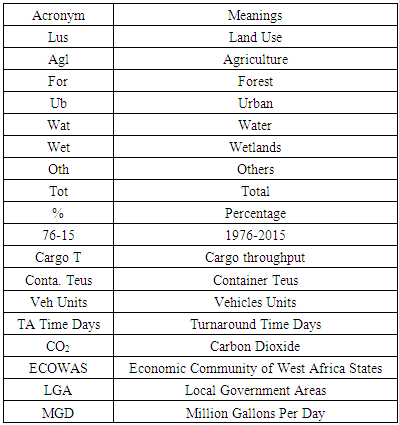
Acronyms