Seah Soon Teck Allan , Hyeong-Ill Kim
Department of Architecture, National University of Singapore, Singapore
Correspondence to: Hyeong-Ill Kim , Department of Architecture, National University of Singapore, Singapore.
| Email: |  |
Copyright © 2016 Scientific & Academic Publishing. All Rights Reserved.
This work is licensed under the Creative Commons Attribution International License (CC BY).
http://creativecommons.org/licenses/by/4.0/

Abstract
Ever since the term “sustainable architecture” was coined in 1998 by Trivelli Alessandro, green architecture has been an increasingly common sight within the industry. Tropical cities like Singapore are a prime example whereby vertical landscaping is starting to shape the built environment. While the prominence of vertical landscapes is facing a steady increase, its implantation still exists on a broadly superficial level where it is merely established on visual aesthetics appeal. Furthermore, there is little evidence to back up its sustainable values during a project’s design phase and even after its construction. With technology advancing rapidly with the influx of Building Information Modeling and open-source simulation programs, vertical landscaping is either last or never even on the list of deliverables included in the design model. Due to the nature of landscape material properties, it is often seen as an element that is organic and less predictive as opposed to hardscape elements like walls, thus causing it to be omitted in the convenience of time and effort. However, in order for tropical architecture to excel, incorporating landscape with software during a project’s design phase is a fundamental step. On top of meeting the needs of a tropical architecture, the adequacy to justify and provide accurate values would be key to achieving a sustainable built environment. Henceforth, this dissertation analyses the possible strategies in mapping out vertical landscape as a pattern to shape and define tropical architecture. Based on case studies, a 3D-model with landscape plant species suitable for vertical landscaping can be established as pattern layers in BIM software to simulate and gather values that correlates to building performance.
Keywords:
Vertical Greenery Systems, Building Information Modeling, Simulation, Tropical Architecture
Cite this paper: Seah Soon Teck Allan , Hyeong-Ill Kim , A Study of Workflow for Simulations of Vertical Greenery Systems, Architecture Research, Vol. 6 No. 6, 2016, pp. 142-153. doi: 10.5923/j.arch.20160606.02.
1. Introduction
Although tropical architecture is becoming increasingly popular in Singapore, the implementation of Vertical Greenery System, VGSs with architecture may still solely exists within a mere superficial level of aesthetics. A false branding image of ‘sustainability’ or ‘green washing’ may be accompanied by such architecture claims. ‘Green-slapping’ is then a term personally coined by the author, resulting in the abuse of such green systems, whereby buildings are slapped with greenery to create an illusion of sustainability while the project itself provides little to no evidence to support its sustainability claims. Today, technological advancements and the emergence of Building Information Modelling (BIM) and simulation software begins to push the boundaries of digital simulation, analysis and ultimately, architecture. BIM by 2016 within the Architecture, Engineering and Construction (AEC) industries whilst addressing the problems of compatibility of landscape architecture with current BIM software programs. A.M. Ahmad (2012) mentions how the potential for BIM today is “yet to be fully exploited and explored due to a staggering challenge of economical; social; legal; educational and technical constraints” [1]. Krygiel, E. and Nies, B (2008) claims that the ultimate goal of BIM is providing an endless range of possibilities targeted towards a design project through a combination of functionalities. They developed a BIM roadmap showing an example of how such features come together to demonstrate the interrelationships [2]. The key idea behind BIM is to digitalised the continuous and interlinked ‘process’ of the building, integrating every element, from design to construction and even to minute details like building services and landscape. However, omission of greenery is a common sight during the digital design model process. While landscape comprises of a magnitude of greenery systems, ranging from trees to terrain, the research paper would only focus on vertical greenery systems. The reason is the context of vertical greenery’s increasing trend and its potential to influence tropical architectural building’s performance. In light of this reason, this research paper studies on how efficient and accurate BIM is able to process vertical greenery digitally to justify the claims of sustainability it is able to offer in terms of building performance.The Models would need to be of a simplified version capable of fast, efficient and ultimately accurate simulation results. The issues of a comprehensive database for landscape architecture related 3D-models is further shadowed by the complexity of 3D models with regards to softscape/ plant materials. The parametric parameters of a single plant itself contains a huge amount of data due to it being a natural element. Plants are not always in a fixed state of volume due to factors like constant growth. Furthermore, plants foliage is unlike a solid wall surface, its element properties are subjected to change according to external factors like wind and light. Taking that and multiplying it to apply to a VGS model would be on an entirely different level. Material databases also pose another issue. Whilst there are usually predefined settings for architectural components like concrete, masonry or timber materials, there are little information pertaining to plant materials. Although certain software may allow for customisation, the need to research and establish the various parameters to define the materials requires additional time and effort questioning its practicality for commercial architects. The objective of this paper is to establish the feasibility of applying VGS as part of the BIM process in evaluating building performance during a project’s design phase, and ultimately progressing successful tropical architecture alongside technological improvements in building design.Currently, there are various different VGS available, ranging from vertical green walls to green roof. However, this research paper focuses primarily on vertical green walls, as the existence of a concrete bedding in green roof systems poses little to no problems in including it into 3D-Models. Vertical green walls, on the other hand, are seen as an organic façade that may only be supported by steel mesh frames, thus exposing the interiors to daylight and temperature factors. In light of this reason, this research paper study would then focus solely on facade VGSs, and in turn excluding other vertical greenery systems. This paper is then divided into three primary segments. The first part proposes a classification of the various VGSs within the current local context and then attempting to narrow down the selected VGS used for BIM simulation. The second part focuses on literature reviews and a selection of case studies of failed exemplars. The case studies, whilst shedding light on factors leading to its failures, would also assist in establishing a series of parameters for BIM simulations. Lastly, the paper will address the possible issues faced during the BIM simulation process. It will also attempt to explore the numerous methods of simulation in BIM to conclude the suitability of modelling VGSs for practical usage during a project’s design phase.
2. VGS in Singapore
Singapore is a small country with a land area of only 719km [3]. This means that competition of land use would be inevitable and greenery would usually have to give way for building developments. The idea of urbanisation is closely linked to that of a concrete jungle which resulting effects led to a phenomenon known as the urban head island (UHI) effect. This led to the idea of introducing nature back into the urban built environment, which then aims to create a new sustainable urban lifestyle [4]. However, Singapore still manages to be a self-proclaimed “Garden City,” with the city being associated with abundant greenery and a clean environment. Coined in 1967 by then Prime Minister Lee Kuan Yew, the vision for a Garden City has evolved over the years to become a “city in a garden”. The country’s clean and well-organised city is used to promote herself as a tourist destination and also assist in attracting foreign investments. Starting from the development of tree-lined boulevards to proposals of new parks and park connectors, greenery in Singapore has ultimately led to bigger roles like the recent guidelines for building regulations.
2.1. Skyrise Greenery Incentive Scheme 2.0
Introduced in 2009, the Skyrise Greenery Incentive Scheme (SGIS) was set up to increase greenery provision within the local built environment. The scheme covers the installation costs of rooftop greenery and vertical greenery in local projects, with total compensation of up to 50% of installation costs. This scheme is one of many examples of how the local government is facilitating and promoting the integration of intensive landscaping together with the built structures. In April 2015, the scheme was revised and further enhanced, providing a higher cap of funding.
2.2. Different VGS Available
VGS traditionally revolves around “climbing plants with self-clinging roots growing directly on building surfaces, twining plants growing on trellis and pergolas, or plants within the crevices of stacked rocks” (NParks, SGIS 2015). However, over the years, the innovations of contemporary systems have allowed for a wider variety of plant species suitable for planting on vertical surfaces. The SGIS website categorises VGS into four broad categories: “Support systems, Cassette systems, Planter systems and lastly Pocket systems.” (Figure 1 and Table 1)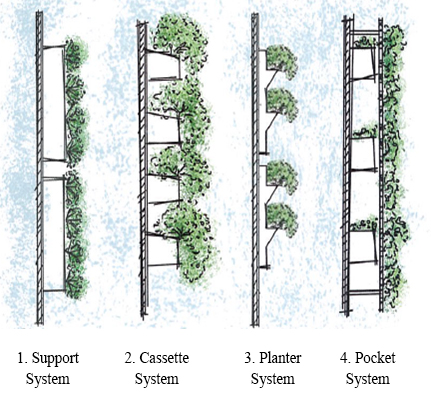 | Figure 1. Broad Categorisation of VGS According to National Parks Board (Source: Image from NParks Skyrise Greenery Incentive Scheme 2.0 website, 2015) |
Table 1. Different VGS Description
 |
| |
|
Living wall systems, which usually consists of Modular systems, allows for complex design with vertical, angled or horizontal planting interface. A wider variety of plant species are suitable for living wall systems as compared to the other traditional green façade systems, which are usually comprised of creepers or climbers’ plants species. Green façade systems on the other hand, allow for daylight and wind to enter into the interior spaces as the backing allows for mesh panels instead of solid concrete walls. This research paper would solely focus on the latter green façade system whereby simulation could accommodate for results pertaining to daylight saving, shade and thermal comfort as compared to the living wall systems.
2.3. The Need for VGS in BIM
In order to continue pushing the boundaries of the potential of tropical architecture, it then becomes imperative to incorporate the system together with BIM. Numerous research papers have suggested the benefits of greenery, ranging from creating conductive environment for social activity [5], promotion of positive effects on mental health [6], acoustics dampening [4], and ultimately the cooling of the surrounding microclimate. However, it is also important to note that design decisions can have serious impact on energy consumptions of VGS. According to a study done by Queensland University of Technology in 2012 [7], examples on choice of vegetation, growing medium geometry, building orientation aspect and other factors can adversely affect the energy consumption outcome of VGS. The paper also provides evidence that Leaf Area Index (LAI), defined as the amount of leaf surface area per unit of wall or ground area, can play an important role in plant selections. Plants with larger LAI (typically greater than four) are able to contribute to greater savings as compared to plants with LAI lesser than two; which may have the adverse effect and instead consume more resources like water and energy. A difference of two centimetres within a plant growing medium thickness can cause drastic variations in the result of energy savings, from 2% up to 18%. Hence, it is important for BIM simulation to be included in such large-scale tropical architecture projects. VGS without proper well-considered design parameters may not only fail to achieve its expected sustainable values but would also require additional energy and costs to cool the building. Furthermore, little to no evidence is available to predict the success of VGS prior to the design phase, during construction and even after the project’s completion. Currently, it is only after a specific amount of time leading to the growth and maturity of plants that the success or failure of a VGS can be determined.
3. VGS 3D-Model: Oasia Downtown, Singapore
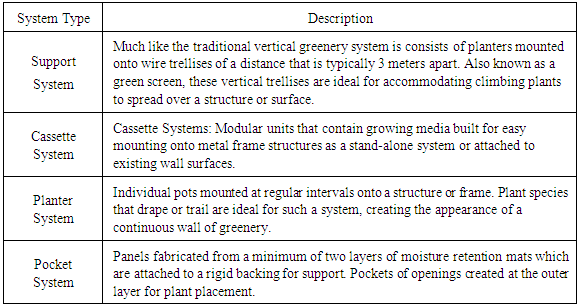
The agenda for this research paper is to replicate simulation results that are able to assist architects in making better design decisions pertaining to VGSs during a project’s design phase.The selection of Oasia Downtown (Figure 2) to be the primary case study for simulation purposes is due to it being a local project in which all four-elevation facades are cladded in vertical greenery. The tower supports three large Sky Gardens and a Sky Park overlooking the central-business district cityscape. Each of the apartment, office and hotel rooms are one unit thick. When paired with the ‘screens of green’ façade, cross-ventilation, increased exposure to daylight and a wider field-of-view of its surrounding environment then becomes a possibility.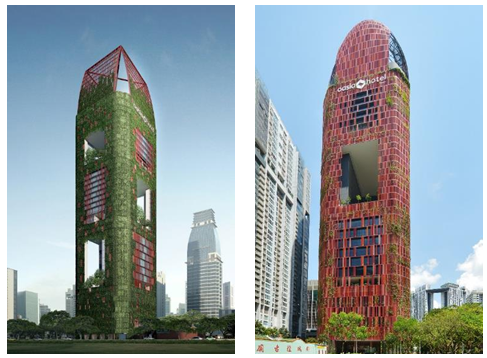 | Figure 2. Render of Oasia Downtown (Left) Compared to Photograph of Current Oasia Downtown (Right) (Source: Left: Render from WOHA Architects; Right: Photograph by Alphonsus Chern, May 2016) |
3.1. Software Programmes and Workflow
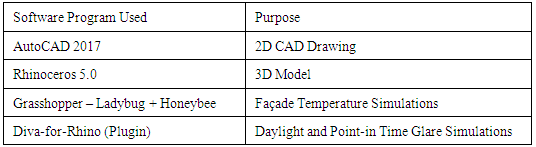
Majority of the software commonly utilised by architects today are not considered BIM tools. Instead, these software are instead considered as a BIM ‘process’ that aids in the overall design of the BIM tool. Furthermore, developers have introduced plugins that allows certain BIM ‘process’ software to function in a similar manner as BIM ‘tools’. Numerous software are also currently in the beta phase of converting to BIM, examples includes Trimble Sketchup and RhinoBIM. Henceforth, the research paper will include BIM ‘process’ software to be part of the simulation studies. Thus, a workflow chart was then created with the following software programs utilised during the whole process, from recreating Oasia Downtown, to VGS plant patterns and ultimately for the simulations test runs (Figure 3 and Table 2). | Figure 3. Workflow Chart (Source: Author, August 2016) |
Table 2. Software Program Utilised
 |
| |
|
3.2. Leaf Area Index Data for VGS 3D-Model
Antigonon leptopsus (Scientific name) also known as Coral Vine (Common name) and Ipomoea (Scientific name) aka Morning Glory (Common name), are two of the selected plant species for the VGS adopted by the landscape consultants of Oasia Downtown (Figure 4).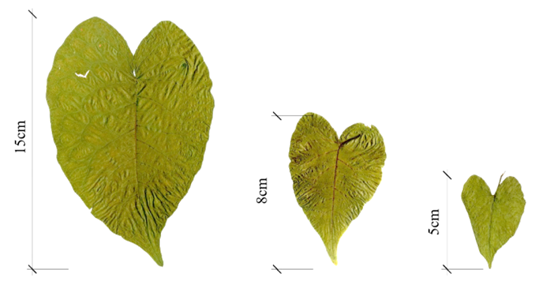 | Figure 4. Antigonon leptopsus Leaves Samples Obtained from Site (Source: Author, August 2016) |
Leaf Area Index or LAI represents a dimensional measure of the vegetation, precisely detectable through an optical instrument (Chen and Black 1992). It has been proven in the study done by UMD (2012), that the amount of cooling, heat flux and reduction in ambient temperatures provided by a green façade is directly related to the amount of leaf area present in the VGS. Therefore, in order to conduct VGS simulation studies in BIM, the acquisition of LAI data is a necessary step.
3.3. Simplified VGS 3D-Model: Plant Patterns
Replicating the plants in terms of leaf percentage coverage, LAI estimation, plant growth stages as well as depth of plants to create a simplified pattern was the next step. A standard size of 1000mm by 1000mm square layout was set up as the basis for creating the base 2D model. Based on data gathered, the current VGS was estimated to have a value of 25% greenery coverage. From there, the following green walls were established to estimate the growth values of 25-50%, 50-75% and lastly 75-100% green coverage. This is necessary to highlight the different effects of VGS on building performance during the various plant growth stages. Pixelating the leaf patterns into simple geometric squares was the most efficient method, allowing for easy replicating results for another plant species. A grid size of 15mm by 15mm was determined for the pixelated plant pattern.
3.4. Simplified VGS 3D-Model: Plant Patterns with Depth
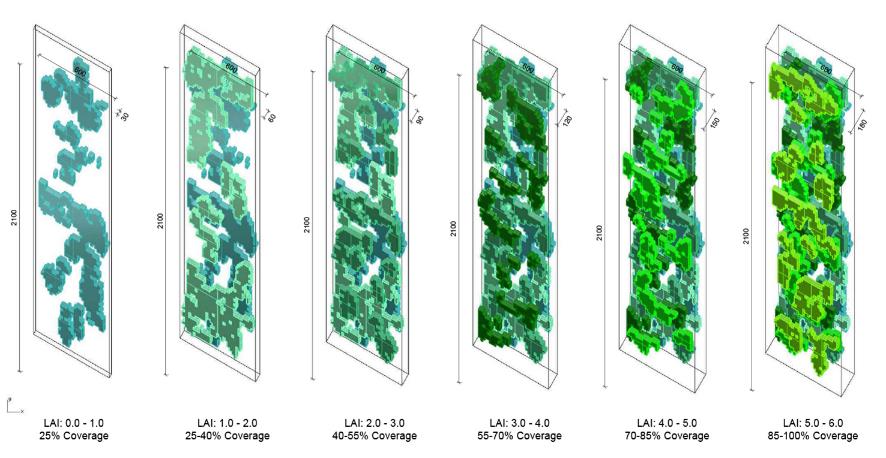
After setting up the pixelated patterns in terms of percentile greenery coverage, switching to a three-dimensional view raises the issue of evaluating the thickness and depth of the plants. This led to a second attempt in recreating the plant patterns. The second method proposes a constant plant coverage of 25% but generated into six different randomized patterns. Labeling the patterns one to six, each pattern would then be stacked onto each other thus replicating the perception of plant growth, greenery coverage and LAI. With each stack of pattern, the LAI would increase from 0.0 to 1.0 and ultimately to 6.0; while the percentile coverage would increase from 25% to 85%. (Figure 5)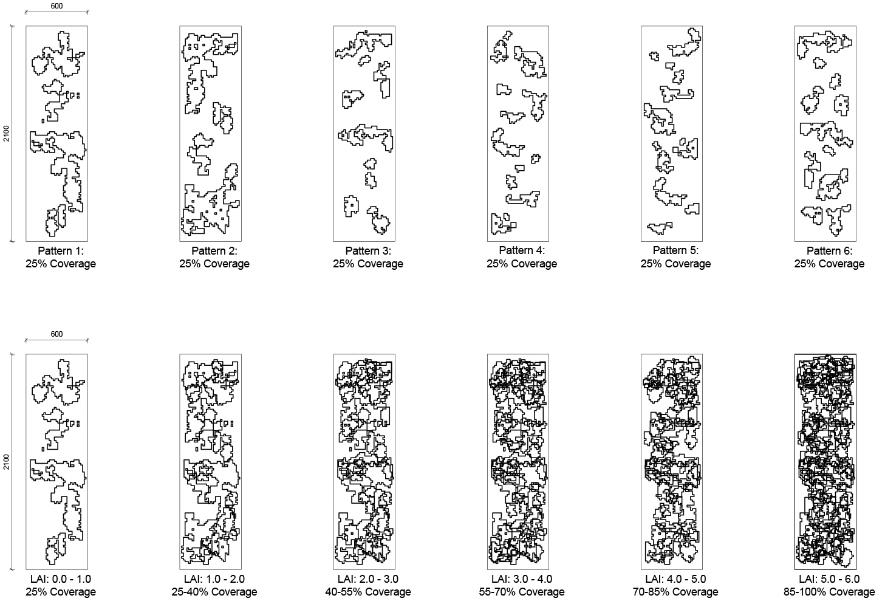 | Figure 5. 2D-Model VGS Process: Plant Growth, Green Coverage and LAI (Source: Author, August 2016) |
The second method of stacking plant patterns then solves the issues of plant depth and thickness when recreating the 3D-Model of the VGS. According to Figure 6 and 7, each pattern would then be extruded to have a thickness of 3cm, ultimately stacking to a total thickness of 180cm. A study on thermal improvement by means of leaf cover on external walls claims that “there was no difference in transmittance as long as the canopy (of vertical greenery plants) was greater than 20cm” (Holm 1989). Furthermore, according to the study done by UMD (2012), it claims, “the minimum thickness of the plants can be near zero, it is also unclear what the maximum can be, especially since there could be a strong species (plant) effect.” Henceforth, the decision to cap the maximum value for the plant thickness was at 18cm in order to simulate results with relation to the varying stages of plant growth.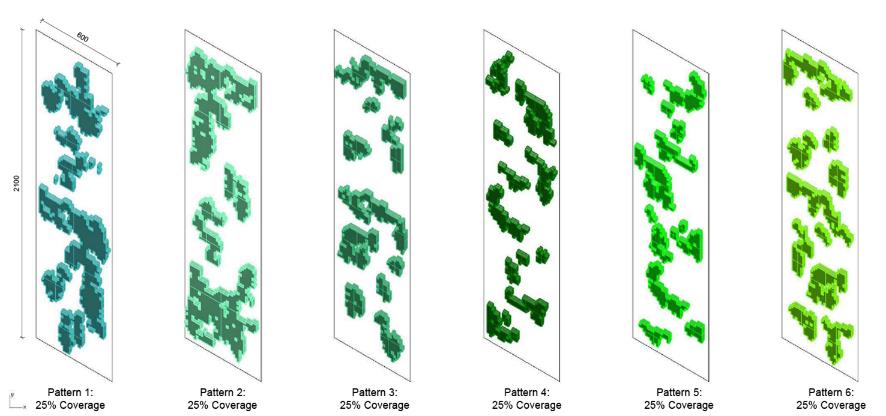 | Figure 6. Process of Modeling VGS: Transition to 3D-Model (Source: Author, August 2016) |
 | Figure 7. Process of Modeling VGS: Creating Plant Depth in 3D-Model (Source: Author, August 2016) |
3.5. Oasia Downtown: Simplified 3D-Model
The production of the three-dimensional model of Oasia Downtown was based on references from WOHA’s plans, sections and elevation drawings. However, the original design of Oasia Downtown consists or curved edges and a circular roof, both of which are not applicable for specific simulation software like Grasshopper – Ladybug + Honeybee. Therefore, the result was to simplify the base 3D-model of Oasia Downtown into simple rectilinear geometric forms, similar to how the plant patterns had to be reconfigured into simplified patterns. (Figure 8) One important factor to note between the difference of an architectural model and a simulation model is that it is necessary to translate and simplify architectural elements into surface boundaries.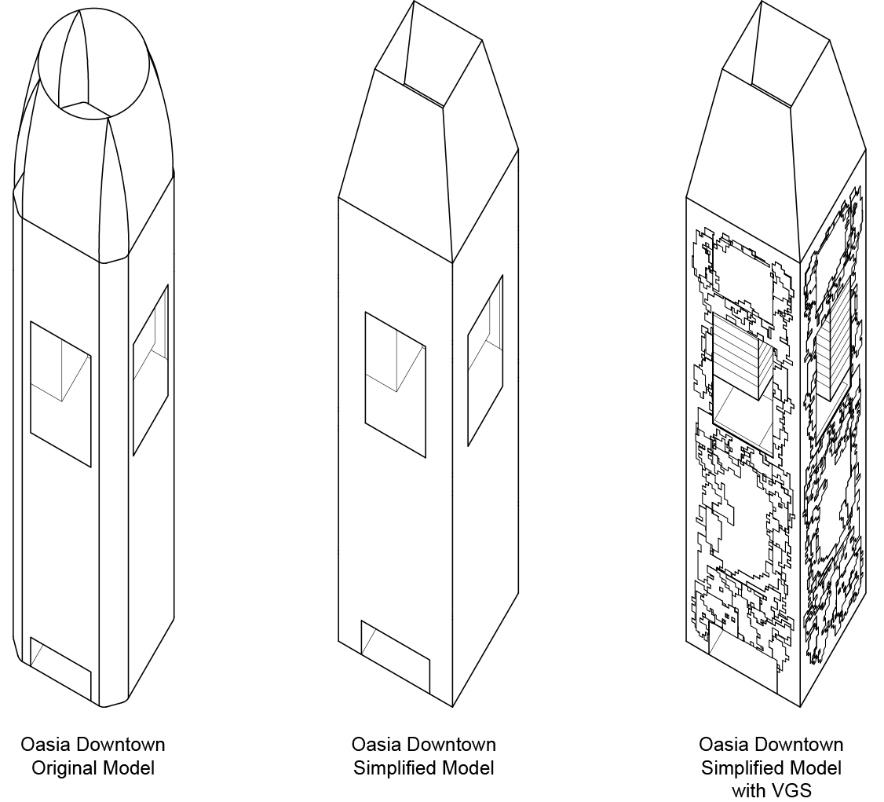 | Figure 8. Base 3D-Model Process (Source: Author, August 2016) |
4. Simulation
Upon establishing the base model of Oasia Downtown, the next development was to incorporate the VGS plant patterns into the model. The most accurate method was to replicate each panel size of 2100mm by 600mm into the entire façade. However, the result would be the repeated patterns of over a thousand number of pixelated VGS plant panels to fill up the entire façade. This would no doubt overload the file and extend the amount of time required for simulation. Instead, the decision was to scale up the pixelated plant panel to be the same proportions of the building as seen in Figure 8. Although this questions the integrity of accuracy, the scaled up model would only be limited to simulation studies for façade surface temperature. Daylight and thermal comfort simulation however, would use the exact panel size of 2100mm by 600mm to determine accurate results for interior spaces.
4.1. Façade Temperature Simulation
Utilising a scaled-up version of pixelated plant patterns for façade temperature simulations, the focus of the study is then to understand the survivability of VGS plants in relation to the surface temperatures of building facades. The type of simulation program utilised was Grasshopper- Ladybug + Honeybee.
4.2. Simulation Parameters for Grasshopper -Honeybee
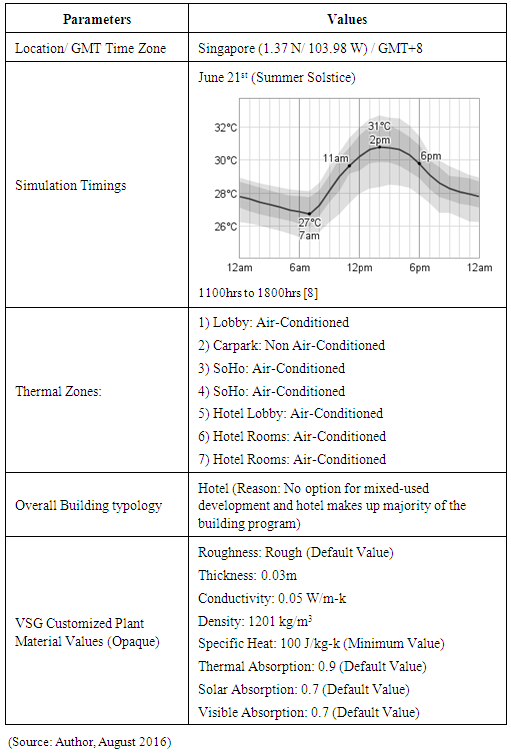
Prior to the start of simulation, there was the need to set a series of specific parameters and information for the software program. (Table 3) Parameters to note include simulation timings. The date and time set was June 21st between 1100hrs to 1800hrs, which is determined to be the Summer Solstice and hottest day in Singapore. The timings were determined as the warmest hours of the day, with the hottest at 2pm. Based on the plant patterns generated seen in Figure 8, the initial plan was to conduct a total of seven simulation tests. Each simulation would reflect the influence of various stages of plant growth, greenery coverage and LAI with relation to façade surface temperatures.Table 3. Parameters Set for Façade Temperature Simulation
 |
| |
|
4.3. Simulation Results for Grasshopper – Honeybee
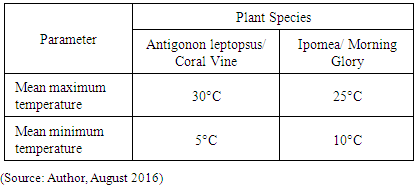
The results obtained from the simulations would be used to measure the likelihood of the VGS failure due to dehydration of plants. A comparison against an existing plant database set up by the Invasive Species Compendium [9] (ISC) would be established. The ISC database is an online encyclopaedic resource that draws together scientific information on all aspects of invasive species. According to the ISC, the mean maximum temperatures for the selected plants species is at 30°C and 25°C respectively (Table 4). However, it is important to note that the surface temperature may not be as accurate due to surrounding buildings not included in the simulations.Table 4. VGS Plant Species Air Temperature
 |
| |
|
4.3.1. Simulation A: Blank Wall
The first simulation conducted was to evaluate the surface temperature of Oasia Downtown without any VGS. Using the simplified model of Oasia Downtown as the base, the simulation was conducted on all four facades. The total run time for the first simulation came up to an estimation of 23.92 seconds. The results show that the south-west façades having the highest surface temperature compared to the other facades (Figure 9). All four facades have an estimated mean temperature of 36°C. Comparing this with the ISC database, the likelihood of the VGS failing due to dehydration of plants is highly possible.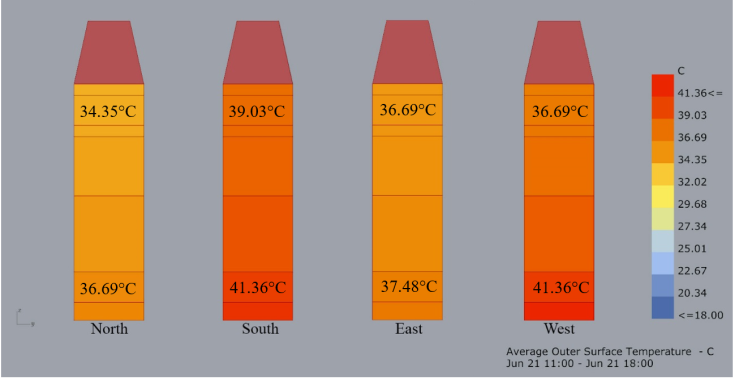 | Figure 9. Simulation A: Blank Façade |
4.3.2. Simulation B: LAI 0.0 to 1.0 with 25% Coverage
The total run time for the second simulation came up to an estimation of three hours. As compared to the first simulation without any VGS, the façade temperatures are slightly lower by one degree (Figure 10).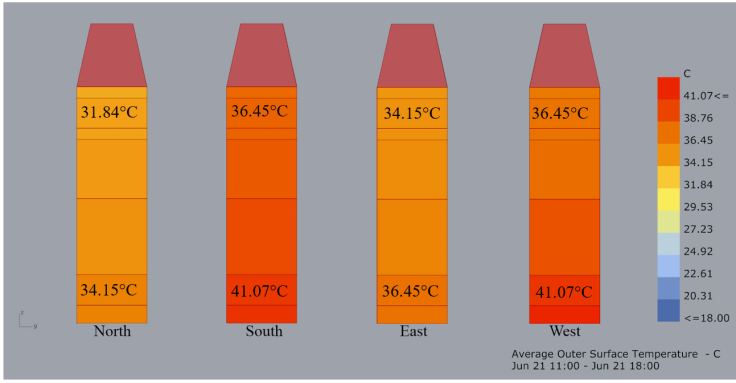 | Figure 10. Simulation B: LAI 0.0 – 1.0/ 25% Coverage |
4.3.3. Simulation C: LAI 1.0 to 2.0 with 25% to 40% Coverage
The total run time for the third simulation came up to an estimation of 9 hours 13 minutes. As compared to the second simulation, the façade temperatures are slightly lower by one degree. (Figure 11)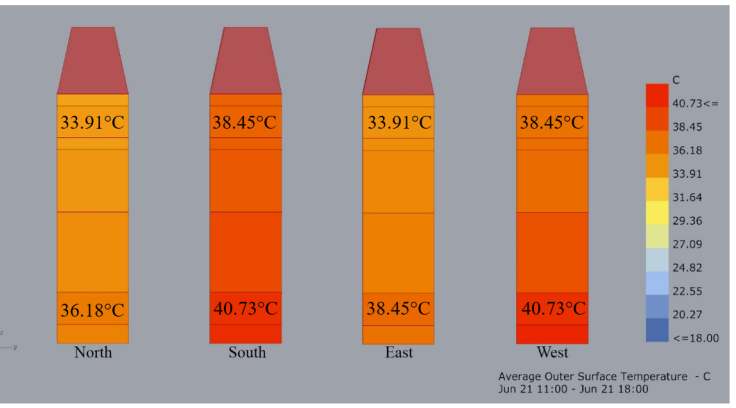 | Figure 11. Simulation C: LAI 1.0 – 2.0/ 25 - 40% Coverage |
4.3.4. Simulation D: LAI 2.0 to 3.0 with 40% to 55% Coverage
The total run time for the third simulation came up to an estimation of 19 hours 19 minutes. As compared to the third simulation, the façade temperatures are slightly lower by one degree (Figure 12). 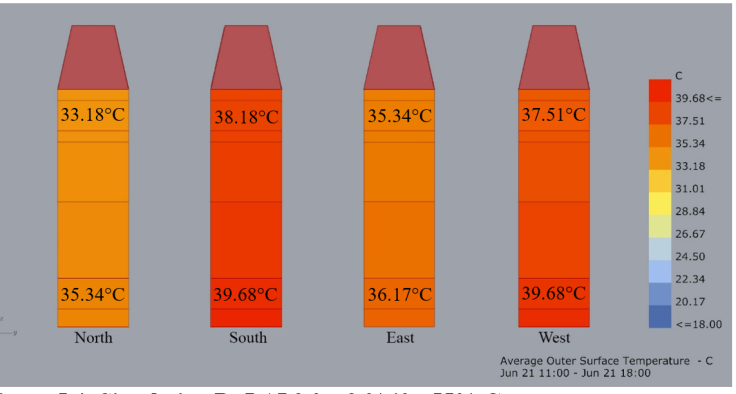 | Figure 12. Simulation D: LAI 2.0 – 3.0/ 40 - 55% Coverage |
4.3.5. Façade Temperature Simulation Comparison
The simulation results were relatively constant. Each additional layer of greenery resulted in a drop of roughly one degree in façade surface temperature. However, the façade simulation tests were only conducted until the fourth test. With four layers of greenery, the simulation took up a total time of 19 hours to complete, which exceeded the allocated time of 9 hours per given simulation. The long simulation times for Grasshopper-Honeybee simulations could be due to the software running each simulation program as a whole. Grasshopper-Honeybee generates its data as a single file; this however requires a lot of time to read the simulation results. The Microsoft excel. files generated from the façade temperature simulations can go up to a size of two gigabytes.
4.5. Simulation Parameters for DIVA
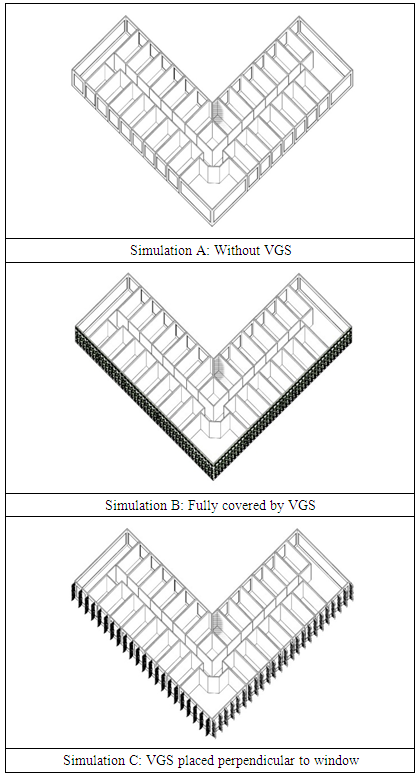
Three different scenarios were simulated to explore the possibilities mentioned above. The base parameters for the simulation would only cover the 17th floor level, which only consists of hotel rooms and zero offices. The reason for choosing the 17th level is due to it being the average floor level of the overall building height (Fig.13).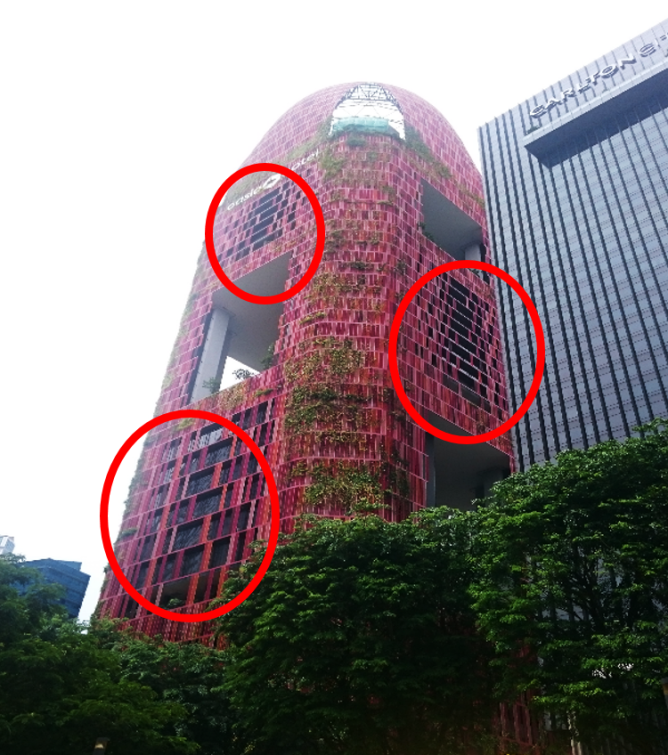 | Figure 13. Clear Openings within the Façades of Oasia Downtown (Source: Author, August 2016) |
Points to note for the simulation settings include the material settings for the DIVA simulation being slightly different to that of the previous Grasshopper-Honeybee simulations for facade temperatures. While the previous simulation’s material settings for the VGS had material properties that are similar to paper; the materials used for DIVA’s VGS was ‘generic translucent panels’ with a 20% value for visible light transmittance. This was the closest material available in the existing DIVA database that shared similar properties to that of a leaf.Occupancy schedule was set to ‘always occupied’ due to the conditions of a typical hotel typology. The grid size used for the daylight autonomy simulations is at a distance of 0.5m by 0.5m. The target illuminance retains the default values of 300 Lux, which is the typical value for an office setting.The first simulation would be of the current configuration adopted by Oasia Downtown, whereby the rooms are not obstructed by any VGS. The second simulation would be covering the windows fully with VGS, similar to the entire building façade. The third simulation however, explores an alternative to covering the windows with VGS that are perpendicular to the direction of the window. (Table 5)Table 5. Simulation A, B and C
 |
| |
|
4.6. Simulation Results for DIVA
Three different scenarios were simulated to explore the possibilities mentioned above. The base parameters for the simulation would only cover the 17th floor level, which only consists of hotel rooms and zero offices. The reason for choosing the 17th level is due to it being the average floor level of the overall building height.
4.6.1. Simulation A
The daylight autonomy results for Simulation A reveals that without any VGS shading, the mean daylight autonomy is 22% for active occupant behaviour. However, the individual hotel guest rooms have an average of 50% active occupant behaviour of up to a distance of 3.5m away from the window as compared to the corridors that had a low rating of close to 0%. This means that during the day, the need for artificial lighting for each individual hotel guest rooms is minimal. The corridors however require a high dependence on artificial lightings. (Figure 14) The point-in time glare results for Simulation A reveals a 23% in daylight glare probability. According to research papers on glare, daylight glare probability (DGP) is a set of values used to determine the “percentage of people disturbed” due to the level of vertical eye illuminance. (J. Wienold. and J. Christoffersen 2006 and 2009). The values for DGP threshold range from imperceptible glare (0% - 35%) to intolerable. (>45%)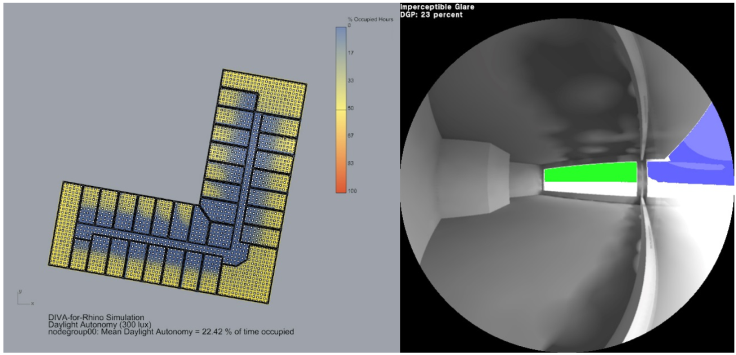 | Figure 14. Simulation A: Daylight Autonomy (Left) Point-in Time Glare (Right) |
4.6.2. Simulation B
Simulation B consist of a fully covered VGS facade reveals a mean daylight autonomy of 14.24% for active occupant behavior. (Figure 15) The south and west interior hotel rooms that are covered by VGS experience a massive drop in distance of 1.5 meters with 50% occupied hours. (Estimated from Grids) However, the DGP value obtained from the point-in time glare simulations was 5%. This was 5 times lower as compared to Simulation A. Although this meant a lower glare value, it also means that there would be a higher reliance on artificial lighting. Furthermore, the views out to the surrounding would definitely be obstructed in this case.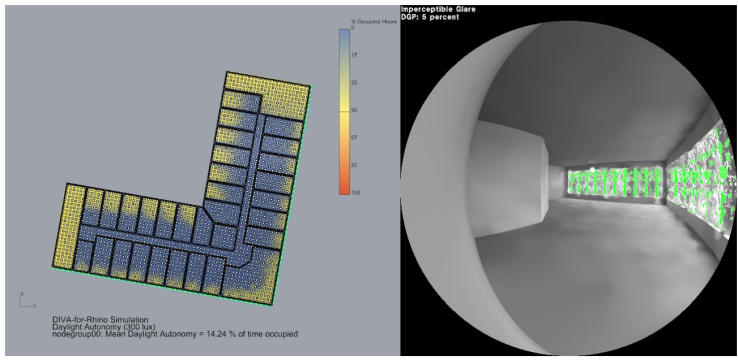 | Figure 15. Simulation B: Daylight Autonomy (Left) Point-in Time Glare (Right) |
4.6.3. Simulation C
Simulation C in this case, proposes a variant design for the VGS. By placing the VGS perpendicular to the window, the hopes of allowing optimal daylight to enter the interiors whilst allowing the VGS to cool the building all without obstructing the views out to the surrounding. According to the results (Figure 16), the mean daylight autonomy was 18.26% for active occupancy behavior. Comparing to Simulation B, the distance of 0% occupied hour was increased to 2.5 meters. Furthermore, the DGP has also increased to 21%, a value closer to Simulation A’s result of 23% as compared to Simulation B’s 5%.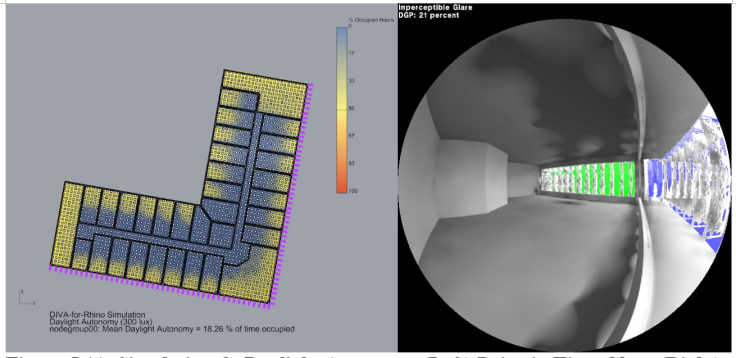 | Figure 16. Simulation C: Daylight Autonomy (Left) Point-in Time Glare (Right) |
4.6.4. Daylight and Point-in Time Glare Simulation Comparison
The various simulation results obtained has shown that VGS has the capabilities to affect daylight autonomy. However, an important point to note is that daylight autonomy is relative to solar radiation. The higher the values of daylight autonomy may result in a lower building cooling load performance. Building cooling loads are the parameter of the thermal indoor condition of the building, because the higher the indoor temperature, the larger energy needed to cool the building to achieve a certain thermal comfort level. Hence, the purpose of introducing VGS as a shading device is an attempt to reduce the amount of solar radiation and cooling the building temperature. In contrast, the denser the VGS panels would result in lesser daylight level coming into the interior spaces. This is evident in the comparison between Simulation A and B. While the lux level for Simulation A can be controlled through the means of curtains, it is however unable to resolve poor building cooling load and thermal comfort. From that logic, Simulation C design suggests an effective and efficient sun-shading device that strikes a balance between the reduction of cooling loads as the parameter of indoor thermal condition and the lux level of indoor spaces. This pushes the design prospects of VGS by providing alternative design strategies in conjunction to improving building performance. The idea of Simulation C design may be pushed to the next level by establishing VGS as a curtain system that can be controlled either manually or according to the sun-path axis.
5. Conclusions and Future Research
5.1. Energy Audit Report
The whole agenda to conclude the simulation portion was to obtain details on Oasia Downtown’s Annual Mandatory Building Information and Energy Consumption data. The Periodic Energy Audit of Operating System Efficiency (OSE) would be then used as a basis for comparing results obtained from the simulation test runs. BCA had made it mandatory for building owners to submit the Periodic Energy Audits as of 01 December 2012 under the Building Control Act [10]. However, Oasia Downtown being a relatively new constructed development may have yet to submit their Energy Report Audit as of the year 2016. Furthermore, the government authorities’ decision to not release audit reports out to the public is also an issue. Henceforth, obtaining the information was unsuccessful. Attempts to liaise with the relevant fields involved in Oasia Downtown project, WOHA architects and Sitetectonix Pte Ltd (Landscape Consultants) was another problem due to their busy work schedules. Thus, there was no way in which compare the above simulation results with any background data. Future research studies should therefore obtain relevant Energy Audit Report or data beforehand to compare and justify the level of accuracy for simulation tests results.
5.2. Software Development
It is now a crucial period as architecture companies make the transition from traditional 2D-CAD drafting to 3D-BIM Modelling. The necessary skills and knowledge required to operate the software is the first step to achieving a smooth transition. For that to happen, educational institutes, software developers and even individuals have to start embracing such changes despite the steep learning curve. One major drawback on the simulation software selected is that majority of it are considered ‘BIM process’ and not actual BIM tools itself. Therefore, for companies making the change to actual BIM software tools, this may prove to be a challenge due to the issues of purchasing additional software license resulting in costs. However, the most important issue currently is the interoperability amongst the various software. Design changes are a common occurrence within the industries. Hence, there is a need for future developers to allow for changes made within a single file to be updated throughout the other software programs automatically.
5.3. Database of Information for BIM
Having an extensive database readily available to the architect would solve many problems during the whole transition. While more input is required from each expert in their relevant fields within the BIM model, the drawback is that lack of information from any fields would affect the overall model. Some of the key issues addressed by the research paper includes expanding the plants and material database, both of which can be easily addressed with the help of government authorities and software developers. Enforcing manufacturers to provide building materials information to comply with sustainable practices is one example. Creating a library for professionals to share material properties is also another example to expanding the extensive pool of knowledge required for BIM.
5.4. Tropical Architecture as a Whole
Incorporating VGS together with BIM is but a small portion in contrast to the whole picture of sustainability in tropical architecture. However, it is still a necessary step if one hopes to integrate the natural and passive elements of tropical architecture together with the constantly and ever progressing tide of technology and design software. The major drawback for the research were that simulations were unable to provide 100% accurate results due to the need of simplifying the base model and reducing simulation time. However, this problem can easily be addressed in the future with greater improvements of technology and software.
ACKNOWLEDGEMENTS
This work was supported by the Dept. of Architecture at the National University of Singapore (#R295000109133).
References
| [1] | Ahmad, A.M. and Aliyu, A.A., 2012. The Need for Landscape Information Modelling (LIM) in Landscape Architecture. In 13th Digital Landscape Architecture Conference, Germany. |
| [2] | Krygiel, E. and Nies, B. 2008. Green BIM: Successful Sustainable Design with Building Information Modeling. Indianapolis: Willis Publishing. |
| [3] | http://www.worldometers.info/world-population/singapore-population/ |
| [4] | Wong, N.H., Tan, A.Y.K., Chen, Y., Sekar, K., Tan, P.Y., Chan, D., Chiang, K. and Wong, N.C., 2010. Thermal evaluation of vertical greenery systems for building walls. Building and environment, 45(3), pp.663-672. |
| [5] | Maas, Jolanda, et al. "Morbidity is related to a green living environment." Journal of epidemiology and community health 63.12 (2009): 967-973. |
| [6] | Ulrich, R.S., 2002, April. Health benefits of gardens in hospitals. In Paper for conference, Plants for People International Exhibition Floriade. Vol. 17, No. 5, p. 2010. |
| [7] | Stav, Y. and Lawson, G.M., 2012. Vertical vegetation design decisions and their impact on energy consumption in subtropical cities. The Sustainable City VII: Urban Regeneration and Sustainability, 155, pp.489-500. |
| [8] | https://weatherspark.com/averages/34047/6/21/Singapore |
| [9] | www.cabi.org/publishing-products/compendia/invasive-species-compendium/ |
| [10] | BCA Energy Audit Report: https://www.bca.gov.sg/EnvSusLegislation/Existing_Building_Legislation.html. |

 Abstract
 Reference
 Full-Text PDF
 Full-text HTML