-
Paper Information
- Previous Paper
- Paper Submission
-
Journal Information
- About This Journal
- Editorial Board
- Current Issue
- Archive
- Author Guidelines
- Contact Us
Architecture Research
p-ISSN: 2168-507X e-ISSN: 2168-5088
2016; 6(4): 88-97
doi:10.5923/j.arch.20160604.02

Evaluation of the Space Syntax Analysis in Post-Strengthening Hospital Buildings
 Abstract
 Reference
 Full-Text PDF
 Full-text HTML
H. Derya Arslan, Burak Köken
Architecture Department of Eng. and Architecture Faculty, Necmettin Erbakan University, Konya, Turkey
Correspondence to: H. Derya Arslan, Architecture Department of Eng. and Architecture Faculty, Necmettin Erbakan University, Konya, Turkey.
| Email: |  |
Copyright © 2016 Scientific & Academic Publishing. All Rights Reserved.
This work is licensed under the Creative Commons Attribution International License (CC BY).
http://creativecommons.org/licenses/by/4.0/

By solving spaces through the space syntax method utilized in building and settlement scale, it is aimed to gain data that would help in understanding and interpreting the complex structure of space. Though in literature there are several studies made for the spatial analysis of buildings with different functions, such as the museums, shopping malls, hospitals, education buildings, and so forth, there is no spatial analysis made for the strengthened buildings. This paper intends to make use of the space syntax method that is utilized as an urban and architectural assessment tool in order to find out the extent the hospital buildings carrier system strenthening project affect the architectural parameters in terms of space. As the first step of this research, 130 buildings in Turkey, which were subjected to seismic performance analysis in the last ten years, were studied. A limited number of these hospital buildings were observed to be worth strengthening. In five of these buildings that were decided to be strengthened, the architectural projects of the pre- and post-strengthening stages were analyzed using the space syntax method. In this step, visibility graph analysis (VGA) conducted on these sample five different hospital buildings. For visibility analysis, Depthmap software program has been used. In the meantime, permeability graph analysis has been conducted and compared with VGA results. At the end of the analyses; the changes to be observed in the ground floor plan of the buildings with the strengthening were assessed in terms of the connectivity value, integration value and the mean depth. The Connectivity value was observed to decrease, and the mean depth value was observed to increase in all the buildings studied. The integration value was observed to vary among the buildings. It was concluded at the end of the study that; in order to minimize the space related problems that would come out after the strengthening process, the space relations analysis had to be performed according to the alternative strengthening projects of the complex functional buildings such as the hospital buildings.
Keywords: Space Syntax, Visibility, Architecture, Strengthening and Rehabilitation, Hospital, Performance
Cite this paper: H. Derya Arslan, Burak Köken, Evaluation of the Space Syntax Analysis in Post-Strengthening Hospital Buildings, Architecture Research, Vol. 6 No. 4, 2016, pp. 88-97. doi: 10.5923/j.arch.20160604.02.
Article Outline
1. Introduction
- The earthquakes that have happened in Turkey in the last century have caused significant damage and destruction, particularly in public buildings [1-7]. Comprehensive seismic performance analyses were made for the current public buildings in order to minimize the losses that might occur in the next massive or moderate grade earthquakes. These seismic performance analyses are made in accordance with the conditions of Turkish Earthquake Code (TEC-2007, 2007) [8], and seismic performance knowledge is gained depending on the levels of performance. The analyses show the potential levels of damage for the buildings, and performance level of each building is gained based on these data. This performance level helps in deciding whether to use the building in its current condition or to strengthen or destruct it. When a building is decided to be strengthened, some changes might be necessary for the architectural functions of the building regarding space (such as adding-removing walls, adding shear walls, changing the places of doors and windows, setting up new locations, etc.). These changes might affect the space syntax. Thus; spatial analysis of the building must necessarily be made when adding seismic strengthening components into a building that has insufficient seismic performance.In Turkey, comprehensive seismic performance analyses have been made for hospital buildings, which make up a significant risky part of the public buildings of the country. Whereas a majority of the buildings that have gone through these performance analyses are decided to be destructed, some of them are decided to remain in force following strengthening. Seismic strengthening of hospital buildings brings about some changes in the utilization of the spaces, depending on the kind of the preferred strengthening. These strengthening studies cause modifications in space syntax, which might particularly affect the function of the building in terms of its ground floor plan.Post-strengthening space syntax analysis made for the complex functional buildings such as the hospital buildings can be based on statistical data by obtaining information from the users. The analysis made during the usage period mainly includes the systematic analysis that intends to find out to what extent the buildings in use meet the needs of the users and the corporate purposes. This analysis is an activity which is performed to improve the quality of design and which is based on feedback. It is not possible to use this feedback method in strengthened buildings. Thus; it is necessary to analyze and assess the space relations of the building after the preparation of the carrier system strengthening project and prior to the application of this project. This will minimize the problems that might come up with the strengthening of the building.In literature, there are several studies made for the spatial analysis of buildings with different functions, such as the museums, shopping malls, hospitals, education building, etc. [9-12]. The idea of comparing pre- and post-altered plans using these methods conducted some researchers such as Eloy and Duarte [13]. They used the syntactical methods in pre and post-altered plans of a building in Lisbon. They used shape grammar and space syntax as part of the rehabilitation methodology as tools to identify and encode the principles and rules behind the adaptation of existing houses to new requirements. On the other hand; there is no spatial analysis made for the strengthened buildings in the literature.This paper intends to make use of the space syntax method that is utilized as an urban and architectural assessment tool in order to find out to what extent the hospital buildings carrier system strengthening project affect the architectural parameters regarding space. As the first step of the study, 130 buildings in Turkey, which were subjected to seismic performance analysis in the last ten years, were reviewed. A limited number of these hospital buildings were observed to be worth strengthening. In five of these buildings that were decided to be strengthened, the architectural projects of the pre- and post-strengthening stages were analysed using the space syntax method in order to assess the changes the strengthening process would bring about in the ground floor plans of the buildings based on architectural parameters. In this step, visibility graph analysis (VGA) conducted on these sample five different hospital buildings by using Depthmap program. In the meantime, permeability graph analysis has been conducted and compare with VGA results. At the end of the analyses; the changes to be observed in the ground floor plan of the buildings with the strengthening were assessed in terms of the connectivity value, integration value and the mean depth.
2. Hospital Buildings Seismic Performance Assessment Criteria
- Seismic performance can be defined as ‘the building safety state that is determined based on the level and distribution of the potential damages of a building under a certain seismic effect.” In order to determine the seismic performance of current buildings, it is necessary to have sufficient knowledge about the state of the building’s carrier system. Whereas a majority of the hospital buildings in Turkey that have gone through these performance analyses are decided to be destructed, some of them are decided to remain in force following strengthening. Thanks to the developing systems and technologies, several methods can be utilized in strengthened buildings. Reinforced concrete structures are mainly strengthened through jacketing the columns, beams or partitions with concrete or steel plates; concrete jacketing the columns, beams or partitions with fibre polymer; adding reinforced shear wall to the carrier system or through retrofitted the base of the carrier system. It is significant in strengthening studies that; each building to be strengthened is analysed based on its specific properties and the best strengthening method is determined for the building. Particularly after the Marmara earthquake that took place in 1999, comprehensive studies and analyses have been made in Turkey for the last ten years as the public buildings, particularly the hospital buildings have been greatly affected by the destructions. 130 buildings which were subjected to seismic performance analysis were studied within the scope of this research. Preliminary strengthening projects were prepared for 47 buildings which had insufficient seismic performance, yet, which had strengthened potential theoretically. Whereas the “Shear Wall Adding + Jacketing” strengthening method was preferred in 21 of these 47 buildings, “Shear Wall Adding” was used in 10 of them. It is observed that; the reinforced concrete shear wall adding was mostly preferred in the strengthening process of the buildings. In all of the buildings, it was necessary to strength the infrastructure (the base).The most significant criterion in deciding whether to apply the prepared strengthening project or not is that; the cost shall not exceed 40% of the construction cost. As the strengthening costs exceeded 40% of the reconstruction costs in 80% of these 47 buildings, they were deemed to be inappropriate for strengthening. The final reinforced concrete strengthening projects and the relevant architectural projects were prepared for the remaining buildings.
3. Spatial Analysis and Its Components
- The space syntax method was used in order to analyse the pre- and post-strengthening projects of the strengthened buildings studied in here and to analyse buildings in terms of space. The space syntax analysis method is assumed to be a “space interpretation” method. In early 1970, it was theoretically launched by Bill Hillier and his team in the areas of architecture and urbanism in order to reveal out the impressions of the “spatial look” and their social interactions for the structures and structured contexts [14-15]. In their theory, space is represented by its parts, which form a network of related components.Studies that intend to resolve a space aim to understand and interpret the complex structure of space. Spatial organizations shape the behaviors of the persons inhabiting those and govern the interpersonal relationships. The space syntax method is utilized both for the building and the settlement scales in order to define the inter-spatial relationships and to analyze the spatial characteristics. The focus at both scales is the investigation of the principles related to the organization and functional relationships observed in similar systems formed by houses, streets, squares or rooms, halls, yards, etc.Several parameters such as the Beta index, Connectivity value, Integration value, Average depth value can be utilized in the spatial analysis. At the beginning of this analysis, the mathematical “graph method” that includes dots and lines is utilized in order to define the spaces and space groups which have solid functional relationships and in order to minimize the traffic between the spaces and the buildings. Whereas the dot represents a space, the lines show the inter-spatial relationships. The nodes can be assumed to be the network formed. The aim here is to resolve the mathematical model (network) formed and to obtain several statistical data such as the beta index, connectivity value, integration value and the average depth value. First of all, all the spaces are marked on the organized transition graph, i.e. the access graph to be placed on the out, zero level. This space is chosen to be the reference point on the organized transition graph to show the spaces in the same depth on the same horizontal cut line. These lines (depth markers) are numbered starting from the reference space that is always placed on the 0 line so that they show the minimum number of door sills one has to pass in order to arrive at any target. As presented in Fig. 1, the number of a line of depth (0, 1, 2…) is the value of depth belonging to the space placed on that line [16]. The depth is greater in graphs that form a linear structure compared to a branched graph. The “tree type or shallow type access graph” is formed through the order of the integrating components that are linked to a given source space.
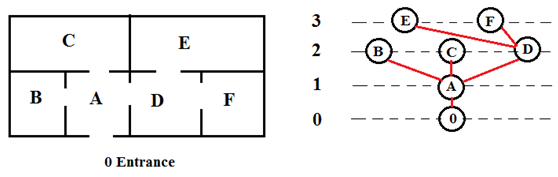 | Figure 1. Typical organized transition graph (Permeability graph analysis-JPG) |
4. Visibility and Permeability
- In architectural composition, a process of visualization of space as being potentially occupied by users and sequences of events is essential, though not necessarily conscious [19-20]. For this reason the user has as creative a role as the architect. According to the Hanson [21]: “In moving around in buildings, people orientate themselves by reference to what they can see and where they can go. In looking at the visual and volumetric qualities of architecture, we need not be constrained by the pragmatics of everyday space use and movement. Indeed, we should not be, since architectural speculation almost invariably brings into play the relationship between visibility [what you can see] and permeability [where you can go].”Visibility graph or visibility graph analysis (VGA) is a tool with which we can begin consciously to explore the visibility and permeability relations in spatial systems. The relation between visibility and permeability is a vital component of how building work spatially and are experienced by their occupants. The visibility graph properties may give clues to interpret manifestations of spatial perception and cognition, such as way finding, movement, and space use within a building or a house. Braaksma and Cook [22] applied the VGA to building environments firstly in an airport example. From a matrix they created a metric to compare the number of existing visibility relationships with the number which could possibly exist, in order to quantify how usefully a plan of an airport satisfies a goal of total mutual visibility of locations. After this attempt, some of researchers used VGA in their studies [23-25]. The permeability analysis is about functional efficiency and control. According to Beck and Turkienicz [26] “Although space syntax studies emphasize the association between visibility and permeability, the relations of visibility between spatial units not always correspond to permeable relations”. In addition to this, Güney [27] shows that visibility structures work together and enhance the permeability structures to interface and distance different kind of relationships. Same results have been obtained by Lazaridou [28] for museum buildings.
5. Sample Hospital Buildings
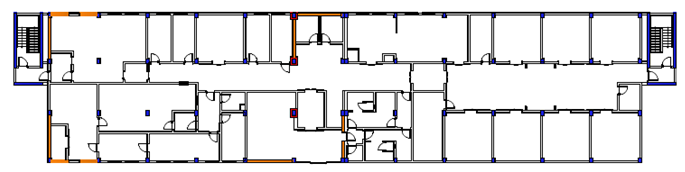
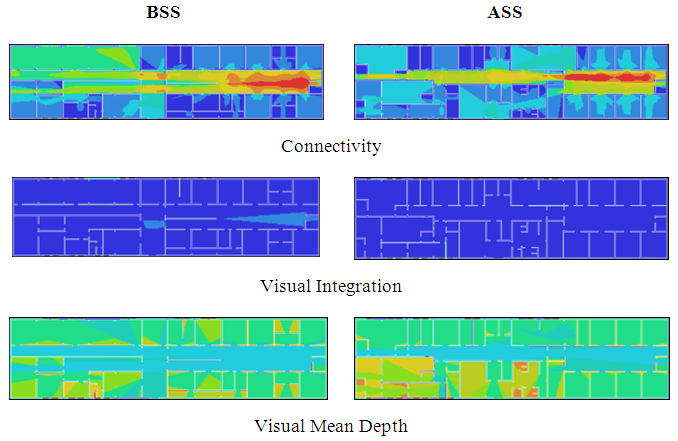
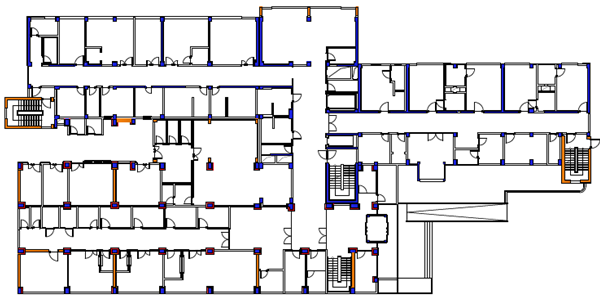
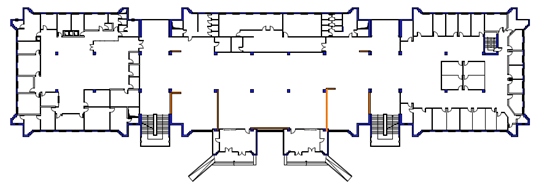
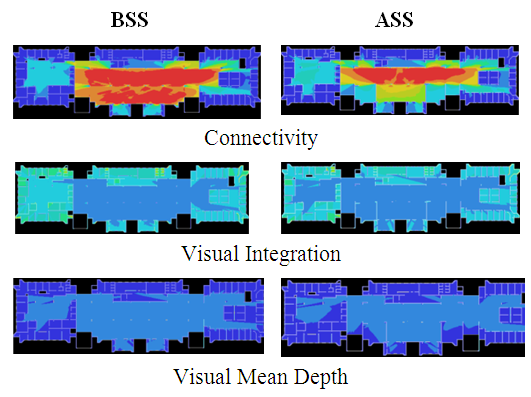
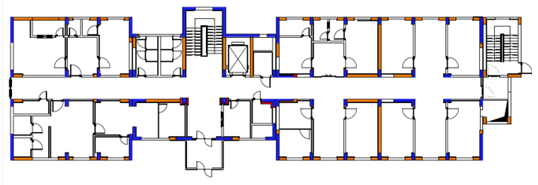
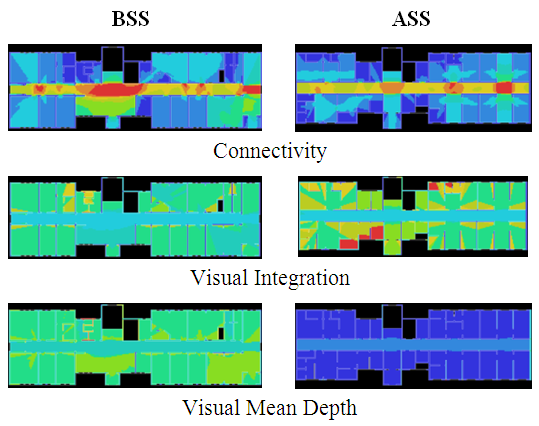
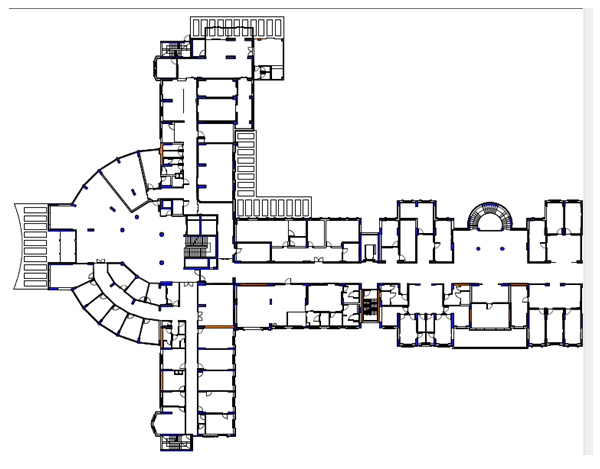
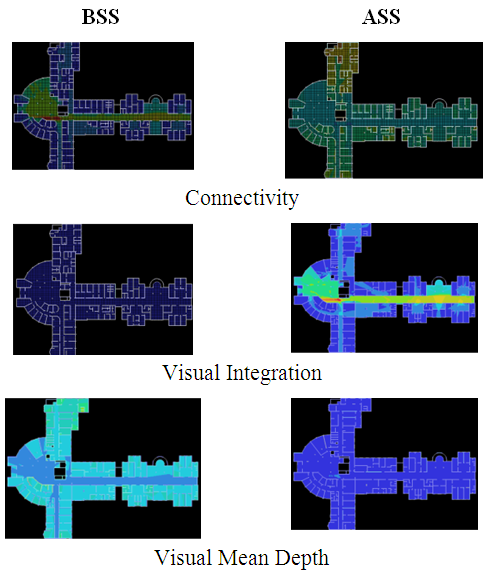
- Within the scope of the study, 47 of the 130 buildings that had been subjected to seismic performance analysis in Turkey in the last ten years were found to be worth strengthening. As the strengthening costs estimated in the preliminary strengthening projects exceeded 40% of the re-construction costs in the majority of these buildings, they were deemed to be inappropriate for strengthened. The carrier system final strengthened projects and the post-strengthening stage architectural projects were prepared for the remaining buildings. In this part of the study, the projects of the five buildings that were deemed to be worth strengthening (Type-1, Type-2, Type-3, Type-4, Type-5) were analyzed according to the space syntax method with regards to the pre- and post-strengthening stages. As in all of the five buildings, the ratio of strengthening got lower on the upper floors, the strengthening process created more significant changes on the architectural projects of the ground and underground floors. The ground floors of the buildings were studied in this research. Buildings have different plan schemes. Type-1 and Type-4 I, Type-2 Y, Type-3 modular and Type-5 has T plan types. In the strengthening of these buildings, reinforced concrete shear wall addition and reinforced concrete jacketing method used. In Figures 2a-6a, schematic ground plans are given. In the plan original form (before strengthening) is given in blue layer. The strengthening members such as reinforced concrete shear walls and reinforced concrete jacketing are added as red and green layers, respectively. Each building ground floor was modeled firstly. In the analyses and measurement Depthmap program has been utilized for the visibility analysis. The program is developed at University College London by Alasdair Turner [29]. The program is designed to perform VGA of spatial environments. Once the graph has been constructed, the program conducts various analyses of the graph. The analyses and measurements can give information about house’s spatial configuration with reference to accessibility and visibility. In the literature, numbers of computer programs have also been introduced to analyze the visibility structures. Pre- and post-strengthening stages spatial analysis of the sample hospital buildings were given in Figs 2b-6b, respectively. In the figure 2-6, building models and floor plan divided as pre-strengthened (BSS) and post-strengthened (ASS). According to the graphical representation of the color spectrum from red to blue color located in the plane, red dots represent the places where the most integrated areas while blue areas of integration in space at least. VGA analyses results were given conducted on these in terms of the connectivity value, integration value and the mean depth, respectively.
 | Figure 2a. Schematic Ground Plan of Type-1 |
 | Figure 2b. Building Models of the Ground Plan of Type-1 |
 | Figure 3a. Schematic Ground Plan of Type-2 |
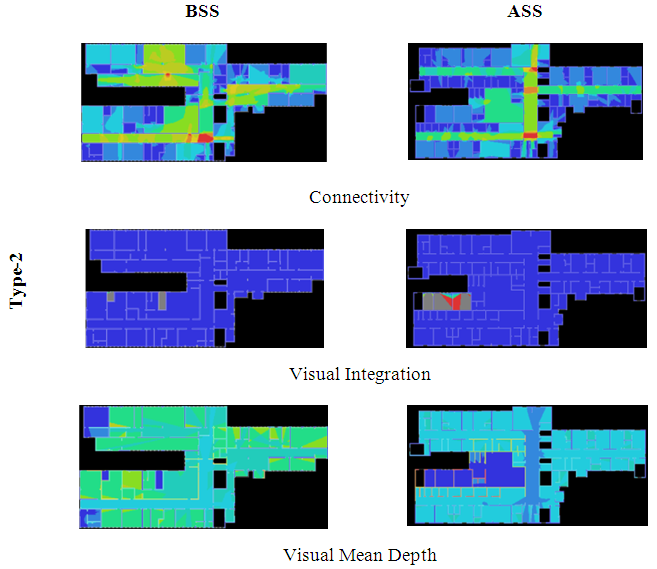 | Figure 3b. Building Models of the Ground Plan of Type-2 |
 | Figure 4a. Schematic Ground Plan of Type-3 |
 | Figure 4b. Building Models of the Ground Plan of Type-3 |
 | Figure 5a. Schematic Ground Plan of Type-4 |
 | Figure 5b. Building Models of the Ground Plan of Type-4 |
 | Figure 6a. Schematic Ground Plan of Type-5 |
 | Figure 6b. Building Models of the Ground Plan of Type-5 |
6. Results and Comparison of the Parameters
6.1. Comparison of Connectivity Values in VGA Analysis
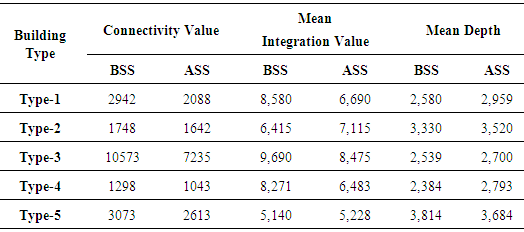
- Considering the pre- and post-strengthening stages regarding the connectivity value; it was observed that, the connectivity value decreased in all buildings after the strengthening (Table 1 and Table 2). In other words; a decrease was observed in the number of neighbour spaces that were related to the other spaces. The reasons for the changes observed in the connectivity value can be summarized as the following:Ÿ In Type-1; as the current two circulation axes that were parallel to each other on a linear line were transformed into a single circulation axis after the strengthening process and as the number of spaces are increased, there emerged some disconnections among the spaces in terms of connectivity.Ÿ In Type-2; as the current two main entrances were transformed into a single entrance and thus, some alternative circulation areas were removed out after the strengthening process, the connectivity value decreased, and there emerged some disconnections among the spaces. Ÿ In Type-3; the currently large waiting and circulation areas at the entrance of the building were divided with partition walls after the strengthening process and decreased the connectivity value.Ÿ In Type-4; as the current two main entrances were transformed into a single entrance after the strengthening process and the size of the entrance hall and waiting areas were reduced, the connectivity value decreased, and there emerged some disconnections among the spaces.Ÿ In Type-5; as new spaces were added and some alternative circulation areas were removed out after the strengthening process, the connectivity value decreased, and there emerged some disconnections in the building.
|
6.2. Comparison of Integration Values in VGA Analysis
- Considering the pre- and post-strengthening states of buildings in terms of the mean integration value; Type-2 and Type-5 were observed to have a higher integration value at the post-strengthening process compared to the pre-strengthening process whereas the opposite issue was true for Type-1, Type-3 and Type-4, which presented a decrease in the integration value (Table 1 and Table 2). The changes observed in the integration value of each building can be summarized as the following:Ÿ The post-strengthening stage integration values of Type-2 and Type-5 were high, which show that; the removal of some current alternative circulation enables the frequent use of the main circulation areas within the system to create mobility.Ÿ The high integration values of Type-1, Type-3 and Type-4, are related to the following reasons. In Type-1; the current two circulation axes that are in parallel to each other, create a connection and mobility as they are frequently used within the system. In Type-3; the current visual perception of the building is easier, and the reinforcement partitions divide the space and decreases the mobility so the visual perception. In Type-4; the current two entrances, the larger entrance hall and the waiting area create a connection and ease the system.
6.3. Comparison of Mean Depth in VGA Analysis
- In VGA analysis, mean depth is used, since the buildings are different sizes. In the analysis, the obtaining mean depths are not really of depth rooms. Considering the pre- and post-strengthening states of buildings in terms of the mean depth value; all the buildings except for Type-5 were observed to have a higher average depth value at the post-strengthening process compared to the pre-strengthening process (Table 1 and Table 2). The most significant reason of this is that:Ÿ In Type-1, Type-2 and Type-4; some new spaces were created inside the spaces as a result of the needs. The depth value was increased, which shows that the number of embedded spaces increased and it became more challenging to perceive the spaces. In Type-3; the reinforced shear wall partitions added to the building created new spaces in the building.Ÿ In Type-5; the average depth value decreased, which shows that the number of spaces decreased and the spaces were perceived easier.
6.4. Comparison of Permeability in Graph Analysis
- Figure 7 represents the relationships of permeability graph analysis between all the convex spaces or axial spaces of the selected building layout. For each type of plan two different graphs are given as BSS and ASS, respectively. The spaces are represented by cycles (called in the literature as dots or nodes) and the links with lines.
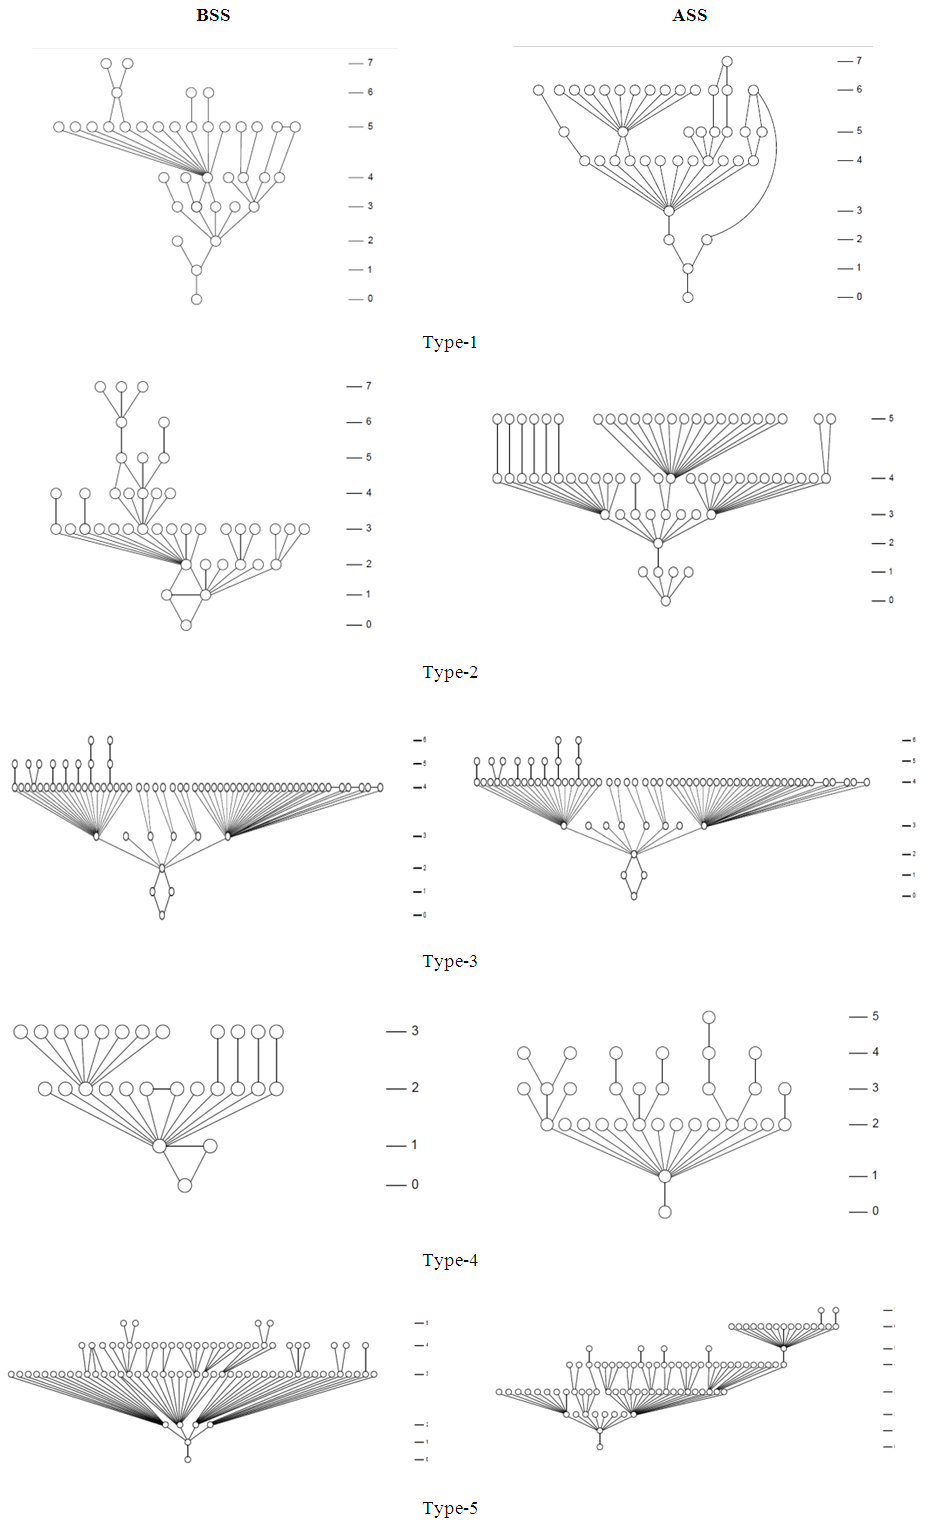 | Figure 7. Graph Analysis of the Buildings |
7. Conclusions and Final Remarks
- Structural strengthening is an issue that is on the agenda in highly seismic countries such as Turkey. The particular structural objective is that the building acquires the expected level of seismic performance of the strengthening. On the other hand; determination of the strengthening methods that would minimally affect the architectural structure of the building is also a significant research subject. In this research, pre- and post-strengthening stages architectural space syntax analyses were compared, which was an issue that had not been dealt with in literature before.It is very significant for the re-use of the strengthened building to perform space syntax analyses before the production of the strengthening project advised for the complex buildings such as the hospitals. The findings of this research can be expressed as the following items:1. In five of the hospital buildings studied in this research, significant functional losses emerge with the strengthened. The main reason of this is observed to be the locations of the shear walls preferred and the reinforced concrete jackets. In order to minimize the potential spatial problems that would emerge after the strengthening, spatial relationships of the hospital buildings shall be analysed according to alternative strengthening projects and the method that would have the least effect on these spatial relationships, shall be preferred. The space syntax method that could give several statistical results such as the relationships of the spaces, their connectivity values and depths might also enable election among the different types of strengthening prior to the realisation of the strengthening.2. Connectivity is the number of direct connects in an element inside the system. When the element approach to the middle point of system the number of chapter increases and it is called integration. Integration is a value examined the how space using in the system. Integration gives some cues about mobility of the spaces. If the integration value is high, this also means mobility of the system is high due to the higher connectivity value between spaces. On the other hand when the element slids to the out of system the deepness increase and the integration decrease. In case of more neighbour spaces (spatial relationship is high) the value of connectivity is high.3. The Connectivity value was observed to decrease, and the mean depth value was observed to increase in all the type of buildings studied. The integration value was observed to vary among the buildings. 4. Connectivity is resolution and scale dependent in Depthmap program. In this paper, the selected buildings are not compared each other with regard to VGA parameters. The main aim of the paper is to compare each parameter BSS and ASS conditions. When considering the connectivity value; after strengthening connectivity value decreases.5. All space units in architectural fiction which evaluated by syntactic are contained connect forms and the space units relationships between the nearest neighbor by integration and connectivity. Spaces in architectural fiction have got different qualitative and quantitative features because of their locations. The high value of deepness shows the difficult access to the space so that there is little movement in space. The high value of deepness in spaces causes decrease in social interaction and the level perception in that space.6. If it is compared the permeability depth with the visibility depth; visibility is much shorter in terms of depth., meaning that people can grasp more easily the structure of the hospital upon entering due to the amount of visual relations that are offered. 7. Prior to the production of the strengthening, the potential spatial effect of the alternative strengthening methods shall be compared and assessed by performing space syntax analyses and the most functional one in terms of spatial relationships and use, shall be preferred. 8. The findings seem to imply that earthquake strengthening affects the ground floor plans of the five hospital buildings be increasing their relative depths and decreasing their connectivity; results which might intuitively suggest that the process of seismic strengthening involves adding especially additional shear walls which complicates or interrupts connectivity across the plans.9. It was concluded at the end of the study that; in order to minimize the space related problems that would come out after the strengthening process, the space relations analysis had to be performed according to the alternative strengthening projects of the complex functional buildings such as the hospital buildings.