-
Paper Information
- Paper Submission
-
Journal Information
- About This Journal
- Editorial Board
- Current Issue
- Archive
- Author Guidelines
- Contact Us
Applied Mathematics
p-ISSN: 2163-1409 e-ISSN: 2163-1425
2022; 12(2): 40-50
doi:10.5923/j.am.20221202.03
Received: Sep. 14, 2022; Accepted: Sep. 30, 2022; Published: Oct. 12, 2022

Mathematical Modelling of Diabetes with Constant Hospitalisation Rate in Kenya
 Abstract
 Reference
 Full-Text PDF
 Full-text HTML
R. N. Andima1, W. N. Mutuku1, A. S. Oke1, N. Farai2, K. Awuor1, B. A. Juma1
1Department of Mathematics and Actuarial Science, Kenyatta University, Kenya
2Department of Mathematics and Applied Mathematics, University of Johannesburg
Correspondence to: A. S. Oke, Department of Mathematics and Actuarial Science, Kenyatta University, Kenya.
| Email: |  |
Copyright © 2022 The Author(s). Published by Scientific & Academic Publishing.
This work is licensed under the Creative Commons Attribution International License (CC BY).
http://creativecommons.org/licenses/by/4.0/

Blindness, stroke, and amputations are some of the consequences of diabetes on humans. The fact that over 500 billion USD is spent on diabetes diagnosis, care, and treatment each year demonstrates its massive impact on the global economy. In Kenya, the incidence rate of diabetes and the number of death from diabetes and diabetes-related infections keep rising. At this rate, healthcare facilities and resources would undoubtedly become overloaded. The impact of a constant hospitalization rate on the trajectory of diabetes is explored in this study. A system of ordinary differential equations is developed to describe the dynamics of diabetes with a constant hospitalization rate. The model is shown to be well-posed, positive, and bounded, and the requirements for the local stability of the equilibrium points are established. The next generation matrix is used to calculate the reproduction number. The model is numerically solved using the explicit Runge-Kutta 4th order and the results are graphed. Improvement in lifestyle quality among the susceptible class reduces the migration from the susceptible subpopulation to the diabetic population.
Keywords: Diabetes, Hospitalisation, Mathematical modelling, Per capita hospitalisation rate
Cite this paper: R. N. Andima, W. N. Mutuku, A. S. Oke, N. Farai, K. Awuor, B. A. Juma, Mathematical Modelling of Diabetes with Constant Hospitalisation Rate in Kenya, Applied Mathematics, Vol. 12 No. 2, 2022, pp. 40-50. doi: 10.5923/j.am.20221202.03.
Article Outline
1. Background Information
- Chronic diseases develop over time as a result of a mix of genetic, environmental, and behavioural factors. Noncommunicable diseases are classified into four categories: diabetes, cancer, chronic respiratory ailments, and cardiovascular problems. Each year, more than 41 million people die from NCDs, with low- and middle-income countries accounting for 85% of these fatalities [13]. Food taken into the human body is converted into glucose which is transported into the bloodstream. A signal is received by the pancreas to secret insulin when there is an increase in the bloodstream glucose level. The insulin converts the glucose into usable energy for the other cells to use. Diabetes is a disease that results when the insulin-glucose-glycogen control mechanism fails. In this condition, the pancreas produces either too little insulin, which is insufficient to convert the body's sugar, or too much unhelpful insulin [7,9]. Diabetes is the leading cause of kidney illness, cardiovascular disease, blindness, and lower limb amputation [22,1]. Diabetes presently affects 422 million people globally, up from 180 million in 1980. In 2014, low-income countries had a prevalence of 7.4%, which was higher than the prevalence of 7.0% in high-income countries. Diabetes prevalence has risen faster in low- and middle-income countries, and it is now highest in upper middle-income countries [10]. Like other developing nations, Kenya is dealing with the growing diabetes epidemic. Diabetes prevalence in the nation is thought to be around 3.3%. Unless this trend is reversed, this number is predicted to increase to 4.5 percent by 2025. In 2015, Kenya reported over 8,700 diabetes-related fatalities. According to the 2015-2020 survey by the National Strategy for the Prevention and Control of NCDs, diabetes is one of the four most common chronic illnesses in Kenya, along with a strategy for health system reform, risk factor reduction, and promotion of good health. The National Hospital Insurance Fund (NHIF) has also lately created a specific chronic sickness care package. Despite these national efforts, sub-county and county-level diabetes care infrastructures remain unreliable, and there is a scarcity of diabetes data [8,24]. Although the prevalence of diabetes in Kenya is under-reported, it is estimated that up to 60% of diabetics in the country go untreated [16]. Despite the devolution in the Kenyan system of government in 2010 where counties are given the exclusive rights to oversee their health system, only very miniature progress has been made in the country towards universal health coverage (UHC) [15]. According to Otieno et al. [21], 68 percent of Kenyans' basic health needs are not being met.According to Ajmera et al. [2], analysis of the dynamics of diabetes using mathematical models has shown to be quite effective. Several mathematical models have been presented by researchers to investigate glucose-insulin behaviour in diabetes, diabetes prevention and management, the cost and cost-effectiveness of diabetes treatment alternatives, and diabetes epidemiology. Boutayeb and Derouich [6] modelled the use of physical activities to increase insulin sensitivity and consequently regulate blood glucose levels. The importance and impact of physical activity in diabetes patients were demonstrated. Physical activity has been shown to enhance insulin sensitivity and compensate for insulin deficiencies in patients. Boutayeb et al. [7] considered the case of complicated and non-complicated diabetes in diabetic patients and proposed a mathematical model to study the dynamics of diabetes. Li et al. [12] modified the mathematical model for the dynamics of diabetes by introducing the law of conservation in time-delay equations. The findings, however, are in agreement with the physiological observations but with more insightful information. Zhang et al. [26] considered the effects of saturated treatment on the trend of the diabetic population and the results show that treatment rate can control the diabetic population. Karachaliou et al. [9] offered a diabetes prevention model and highlighted that good diabetes prevention and diabetic patient care can help lower the burden of such illnesses in low-income countries. The rates of admission of diabetic patients into Ethiopian hospitals were mathematically modelled by Regassa and Tola [23] and using the parametric survival analysis, the admission rate for Ethiopia was estimated as 9.85 per 1000 persons per year. [4] proposed a mathematical model for the dynamics of diabetes and solved model using the homotopy analysis method. Ali et al. [3] proposed a model for measuring the glucose concentration in the bloodstream. The Bayesian framework with Markov chain Monte Carlo was used to study diabetes in Kigali, Rwanda.Nasir and Daud [14] compiled several differential equations on the dynamics of diabetes. Complications were considered as non-existent, constant, rate-dependent, and with control. A qualitative analysis of the models were carried out and areas for further research were suggested in the concluding remark. One suggested area for further study is to consider how available resources may limit the total number of treated diabetics with complications. With this motivation, this study is aimed at unravelling the effects of constant resource allocations on the diabetic population.In this study, a mathematical model for managing diabetes and associated consequences in a context with constant resources is formulated and analysed. The questions answered in this study include;i. What is the impact of increasing recovery rates among the hospitalised individuals on the trends in diabetes? ii. What is the impact effect of increasing healthy lifestyle on the susceptible and diabetic populations?iii. What is the impact effect of increasing unhealthy lifestyle on the susceptible and diabetic populations?iv. What is the impact of a constant per capita hospitalisation rate on the entire population?
2. Methodology
2.1. Formulation of the Mathematical Model
- The flowchart for the mathematical model that considers the significance of intervention and the limited healthcare resources on the dynamics of diabetes is shown in Figure (1). The entire population is divided into four compartments;
 is the first compartment called Susceptible compartment,
  is the Diabetic compartment,
  is the Complicated compartment, and
  is the Hospital compartment. The susceptible compartment includes non-diabetic individuals who are at risk of becoming diabetic, the diabetic compartment includes individuals who are already diabetic, the complicated compartment includes diabetic individuals who have developed complications as a result of their diabetes, and the hospital compartment includes complicated cases that have been hospitalized. In this study, it is assumed that healthy people can only have healthy children, diabetic adults can have either diabetic or healthy children, and complicated cases can be treated to cure the complications but not the diabetes.
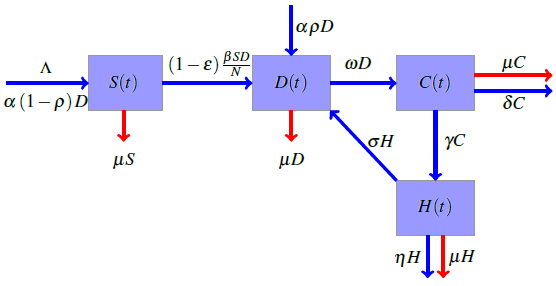 | Figure 1. Flowchart for the model |
 is the birth rate,
  is the proportion of diabetic births,
  is the rate of developing complications due to diabetes,
  is the proportion of death from complication,
  is the per capita hospitalization rate,
  is the recovery rate from complications,
  is mortality rate among the hospitalised individuals,
  is taken as the natural mortality rate, and
  is the lifestyle incidence rate (
 represents the case of no impacted lifestyle and
  is the highest lifestyle standards).
  represents the proportion of interactions leading to incidence, and hence, the total incidence due to lifestyle is
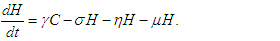
  The equations governing the dynamics shown in figure (1) is
 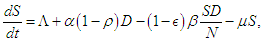 | (2.1) |
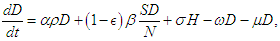 | (2.2) |
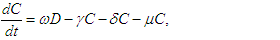 | (2.3) |
 | (2.4) |
2.2. Qualitative Analysis
2.2.1. Reproduction Number
- Following the studies of Kimulu et al. [11] and Oke et al. [19], the Diabetic free equilibrium (DFE)
 is
is 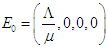 and the endemic equilibrium point (EEP)
  is
is 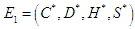 where
where 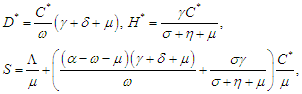 The reproduction number
  is determined using the next generation matrix method as follows (see [25,5]). Let the matrices
  and
and  represent the new infections and negated outward transitions from these compartments respectively, then
 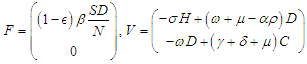 from which
 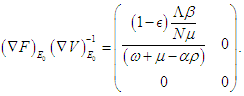 and the eigenvalues are
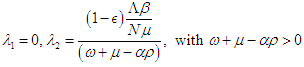 Finally, the basic reproduction number is
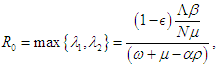
2.2.2. Local Stability of the Equilibrium Points
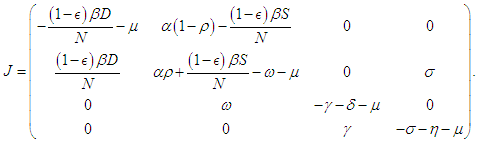
- According to the formulations of Oke and Bada [18], the Jacobian matrix for the system (2.1 – 2.4) is
 Evaluating
  at
at  we have
 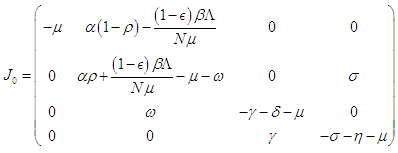 and evaluating at
  we have
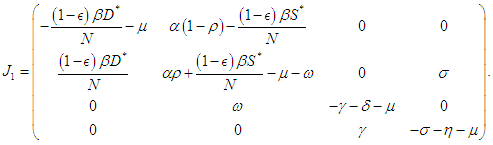 The following theorems verify the local asymptotic stability conditions for the equilibrium points.Theorem 2.1. The DFE of the system (2.1-2.4) is locally asymptotically stable if
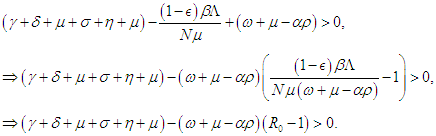
  Proof. The characteristic equation of the Jacobian at the DFE is
  so that
 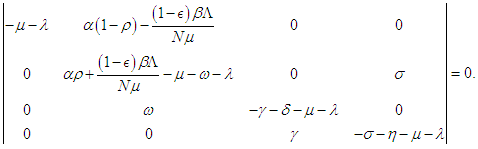 Letting
 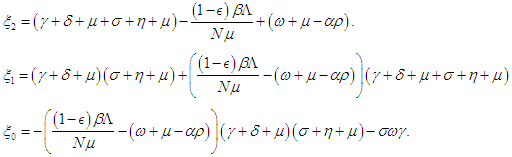 then the characteristic equation becomes
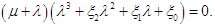 The first eigenvalue is
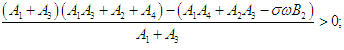
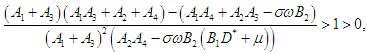
  is negative. Using Routh-Hurwitz criteria, the other three eigenvalues are of negative real parts if the following three conditions are satisfied;
  | (2.5) |
 which finally means
 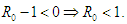 Condition 3 implies that
 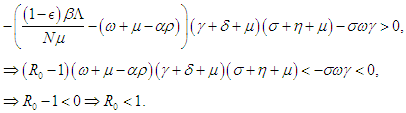 Condition 2 implies that
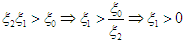 and hence,
 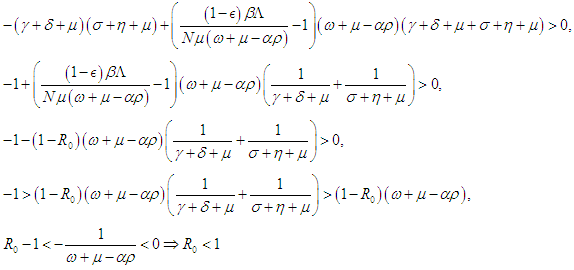 Therefore, the DFE is asymptotically stable if
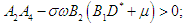
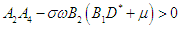
  Theorem 2.2. The EEP of the system (2.1-2.4) is locally asymptotically stable if
  Proof. Letting
  then the Jacobian at the EEP
  is
is 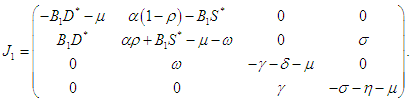 The characteristic equation of
  is
is 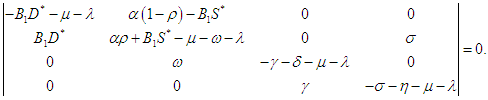 and thus on setting,
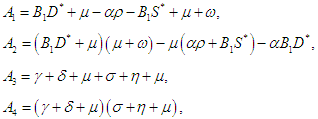 then the characteristic equation becomes
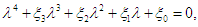 where
where | (2.6) |
 | (2.7) |
 | (2.8) |
 | (2.9) |
 | (2.10) |
 | (2.11) |
 | (2.12) |
 | (2.13) |
 | (2.14) |
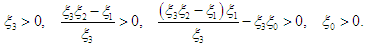
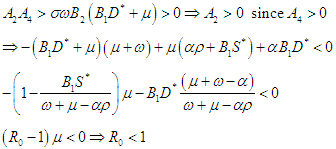 Therefore, the EEP is asymptotically stable if
2.2.3. Positivity and Boundedness of Solution
- In what follows, we shall show that the solution space for the model equations (2.1-2.4) is bounded and positive provided
 and
and  Setting
  and summing up the system (2.1 - 2.4), then
 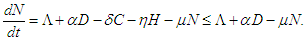 which on solving gives
 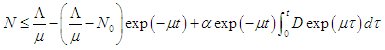 As
As  then
then  Hence, the solution space
  is bounded, so that
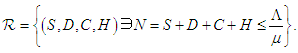 Also, from equation (2.1 – 2.4),
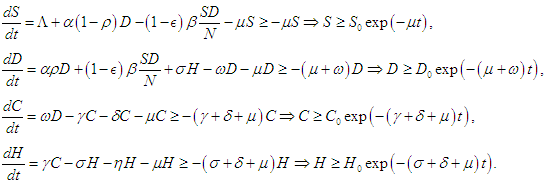 Thus, solutions
  remain positive in the region
2.3. Numerical Procedure
- Equations (2.1 – 2.4) are solved using the Runge-Kutta scheme of the fourth order. The fourth order Runge-Kutta scheme for the autonomous differential equations
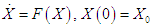 where
where  is given as
  and
and 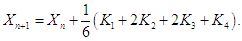 The choice of the fourth order Runge-Kutta Scheme is due to its stability and large region of convergence (see [17,20] for other methods). Absolute error tolerance is set to
  and the numerical solutions obtained are plotted as graphs to evaluate the trends as the parameter values are varied. Default values chosen for the parameters are Kenyan

3. Analysis and Discussion of Results
- Lifestyle can be transmitted from a diabetic patient to susceptible individual due to interaction between diabetic patients and the susceptible class. It is also important to note that not all interactions lead to lifestyle transfer, hence
 represents the proportion of such interactions that lead to a transfer of lifestyle. Figure (2) shows the effect of
  on the diabetic population. As
  increases, most susceptible individuals will acquire an unhealthy lifestyle from the diabetic subpopulation due to interactions. For this reason, the susceptible class declines as
  increases. Hence, this will cause a sudden rise in the diabetic class which will decline due to a reduction in the susceptible (see Figure 2). The same pattern obtained in the diabetic class is also obtained in the hospitalised and the complicated classes.
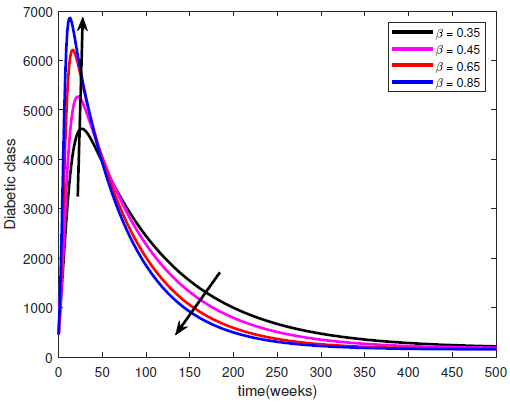 | Figure 2. Variation of the Diabetic cases with Diabetic-Susceptible interactions |
 represents the rate at which people within the susceptible class embrace healthy lifestyle. As
  changes from 0 to 1, the quality of the healthy lifestyle increases from the least to the best quality of lifestyle. By increasing
  , the quality of lifestyle gets better among the individuals in the susceptible subpopulation. With this in place, the susceptible class continues to rise. Consequently, the number of people who migrate into the diabetic class reduces, the complicated class reduces and the hospitalised class reduces (see Figure (3)).
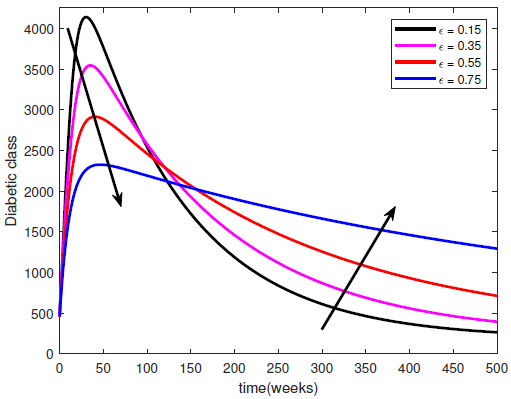 | Figure 3. Variation of the Diabetic class with lifestyle impact |
 represents the rate at which complicated cases are cured of their complications so that they can return to the diabetic class. Hence, increasing
  means increasing Progression from Hospitalised class back into the diabetic class. This leads to a reduction in the hospitalised class but an increase in the diabetic class (see Figure (4)).
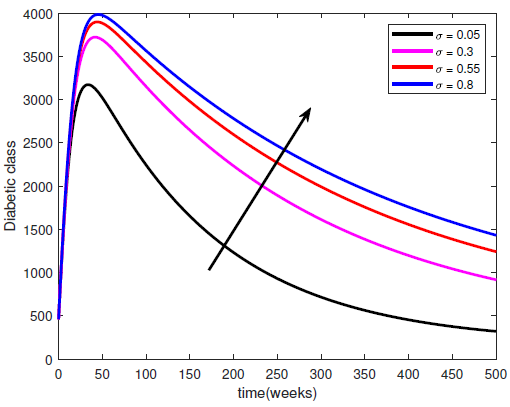 | Figure 4. Variation of the Diabetic class with recovery rate |
 represents a constant hospitalisation rate from the complicated class. By raising the values of
  , the Complicated class begins to reduce while both the diabetic and hospitalised classes increase. If the constant hospitalisation rate continues to increase, then the hospitals will become congested and overloaded. Hence, a constant hospitalisation rate is not a good way to control the complications in the diabetic patients.
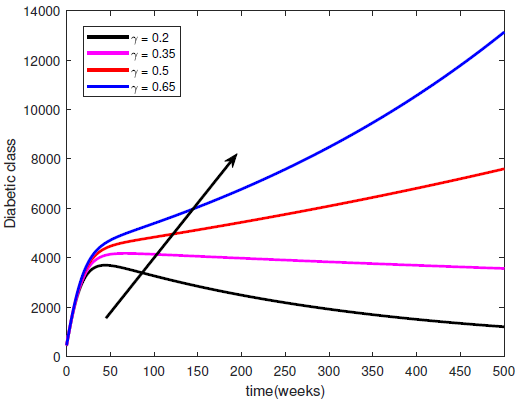 | Figure 5. Variation of the Diabetic class with Hospitalisation rate |
4. Conclusions
- This study investigates the behaviour of the diabetic population, taking into account the complicated diabetic cases with a constant per capita hospitalization rate. A mathematical model is developed to investigate the impact of the parameters on the diabetic populations. The equilibrium points and the reproduction numbers are obtained. The equilibrium points are shown to be locally stable if
 The model is shown to be well-possed, positive and bounded. The models are numerically solved using the Runge-Kutta 4 technique, and the results are graphed. The following results were obtained:i. An increase in the unhealthy lifestyle leads to a sudden rise in the diabetic which declines over time.ii. An increase in the healthy lifestyle leads to a reduction in the diabetic class.iii. A constant per capita hospitalisation rate will lead to overburdening of the health facility. Hence, resources at the health facilities should not be left fixed for too long.