-
Paper Information
- Paper Submission
-
Journal Information
- About This Journal
- Editorial Board
- Current Issue
- Archive
- Author Guidelines
- Contact Us
Applied Mathematics
p-ISSN: 2163-1409 e-ISSN: 2163-1425
2022; 12(1): 1-7
doi:10.5923/j.am.20221201.01
Received: Feb. 8, 2022; Accepted: Mar. 14, 2022; Published: Mar. 24, 2022

Mathematical Modeling of Electricity Hybrid Systems Based on Wind, Sun Radiation and Micro Hydro Systems with Efficiency Control Strategy Using Photocell and Motion Sensor or Wifi Switch
 Abstract
 Reference
 Full-Text PDF
 Full-text HTML
Tiryono Ruby1, Machudor Yusman2
1Department of Mathematics, Lampung University, Bandar Lampung, Indonesia
2Department of Computer Science, Lampung University, Bandar Lampung, Indonesia
Correspondence to: Tiryono Ruby, Department of Mathematics, Lampung University, Bandar Lampung, Indonesia.
| Email: |  |
Copyright © 2022 The Author(s). Published by Scientific & Academic Publishing.
This work is licensed under the Creative Commons Attribution International License (CC BY).
http://creativecommons.org/licenses/by/4.0/

This paper constructs a mathematical model of a hybrid electric energy system based on renewable energy sources and the reliability of photocell efficiency control strategies, motion sensor and or wi-fi switches in response to fluctuating demand loads. By combining these models and strategies, it is hoped that they can accommodate the phenomenon of the electricity supply system and fluctuations in demand loads that must be met together so that the actual optimal conditions in system operation can be achieved. Thus the system design information obtained from this study can be more accurate and precise so that in making decisions on the procurement of a hybrid system unit, the required power source equipment can be of higher quality and more accurate, especially in this pandemic era.
Keywords: Mathematical model, Hybrid, Renewable sources, Switching
Cite this paper: Tiryono Ruby, Machudor Yusman, Mathematical Modeling of Electricity Hybrid Systems Based on Wind, Sun Radiation and Micro Hydro Systems with Efficiency Control Strategy Using Photocell and Motion Sensor or Wifi Switch, Applied Mathematics, Vol. 12 No. 1, 2022, pp. 1-7. doi: 10.5923/j.am.20221201.01.
Article Outline
1. Introduction
- Along with population growth and today's developments, the need for electricity today has increased to become a very vital need in the wheel of life, not only in big cities but in remote villages, plantation areas or small islands-even in dire need of electricity [1]. The strategy of the generator unit system (GUS) in procuring electricity sources for electrification has been widely known. However, to maintain a consistent energy supply in this way, it turns out that a lot of the energy produced is wasted when the load that must be met decreases. Unfortunately the generator unit system is not able to store the remaining electrical energy so that a lot of electrical energy is wasted, especially when the output from the generator exceeds the demand load. Operating the genset unit at a low power level for an extended period of time can result in scaling of the engine block cylinder of the generator set. These conditions require special treatment and will cost a higher treatment than regular treatment. The benefits of having electricity facilities include lighting, entertainment, communication, information, industry, irrigation, transportation, security, safety, defense and or research support facilities.The GUS system is a system for supplying electricity sources that are commonly used in areas that have not been reached by the electricity network of the State Electricity Company [1]. The consideration is that the equipment needed to make the system is easy to obtain, inexpensive, and easy to install. In addition, diesel generators are relied upon to provide a relatively consistent supply of electrical energy. However, to maintain a consistent supply of electrical energy will result in an increase in operational costs, especially for the expenditure of fuel costs that must be provided to keep the generator set in operation. This condition is exacerbated by the high price of fuel in remote locations/plantations or small islands, because the fuel must be imported from outside the area which is quite far away.Another drawback of the GUS system is its low efficiency. This system is not able to store the remaining electrical energy so that a lot of electrical energy is wasted, especially when the output from the generator exceeds the demand load. If the GUS is operated at an output level 40% lower than maximum capacity, for example during the day, it may reduce the amount of fuel used. However, by operating the GUS lower than the maximum capacity, a lot of electrical energy cannot be produced than it should be. The loss of electrical energy that is not produced as a result of not being utilized optimally from a GUS system is not proportional to the decrease in the amount of fuel used. In fact, the demand load on the system fluctuates so that the GUS rarely operates at maximum power capacity for a sufficiently long period of time.Another problem in using the GUS system is in terms of maintenance costs. Broadly speaking, maintenance costs depend on how the diesel generator is operated. Generator damage generally occurs in the heating phase, when the generator is started from cold conditions. Frequent switching on and off of the generator should be avoided, and once the generator is turned on it should reach standard operating temperatures and maintain this condition for as long as possible. In fact, this method is often used to adjust the output level or the length of operation time of the GUS according to the demand load. Operating the generator set at a low power level for an extended period of time can result in scaling of the generator engine block cylinder. These conditions require special treatment and will cost a higher treatment than regular treatment [1].One alternative to procuring an efficient power source for electrification with relatively low operating costs is the design of a wind, solar and micro hydro-based hybrid system with an operational strategy of controlling efficiency using photocell, motion sensor and or wifi android os. The system is used to procure a power source that has the ability to store the remaining electrical energy and the ability to switch when the load to be fulfilled fluctuates up or down. Therefore, to accommodate the procurement of efficient and renewable or environmentally friendly electricity sources together, from the applied side it is very interesting and challenging to study the development of a mathematical model of a hybrid system of electrical energy based on wind, solar and micro hydro as alternative energy for electrification, at the same time. with the conditions of the pandemic situation, the use of photocell, motion sensor and or wifi android os for efficiency control is very relevant to be applied as an attitude to maintain health protocols.
2. Battery Model
- An important aspect that has been developed is to carry out dynamic modeling of battery recharge and discharge, namely by taking the following approach: for example C(t) is the battery capacity at time t, measured in watt-hour units. The battery dynamic model is given as follow:
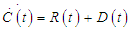 where R(t) = recharge rate and D(t) = discharge rate. For example, PB(t) is the net energy available for the battery, with the understanding that PB(t)>0 means the rechsrge cycle is in progress and PB(t)<0 is the discharge cycle is inprogress.The recharge rate is given by the following model:
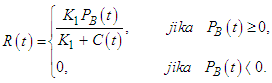 Where K2 is a risk factor, operational in the field the value of K2 1.4 which means that only about 70% of the energy stored in the battery can be used to supply the system load. Note that K1 and K2 are assumed to use lead-acid batteries [2]. Since the battery is considered as part of the system, PB(t) becomes a function that depends on other system components and the system load, in this case how much windmill dynamo capacity is used and how much lamp load is used so as to achieve efficient system operational costs. So far the battery model has not affected the conversion from DC to AC (and vice versa).
 3. Hybrid System Power Generation Configuration
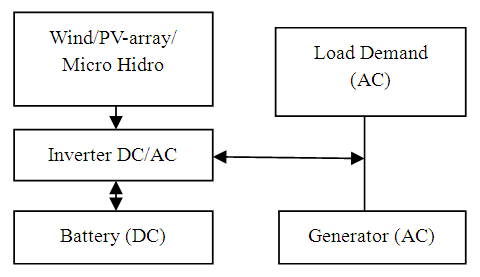
- All In general, the hybrid system power plant (HSPP) configuration has components as described in the previous section [3,4,5,6,7,8,9,10,11,12], plus renewable sources of energy, such as windmill generators or micro-hydro power plants. In the HSPP-Parallel Topology configuration, the inverter and the rectifier can be combined into one, which is a two-way inverter (a be-direction inverter) [13]. Thus this configuration is more efficient, because the AC generator can directly supply the demand load without losing energy due to going through the inverter first [14]. In this work we focus only on the HSPP-parallel topology configuration as shown in Figure 3.1.
 | Figure 3.1 |
|
|
4. Solar Radiation Model
- K Sunlight as a renewable renewable energy source is one of the energy sources currently in Indonesia that really needs to be developed, given the increasing demand for electrical energy, this is in line with the increasingly limited energy sources from fossil fuels. One of the sources of energy from sunlight is used to generate electricity. Therefore, electricity procurement for remote areas or in urban areas needs to be developed in a sustainable manner with a touch of science and technology that is environmentally friendly. The next step is to record data every certain time interval of the voltage generated by the solar panels. In this research, data is taken or data is recorded on an electric voltage meter every 1 minute from 07.06 to 17.34 Jakarta time zone on 10 October. Plot the data obtained by the measuring instrument at Cartesian coordinates using Microsoft Excel software which is shown in the following graph.
 | Figure 4.1. Plot of sun intensity data from sunrise–sunset obtained on October-10 |
 | Figure 4.2. Plot of solar intensity data that forms a normal curve |
5. Genset Fuel Consumption Model
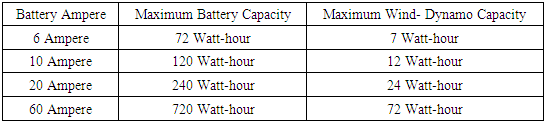
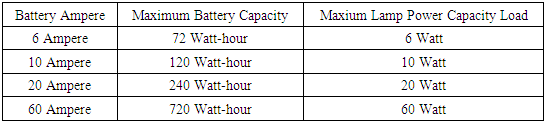
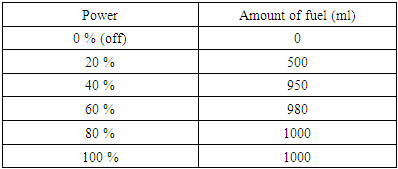
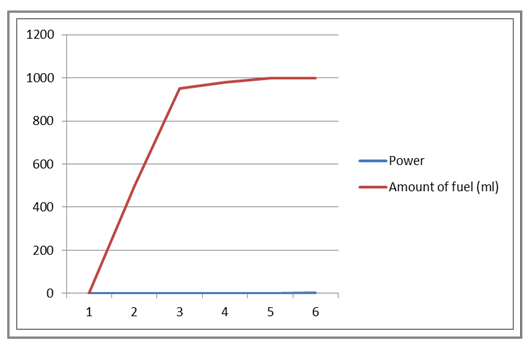
- First of all the generator is off or at an output level of 0% of maximum capacity, this condition is a condition where the generator does not operate. By installing a transparent measuring tube in the fuel tank, the amount of fuel used will be measured. Furthermore, after the generator is ready to operate, install the output power level of 20% of its maximum capacity, by shifting the direction of the needle on the generator engine. For 1 hour the generator is turned on at that level, the amount of fuel used can be measured by observing the measuring tube that has been installed, at that output level the generator can spend about 500 ml of fuel, with energy released 10 kw, at this level the amount of fuel consumed expended relatively little, according to the energy produced.The approximate power or output capacity of the generator with the amount of fuel every 1 hour is given in the following table:
|
 | Figure |
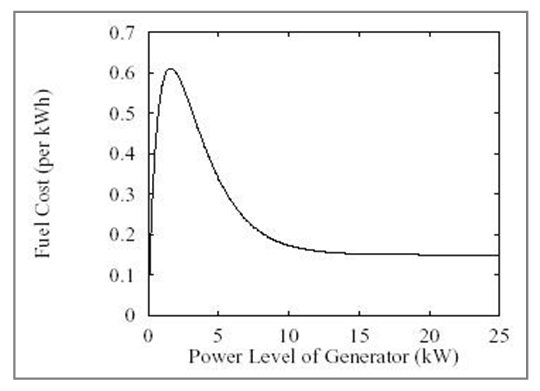 | Figure 5.1. Graph of the relationship between generator power levels and fuel prices |
6. Hybrid System Power Plant Operational Strategy
- There are many ways to operate a hybrid system as described in. In order for the operational cost of the hybrid system to be efficient, an optimization study is needed to obtain a strategic solution for the operation of the system. Optimization studies need to be carried out because they will provide an accurate solution in designing and operating a hybrid system, so as to achieve the most efficient operational costs. In this study, build a dynamic system model such that the overall operational costs of the system are efficient:1. If the demand load is less than or equal to the power generated by the generator, the inverter will continue the remaining energy from the generator, windmill or solar panels to charge the battery.2. If the demand load is less than or equal to the power generated from the combined generator set, windmill and solar panels, but the demand load is greater than the power generated by the generator set, then some of the energy from the turbine and solar panels is used to meet the demand load while the rest is used to charge battery.3. If the demand load exceeds the power generated from the combined generator, windmill and solar panels, then the battery together with other units supply energy to meet the demand load.From the steps described above, the operational mathematical model of hybrid system power plant so that the overall operational costs of the system are efficient as follows: For example, PB(t) is the net electrical energy in the battery, PP(t) is the energy produced by solar panels, PK(t) is the energy produced by the windmill, PG(t) is the energy produced by the generator and PL(t) is the demand load. Furthermore, the three operating options above can be modeled mathematically as follows:
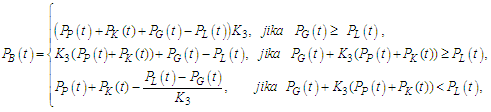 where K3 is the inverter efficiency constant.PB(t) positive
 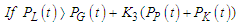 and PB(t) negative
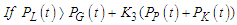 with the dynamic model of the system, namely dynamic recharge and discharge of batteries, no energy is wasted. Next, combining the PB(t) expression with the dynamic charge of the battery, we get a dynamic model of the whole hybrid system, namely:
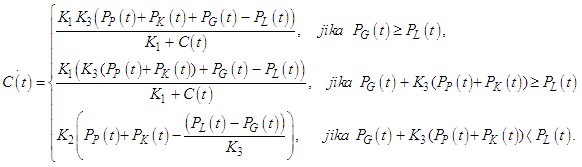 In practice the generator can be operated at one of a limited number of output levels, for numerical simulation, the generator control function is assumed that the generator can be operated at an output level of 0% (off), 40% (low), 60% (medium), 80% ( high) and 100% (maximum) of the maximum capacity [15]. The proposed objective function consists of three cost factors. Mathematically, it can be modeled as follows:1. Generator operational costs are given by model
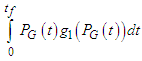 with PG(t) = level output generator in t,0 ≤ PG(t) ∈ {0%, 40%, 60%, 80%, 100%} ≤ Tmaxg1(PG(t)) = generator fuel cost efficiency function at time t,g1(x) = 2((0.2x + 0.5)0.4 – (0.5)0.4)e-0.1x + 0.15(1 – e-0.1x)).2. Charges for recharge and discharge of batteries are given by model
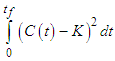 withC(t) = battery capacity at the time t,K = constant, keep the battery capacity 80% of the maximum capacity,3. Cost of generator fines for not operating at short time intervals given the model:
7. Numerical Results and Discusstion
- Some examples of case studies are shown with a 24-hour demand load profile as shown in Figure 7.1 “LOAD”. Battery capacity is limited between Cmin = 20 kWh and Cmax = 100 kWh. Several Co and Ct conditions are given for simulation:
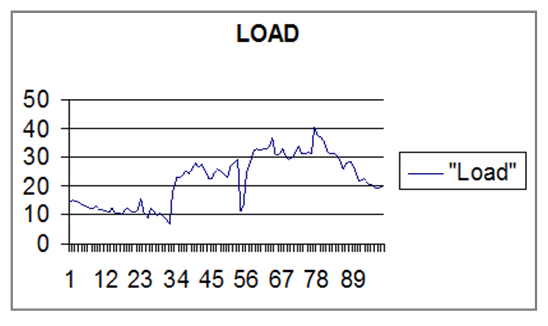 | Figure 7.1. “LOAD” |
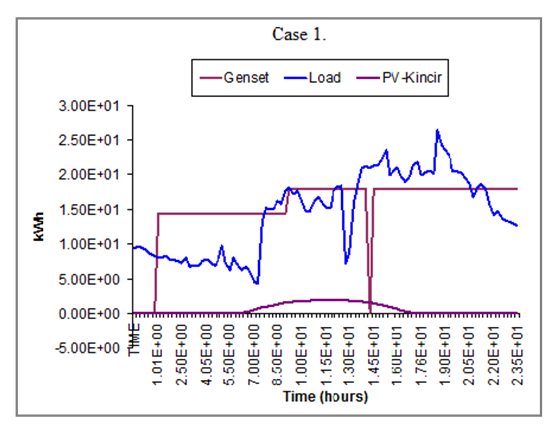 | Figure 7.2. “Case 1” |
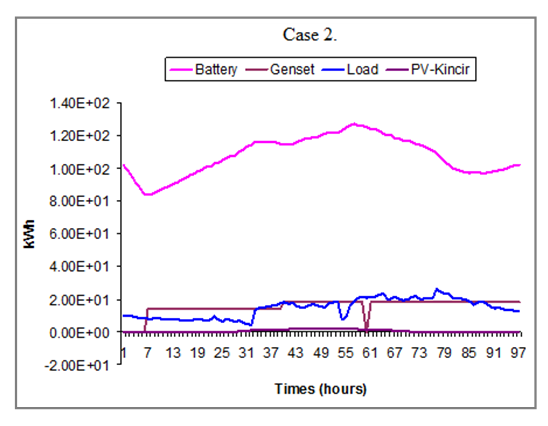 | Figure 7.3. “Case 2” |
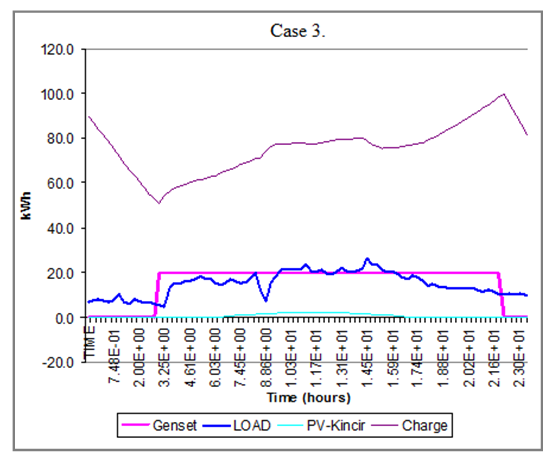 | Figure 7.4. “Case 3” |
8. Conclusions
- In this paper, we have modelled and developed control stategy for a electricity hybrid systems base on renewable sources using photocell, motion sensor and or wifi switch. Numerical results of the simulation model were presented. The profile recharge and discharge dynamics of lead acid battery as battery bank have shown. The strategy of using photocells, motion sensors and or wifi switch is very relevant in the situation of the pandemic and post-civid-19 pandemic era. the control stategy policies obstained from this model can aid in the future design of better adaptive control strategies.
ACKNOWLEDGEMENTS
- I would like to acknowledge to a number of people for their support and assitance provided during the time I have been working on this research, and all of those who have advised and helped me in the preparation and writing of this paper to be presented in the conference. Ir. Machudor Yusman, M.Kom, Departement Computer Science, FMIPA Lampung University for being friendly who always available for discussions;Professor Dr. Karomani, M.Si. as a Rektor and Dr. Ir. Lusmeilia Afriani, D.E.A. as the head of Research Center, University of Lampung, for their willing me to get financial support of BLU Terapan Universitas Lampung, also to the committee of the conference during my participation of LPPM Semnar 2021.