Munyabugingo Valens
General Courses Department, Rwanda Polytechnic, Integrated Polytechnic Regional College Ngoma, Kibungo, Rwanda
Correspondence to: Munyabugingo Valens, General Courses Department, Rwanda Polytechnic, Integrated Polytechnic Regional College Ngoma, Kibungo, Rwanda.
| Email: |  |
Copyright © 2021 The Author(s). Published by Scientific & Academic Publishing.
This work is licensed under the Creative Commons Attribution International License (CC BY).
http://creativecommons.org/licenses/by/4.0/

Abstract
There are many fascinating things that can be described by differential equations. This paper analyzes an epidemic model created from first order differential equations to describe how the Ebola virus potentially ravage a population in Congo and Uganda. Using epidemic modelling, data from two well documented website [5], [10] and Matlab packages, we present the solutions graphically. Using SIR model, it is possible to simulate Ebola outbreaks in Congo and Uganda. The dynamics of this model is determined by the per-capital death rate of infected individuals and the per-capital effective contact rate of an individual contracting the disease. The results of these outbreak simulations equip scientists with information that may enable them to minimize potential deaths caused by Ebola outbreak.
Keywords:
Ebola, Mathematical model
Cite this paper: Munyabugingo Valens, Numerical Resolution of a Mathematical Model of Ebola: The Case of Congo and Uganda, Applied Mathematics, Vol. 11 No. 2, 2021, pp. 15-20. doi: 10.5923/j.am.20211102.01.
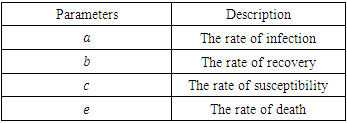
1. Introduction
Ebola hemorrhagic fever is highly infectious and lethal disease named after a river in the Democratic Republic of Congo(formerly zaire) where it was first identified in 1976 [5]. The origin of Ebola is somehow obscure. There have been only three major known outbreaks of the Ebola virus, Liberia, Sierra Leone and Guinea, and all have happened in west central African countries. A total of 116 new confirmed cases of Ebola virus disease were reported in the week to 8 march compared with 132 the previous week. Liberia reported no new confirmed cases for the second consecutive week. New cases in Guinea and Sierra Leone occurred in a geographically contiguous arc around the coastal capital cities of Conakry and Freetown, with a total of 11 districts reporting cases. Although there has been no significant decline in overall case incidence since late January (the recent contraction in the geographical distribution of cases is a positive development) enabling response efforts to be focused on a small area. Guinea reported 58 new confirmed cases in a week to 8 march compared with 51 cases the previous week. Cases were clustered in an area around and including the capital Conakry (13 cases) with the nearby prefectures of Boffa (2 cases), Coyah (8 cases), Dubreka (5 cases), Forecariah (28 cases) and Kindia (2 cases) the only other prefectures to report cases [10]. The latest major outbreak occurred in kikwit, Congo in 1995 and Uganda in 2000. The outbreak took the lives of 78 people. Ebola is the unique member of the ribonucleic acid virus family that has no known nature reservoir.The incubation period of Ebola is 1-21days and the infectious period is 4-10days. The onset of Ebola is characterized by severe headaches, malaise, fever, vomiting, bloody diarrhea and rash. Severe bleeding and shock are usually followed by death. Currently evaluation of two vaccines is taking place in a number of countries in Europe, U.S, Canada, Kenya, Gabon and Mali to test for safety and efficiency. If initial results are promising, testing in West African could start. Those vaccines are Chimpanzee adenovirus serotype3 (ChAD3-ZEBOV) and Recombinant Vesicular Stomatitis Virus (rVSV-ZEBOV) are being developed by GSK (with support from U.S government) and New Link under license from the government of Canada [10]. The mortality rate of Ebola is anywhere from 50-90%. Ebola is transmitted through primary contact with health workers who are in direct with Bobby fluids, secretions, tissues or semen from the infected persons [5], [10]. Ebola can also be transmitted through secondary contact by family members caring for the infected. Finally, Ebola can be transmitted where infection control mechanisms are not in practice. All persons entering the patient room should wear at least: gloves, gown (fluid resistant or impermeable), eye protection (goggles or face shield), and face mask. Additional personal protective equipment required in certain situation (example: copious amounts of blood, other body fluids, vomit or faeces present in the environment) including but not limited to double gloving, disposable shoe covers and leg coverings. These control mechanisms can be as simple as wearing gloves or as complicated as level-four disease control. Airborne spread has not been proven as a means of transmission.The SIR model differs in the way of parameters are acquired and fits best to the data of Congo and Uganda. The system of differential equations were used to model this outbreak.Inaccuracies in the model are to be expected since the parameters dictating the behavior of the model are obtained from only a few data points. There have been so few major outbreaks that the amount of data available is limited. The model's precision is dependent on his limitation. 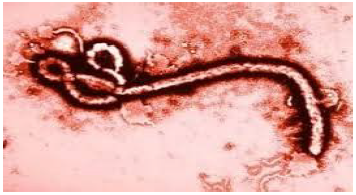 | Figure 1. Ebola virus structure |
2. Background of Ebola in Congo and Uganda
2.1. Ebola in Congo
In 1995, the outbreak began in the Bandundu region, primarily in Kikwit, located on the banks of the Kwilu River [9]. The first case (January 6) involved a 42-years old male charcoal worker and farmer who died on January 13 [9]. The Ebola virus was not identified as the causative agent until May 9 [9]. At that time, an international team implemented a control plan that involved active surveillance (identification of cases) and education programs for infected people and their family members. Family members were visited for up to three weeks (maximum incubation period) after their last identified contact with a probable case. Nosocomial transmission occurred in Kikwit General Hospital but it was halted through the institution of strict barrier nursing techniques that included the use of protective equipment and special isolation wards. A total of 315 cases of Ebola were identified (81% case fatality) [9]. Ebola is epidemic disease, the fact that the ministry of health of the Democratic republic of Congo (DRC) today announced that new case of ebola has been detected in Butembo, a city in North Kivu province, where the previous outbreak was declared over June 2020 [10].
2.2. Ebola in Uganda
In 2000, a total of 425 cases (53% case fatality) of Ebola were identified in three districts of Uganda: Gulu, Masindi and Mbarara [10].The onset of symptoms for the first reported case was on August 30, but the cause was not identified as Ebola until October 15 by the National Institute of Virology in Johannesburg (South Africa) [10]. Active surveillance started during the third week of October. A plan that included the voluntary hospitalization of probable cases was then put in place. Suspected cases were closely followed for up to three weeks. Other control measures included community education (avoiding crowd gatherings during burials) and the systematic implementation of protective measures by health care personnel and the use of special isolation wards in hospitals [10].
3. Ebola Mathematical Models
There are so many mathematical model of Ebola. Some of them are susceptible-infectious-recovery (SIR) model, susceptible-exposed-infectious-recovery (SEIR) model, severe acute respiratory syndrome (SARS).
3.1. SIR Model
This model Zaire's 1995 Ebola epidemic, using the Susceptible-Infectious-Recovery (SIR) model. The dynamics of this system happen in two stages: susceptible to infected, and infected to dead. This is a closed system where those that are susceptible could become infected at some point in time. This model assumes that the initial population is equal to the population that eventually be infected. The parameters are  ; the per-capital death rate; and
  , the probability that a susceptible host become infected. The parameter
  can vary from a constant function to an exponential function of decay with respect to the number of infected at time
  The population studied is divided into three Classes
  the number of susceptible individuals;
  the number of individuals infected; and
  , the number of dead individuals at time
  Assume that the population studied is a constant population during the outbreak, meaning there are no deaths due to outside factors and the number of births that occurred are so small that we can essentially ignore them. (This is a valid assumption since the lengths of the Ebola epidemics are not longer than three to four months.).
  denote the total population at time
  , so at any time
  ;
;  .
. This model takes into consideration the number of people infected due to direct contact with an infected individual at time
  , where
 is the probability of successfully getting infected when coming into contact with an infected individual, and
  is the per-capita contact rate. The death rate is denoted by
  where
where  , is the per-capital death rate. Even though recoveries do occur, we do not return these individuals to the susceptible class since there has never been a person who has recovered from Ebola and contracted the disease again in the same epidemic [4].
3.2. SEIR Model
This is the model of 1976 ebola outbreak in Yambuku, Zaire. The data used for this outbreak was obtained from the Center for Disease Control (CDC) in Atlanta, GA [5]. We model the total infections that occurred during the outbreak using a modification to the SIR model. In this model, we differentiate between the incubation period and the infectious period of the disease. As before in SIR model, the number of susceptible individuals at time t is denoted as  . we refer to the incubation period of the disease as the latent stage. The number of latent individuals (exposed) at time
  is denoted by
  . Individuals that are infected with the disease and are suffering the symptoms of Ebola is classified as infectious individuals. The number of infectious individuals at time
  is denoted by
  . Similarly, the number of dead individuals at time
  is denoted by
  . The population studied is a constant population during the outbreak; i.e., the total population at time
  is denoted by
  where
where  .The model is:
 This model takes into consideration the number of people infected due to direct contact with an infected individual and the number of people infected due to direct contact with a latent individual:
 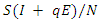 . In this model, the parameter
  where
where  is the probability of being infected and
  is the per-capital contact rate. The parameter
  is a weight factor added to the model since it is known that a susceptible individual has a higher chance of getting infected from an infectious individual than from a latent individual [4]. The individuals in the latent stage eventually show the symptoms of the disease, and pass on to the infectious stage. This is denoted by
  where
where  is the per-capital infectious rate. Then
  becomes the average time for a latent individual to become infectious. This will be denoted by
  where
where  is the per-capital death rate. Then,
  becomes the average time it takes an individual to die once he/she has entered the infectious stage. As before, death and recovery are taken to be the same, since there has not been a case in which a person who survived Ebola contracts the disease again.
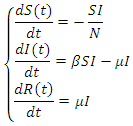
3.3. Differential Equation Model
A differential equation model is developed for the 2014 Ebola epidemics in Sierra Leone and Liberia. The model describes the dynamic interactions of the susceptible and infected populations of these countries. The model incorporates the principle features of contact tracing, namely, the number of contacts per identified infectious case, the likelihood that a traced contact is infectious, and the efficiency of the contact tracing process. The model is first fitted to current cumulative reported case data in each country. The data fitted simulations are then projected forward in time, with varying parameter regimes corresponding to contact tracing efficiencies. These projections quantify the importance of the identification, isolation, and contact tracing processes for containment of the epidemics.Susceptible individuals in class S in contact with the virus enter the exposed class E at the per- capital rate  where is transmission rate per person per day,
  is the total effective population size, and
  is the probability that a contact is made with an infectious individual (i.e. uniform mixing is assumed). Exposed individuals undergo an average incubation period (assumed asymptomatic and uninfected) of
  days before progressing to the infectious class
  Infectious individuals move to the
  -class (death or recovered) at the per-capital rate. The above transmission process is modelled by the following system of nonlinear ordinary differential equations [1], [4].
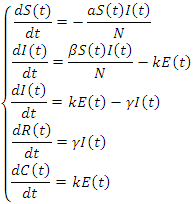
 is the transmission rate to susceptible S from
  is the class of infected (not yet infectious) individuals;
  is the rate at which
  -individuals move to the symptomatic and infectious class
  ; Infectious individuals
  either die or recover at rate.
  is not an epidemiological state but keeps track of the cumulative number of cases after the time of onset of symptoms.
4. Numerical Resolution of a Mathematical Model of Ebola
4.1. Presentation of a Mathematical Model of Ebola
Essentially a SIR model with the difference that the recovered can become infected again and the infected die at a certain rate. The susceptible are described by  , the infected by
  the recovered by
  and people that are killed by the virus are described by
  To create an equation that describes the population of the susceptible group with respect to time, start with the fact that the susceptible become infected at rate a. This means the change in population of the susceptible group is equal to the negative product of
  and
and  This can be written as:
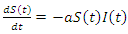 | (1) |
This equation isn't complete yet. Individuals from the recovery group become susceptible again at a certain rate c. This can be multiplied by  and added to the previous equation and written as:
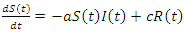 | (2) |
This is the complete equation that describes the change in population of the susceptible group over time. The equation that describes the population of the infected group begins with adding what was just removed from the susceptible population  This is written as:
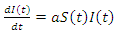 | (3) |
The population of the infected group is reduced in two ways, people can either recover or they are killed by the virus. Both options remove people from the infected group. When the infected recover they join the recovery group at rate  and when infected die they join the deceased group at rate
  This is written as:
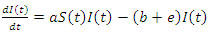 | (4) |
This is the complete equation that describes the change in population of the infected group over time. The recovery group's population is increased by those that recover from the virus. People recovered from the virus as rate  this means the population of the recovery group is increased by
  multiplied by
  and this is written as:
 | (5) |
The recovery group's population is reduced by the number of people that join the susceptible group, the recovered joined the susceptible group at rate c. Subtracting  from the previous equation is written as:
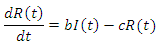 This is the complete equation that describes the change in population of the infected group over time. The last equation to build is for the deceased group. The population of the deceased group is defined by the number of people that are killed by the virus within the infected group. People were killed at rate e, so the equation for the population of the deceased group is written as:
 | (6) |
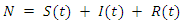
The sum of 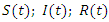 and
and  remains always constant.Finally based on dynamic diagram of the model given in the figure 2, the model system is given by the following system:
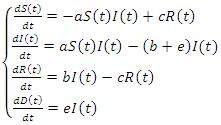 | (7) |
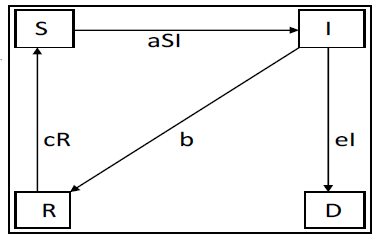 | Figure 2. Diagram of a mathematical model |
4.2. Numerical Implementation of the System
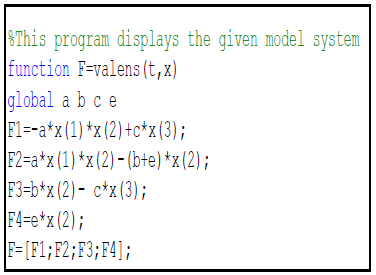
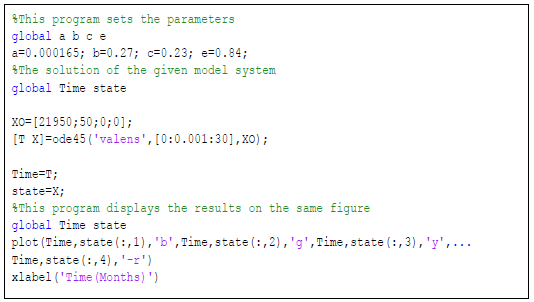
Because the Ebola-Cong model uses four separate differential equations we can use a numerical method to solve it. Matlab makes this easy. Perhaps the easiest way to solve is to create a function  with the equations and constants
  and
and  defined. Next, run that function file with the solver ode45 and plot. The susceptible group was started at 21,950. The initial infected group started out at 50.The deceased and the recovery group were both started at 0. Similarly, for Uganda we use the same programs but with change of parameter values and initial conditions which are 14,000 for susceptible group, 425 for infected group and 0 for both deceased and the recovery group. The timeline for Ebola outbreak in Congo and Uganda is described in the table below.
Table 1. Description of parameters for mathematical model
 |
| |
|
4.3. Numerical Results
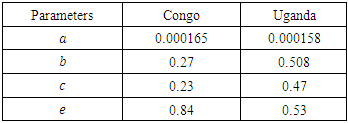
Executing the Matlab programs given in figures 3 and 4, we obtain the results presented in the figures 5 and 6.Table 2. Parameters used for Congo and Uganda
 |
| |
|
 | Figure 3. Matlab program for implementing the right hand of a mathematical model |
 | Figure 4. Matlab program for implementing solution and plotting the variables of a mathematical model (7) |
4.4. Interpretation of the Results
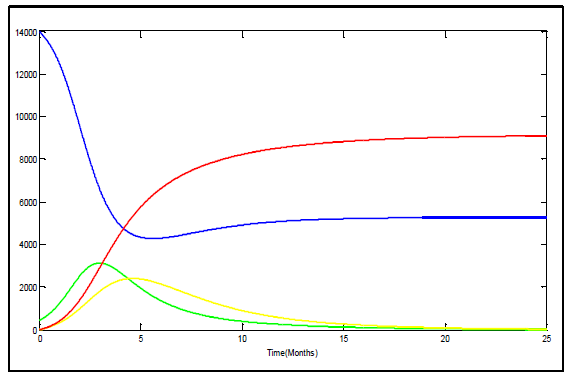
The figure 5 represents the Ebola outbreak in Congo. The number of the dead begins to rise following the infected groups climb and continues to climb until nearly thirty four percent of the population is dead. The susceptible group immediately begins to plummet due to how infectious of the virus is and at the same time the infected group's numbers begin to rise.The figure 6 represents the Ebola outbreak in Uganda. The number of the dead begins to rise following the infected groups climb until twenty one percent of the population is dead.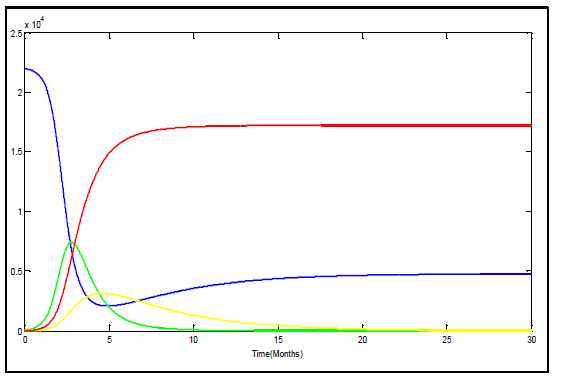 | Figure 5. Variation of susceptible (blue), infected (green), recovered (yellow) and deceased (red) in Congo |
 | Figure 6. Variation of susceptible (blue), infected (green), recovered (yellow) and deceased (red) in Uganda |
The solutions tends to be similar, however upon comparison of these solutions is more realistic. It is more realistic because the virus likely wouldn't spread over thousands of people in such a manner even though the virus is extremely contagious. From those two figures it is clear that there is no outbreak of Ebola since infectious tends to zero.According to the figures 5 and 6 the recovery group's peak is around 3134 peoples and 2400 peoples in Congo and Uganda respectively. This solution results in the susceptible group's population levelling out just under 5000 peoples in Congo and above 5000 peoples in Uganda. The recovery group and the infected group both head to zero as the last of the infected die off or join the recovery group. The recovery group joins with the susceptible group until no one remains in the group. Using data cursor on m Matlab figures and calculation of percentages, we find that the deceased group in Congo and Uganda reaches equilibrium around 17220 and 9100 respectively. In total 78.5 percent and 65 percent of the population is wiped out by the Ebola virus in Congo and Uganda respectively.There are clear differences in the manner in which the two Ebola outbreaks were handled. Uganda was better able to put infectious control measures in place promptly. Congo caused identification and implementation of infection control measures to be delayed by approximately 5 months. The duration of Ebola outbreak in Congo was longer than in Uganda and more poorly contained, allowing further spread of disease than in Uganda, and percent mortality was greater when compared to strain specific controls even if until now there is no confirmed cases of Ebola outbreak in those two countries. The total number of cases was greater in Uganda, however, given the population of each region, a high percentage of the population was infected in Congo.
4.5. Conclusion and Recommendations
The main task of this study was to find the data which are update, to solve a mathematical model of Ebola using Matlab packages and to analyze the results if they are approximately similar to the real life. The numerical resolution of a mathematical model is a very good, useful method and important one for finding the approximated solutions which have the same behavior as those of the exact solutions. Resolution of a mathematical model numerically gives approximated solutions depending on chosen parameters. According to the cases of Congo and Uganda, now there is no outbreak of Ebola and this is clear on the graphs of approximated solutions. I have worked on deterministic model, my recommendation is to try to work on stochastic model.
References
| [1] | Anderson, RM and May, RM, Infectious Diseases of Humans, Oxford University Press, Oxford, 1991. |
| [2] | C. L. Althaus, Estimating the reproduction number of Zaire ebolavirus (EBOV) during the 2014 outbreak in West Africa, PLOS Currents Outbreak, September 2, 2014. |
| [3] | Bickel, P, Doksum, KA. Mathematical Statistics. Holden-Day, Oakland, California, 1977. |
| [4] | Brauer, F, Castillo-Chavez, C, Mathematical Models in Population Biology and Epidemiology, Springer-Verlag, New York, 2000. |
| [5] | Centers for disease control (CDC), Ebola Hemorrhagic Fever, http://www.cdc.gov/ncidodi/dvrd/spb/mnpages/dispages/ebola.htm, 2003, consulted on 12th January 2015. |
| [6] | O. Diekmann1 and J. A. P. Heesterbeek, Mathematical Epidemiology of Infectious Diseases: Model Building, Analysis and Interpretation (Wiley, ADDRESS, 2000). |
| [7] | International Society for Infectious Disease, ProMED-mail (April 16th, 2003), archive Number 20030416.030. |
| [8] | Gerardo Chowell-Puente, Mathemodel model of emergent and re-emergent infectious diseases, 2005. |
| [9] | Khan, AS, Tshioko, FK, Heymann, DL, et al, The Reemergence of Ebola Hemorrhagic Fever, Democratic Republic of the Congo, 1995, J Inf Dis 1999; 179: S76-86. |
| [10] | World Health Organization Regional Office for Africa. Resurgence of Ebola in North Kivu in the Democratic Republic of the Congo. Brazzaville: WHO Afro; 2021. Available from: https://www.afro.who.int/news/resurgence-ebola-north-kivu-democratic-republic-congo. |

 Abstract
 Reference
 Full-Text PDF
 Full-text HTML