Alfred Hugo, Eva Mwaseba Lusekelo, Raymond Kitengeso
Department of Mathematics, College of Natural and Mathematical Sciences, University of Dodoma (UDOM), Dodoma, Tanzania
Correspondence to: Alfred Hugo, Department of Mathematics, College of Natural and Mathematical Sciences, University of Dodoma (UDOM), Dodoma, Tanzania.
| Email: |  |
Copyright © 2019 The Author(s). Published by Scientific & Academic Publishing.
This work is licensed under the Creative Commons Attribution International License (CC BY).
http://creativecommons.org/licenses/by/4.0/

Abstract
This paper concentrates on the mathematical model for optimal control and cost-effectiveness analysis of tomato yellow leaf curl virus disease. The boundedness of the model has been analytically examined. The preferable optimal level of the intervention strategy to reduce the spreads and the cost of implementing control strategies were determined by introducing the time-dependent control. Pontryagin’s maximum principle was used to determine necessary conditions for the optimal control of the disease while numerical results obtained through forward-backward sweep method and fourth-order Runge-Kutta scheme using the forward solution of the state equations. The cost-effectiveness analysis results show that protective netting and removal of the infected plant is the most cost-effective strategy to combat the epidemic of tomato disease with limited resources. Therefore, TYLCV can be controlled if the farmers will effectively apply protective netting and remove the infected plants from the farm.
Keywords:
Tomato yellow leaf curl virus, Optimal control, Cost-effectiveness
Cite this paper: Alfred Hugo, Eva Mwaseba Lusekelo, Raymond Kitengeso, Optimal Control and Cost Effectiveness Analysis of Tomato Yellow Leaf Curl Virus Disease Epidemic Model, Applied Mathematics, Vol. 9 No. 3, 2019, pp. 82-88. doi: 10.5923/j.am.20190903.02.
1. Introduction
Production of tomato in many parts of the world has faced a major constraint due to Tomato yellow leaf curl virus (TYLCV) [1]. The virus belongs to the genus Begomovirus of the family Geminiviridae. The virus was first identified in Israel around 1930. However, since 1935 it has been a permanent pest, mainly in the Jordan Valley. The virus has affected more than 30 countries that grow tomatoes and is commonly found in tropical and subtropical regions [2]. TYLCV has been found in different areas worldwide, such as the Mediterranean, Japan, China, and many other countries [3]. TYLCV can also affect tobacco, pumpkin, cassava, cotton, and other economically important crops [4]. Most of the developing countries are affected by TYLCV due to climatic change and the high costs of treatments used in order to control the disease [5]. Examples of African countries that are affected by TYLCV disease are Egypt, Sudan, Tunisia, Burkina Faso, Nigeria, Senegal, Cape Verde Islands, Mali, Ivory Coast, Gambia, Mauritania and Tanzania [6]. In Tanzania, an initial survey was conducted in 1993/1994. Since then one new distinct tomato Gemini virus has been identified [3]. TYLCV is transmitted by the insect vector Bemisiatabaci, commonly known as Silver leaf whiteflies (Bemisiatabaci) [7]. The virus is efficiently transmitted during the adult stage of the whiteflies. Generally, female whiteflies transmit the virus more effective than the males.The whitefly can acquire the virus when it feeds by sucking plant juices from the underside of leaves of infected plants for 15 to 30 minutes. After 21-24 hours of incubation within the insect it can transmit the virus to other tomato plants. A period of at least 15 minutes of feeding on the new tomato host is subsequently required for transmission of the virus. The whitefly retains the virus for up to 20 days after an acquisition period and thereafter loses the ability to transmit it to another plant [8]. Shorter acquisition feeding results in shorter virus-retention period. Vector transmission efficiency of TYLCV declines with time and most of the females fail to transmit the virus for more than 10 days after acquisition [9]. However, during that period, the vector is unable to compensate for its steadily decreasing viral-transmission capacity by reacquiring the virus from the infected source. The symptoms develop on young plants after 10 to 14 days; however, the disease can be easily recognized when tomato plants are infected at the seedling stage, especially when the infection occurs before the flowering stage. At this stage, tomatoes are severely affected by the disease. Whitefly populations decrease after heavy rains. This leads to reduction of the spread of TYLCV and during the night, they settle on the lower leaf surfaces. During spring and summer, whitefly populations migrate, hence reduction in the spread of TYLCV. So, the growers need to monitor whitefly populations very closely and destroy whitefly weed hosts and crop residues. Disease incidence increases rapidly and can reach to 100% infection at a harvest [10].The mainly intensive treatment of TYLCV is by using insecticide control [11], hybrid seeds, crop rotation, growing tomatoes under greenhouse conditions and resistant crop varieties. This means that tomato crops should not be located near plants that attract whiteflies, such as eggplants, beans, pumpkins and other flowering weeds [12].Sabuka et al [23] developed an epidemiological model in which vectors make only a transitory visit to the crop and do not reproduce. They also estimated parameters for the case of tomato leaf curl virus disease (TLCVD) (Geminiviridae, Subgroup III) in India. Their results showed that the use of protective netting combined with the growth of resistant varieties has the potential to reduce both B. Tabaci immigration to the crop and to reduce virus inoculation by those insects which do reach the crop [13]. Also, introduced a mathematical model that simulates the complex dynamic interaction between Begomovirus genetics, their adaptability to certain plants, and the availability of those plants to the virus under different cropping patterns. Their results indicate that developing more diverse and less concentrated cropping patterns, both in crop land extent and in time seems to be the only simple recourse. It has been recognized that it is important to choose the optimal level of prevention and detection effort for management of diseases [14]. In addition, according to Epanchin-Niell [15], it is also important to use optimal control of established invasive species. This review focuses on economically optimal control methods [16,18] simulation methods [15] with biological invasion spread theory to manage the spread of TYLCV. Jeger et al [17] worked on epidemiological model with its parameters estimation for tomato leaf curl virus disease in India while Maruthi [20] compared the control strategies for controlling the disease.
2. Material and Methods
This study modifies the work by Jeger et al [18] by incorporating the time dependent control to the tomato plants and vector populations in analysing the cost effectiveness of control strategies. The formulated dynamics include tomato plants and vector that spread the disease in tomato. The tomato plant is divided into the following sub epidemiological classes: Healthy tomato  , latently class (L), and infectious tomato plant (X). Healthy tomato plants are added at rate
  . All classes were assumed to be removed at a constant rate
  in accordance with the period of the crop cycle. Healthy tomato plants became latently infected at rate a which also depends on the availability of healthy vectors
  and the abundance of infective vectors Y. Latently infected plants L pass to the infectious class at a rate b which is inversely proportional to the mean latent period. The acquisition parameter
  determines the rate at which non-infective vectors
  became infective depending on the availability of non-infective vectors and the abundance of infectious hosts Y. A constant rate of immigration
  was assumed to take place from these alternative hosts with infective vectors proportion
  and a non-infective vector proportion
  was assigned
  and
and  respectively while
  is the mortality rate of vectors.To ensure full protection of the tomato plants, the time dependent control was proposed and incorporated. The main control measures considered in this study includes protective netting
  , insecticide control
  and the removal of the infected plant
  . The incorporated control measures of the TLCV disease focus on decreasing the transmission of the virus by removing infected plants in the field and carefully placing into plastic bags for disposal, use of insecticides (regularly spraying during the seedling stage to reduce the population of the whitefly vector) and application of protective netting. The protective netting also reduces both B. Tabaci immigration to the crop and prohibits infected whitefly in reaching other crops. Basing on these assumptions, we come up with the following system of the equations:
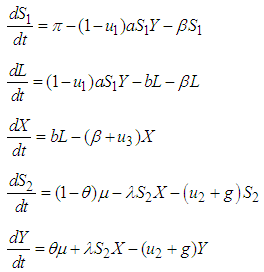 | (1) |
where, is the control variable based on protective netting
 is the insecticide control variable based on vector
 is the control variable that measures the effectiveness of removal of the infected plant.
2.1. Boundedness of the Model
We examine the boundedness of the model (1) with absence of control ,
,  and
and  using the following lemma.LemmaAll solutions of the system (1) which starts in
  are uniformly bounded.Proof:Let
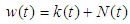 | (2) |
 Differentiating and solving (8) we get,
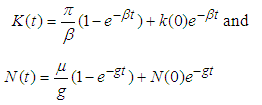 | (3) |
Then, | (4) |
Consequently, as  , we have
 | (5) |
for any  is bounded. Implying that all solutions of the system (1) are uniformly bounded in the interior of
  , then
 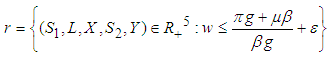 for any
  is bounded.
2.2. Application of Optimal Control
The control theory is applied for the aim of minimizing the spread of the disease in the plant as it is used to make a decision involving a complex of biological situations [18]. The purpose of introducing controls in the model is to find the optimal level of the intervention strategy preferred to reduce the spread and cost of implementation of the control [22]. The control variables ,
,  and
and  are minimized subject to the differential equations (1) and the minimization objective function presented as:
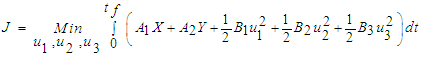 | (6) |
where,  is the final time,
  is the cost associated with plant treatment and insecticide control of vector while
  ,
, and
and  are relative cost weight for each individual control measure. The objective function (6) involved in minimizing the number of infected plants as well as the cost of applying control strategies is,
 | (7) |
where, 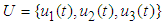 are measurable. By using the system of Equations (1) into a problem of minimizing point-wise, a Hamiltonian function (H), with respect to
  is given as:
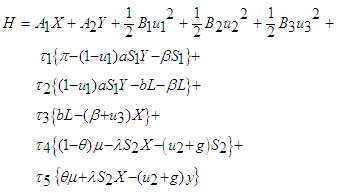 | (8) |
where,  are the co-state variables associated by
  . The adjoint equations are obtained by
 with transversality condition
  Then we obtain the following adjoint equations:
 | (9) |
The optimality of the control problem is obtained as: where
where  . Then,
 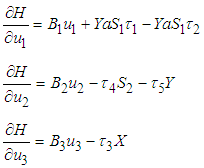 | (10) |
The solution of 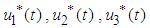 are presented in compact form as:
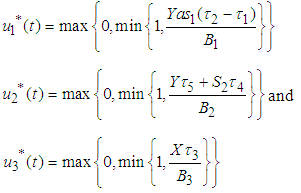 | (11) |
3. Numerical Results
In this section, the numerical effects of optimal control strategies are analysed and discussed. The solution of the optimal control problem was obtained by solving the optimality system of state and adjoint systems through forward-backwards sweep method. The adjoint systems (9) were solved by fourth-order Runge-Kutta scheme using the forward solution of the state equations. The optimality condition is satisfied through the convex update of the previous control values.
3.1. Optimal Control Numerical Results
The main objective of this study was to assess the impact of control strategies such as insecticides, protective netting and removal of infected plants on the transmission of TLCV. In order to support the analytical results, graphical representations of various strategies are visualized for determining its impact whenever the control is applied to the system [21]. For the numerical simulations, we use the literature parameter values as shown in the Table 1 as applied by other researchers.Table 1. Ranges of parameters and variables used in the model with data sources
 |
| |
|
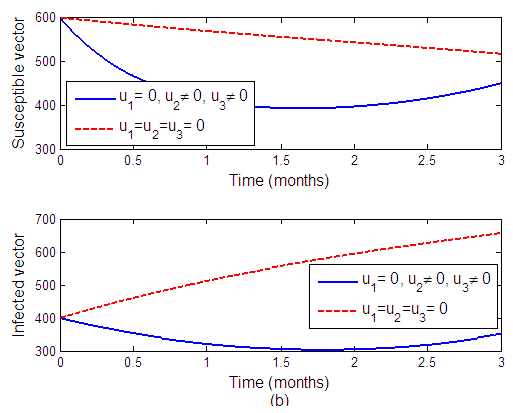
Strategy A: Combination of protective netting and whitefly insecticideFigure 1 shows the positive effect of protective netting and insecticide when  and
and  are applied to the system and
  is set to zero. Figure 1(a) shows that, when the control is applied, the susceptible tomato increases while infected tomato decreases. The significant difference is also observed in susceptible and infected vector, when the control is applied, infected vector decreases as well as susceptible vector decreases as shown in Figure 1(b). This result shows that the optimal control measure is effective in tomato plant and vector.
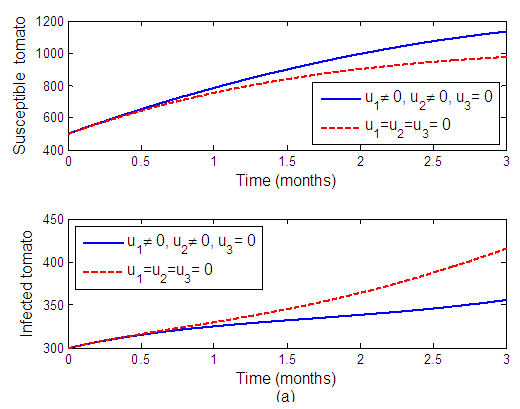 | Figure 1(a). The effects of protective netting and whitefly insecticide on tomato plant population |
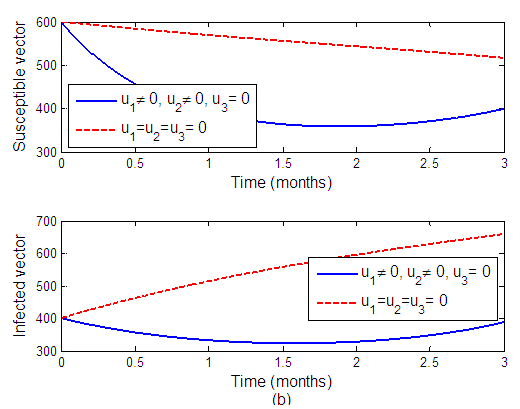 | Figure 1(b). The effects of protective netting and whitefly insecticide vector population |
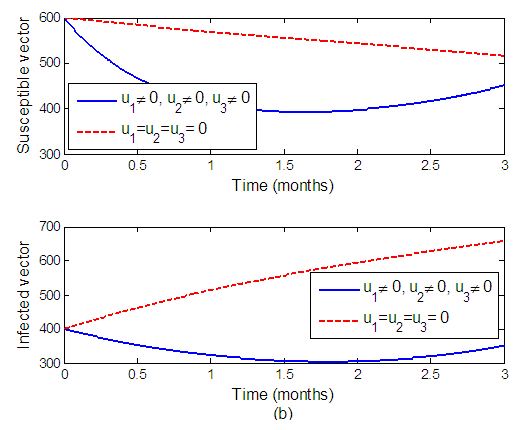
Strategy B: Combination of protective netting and removal of infected tomato plantsWe can observe from Figure 2 when  and
and  are applied to the system and
  is set to zero. The number of susceptible tomatoes increase while infected tomatoes decrease as a result, reducing the transmission of the virus to another plant. Figure 2(b) shows that, when the control is applied, the infected vector decreases.
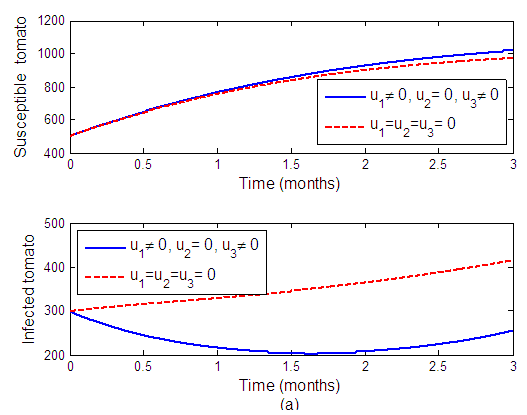 | Figure 2(a). The effects of protective netting and removal of infected tomato plants on tomato plant population |
 | Figure 2(b). The effects of protective netting and removal of infected tomato plants on vector population |
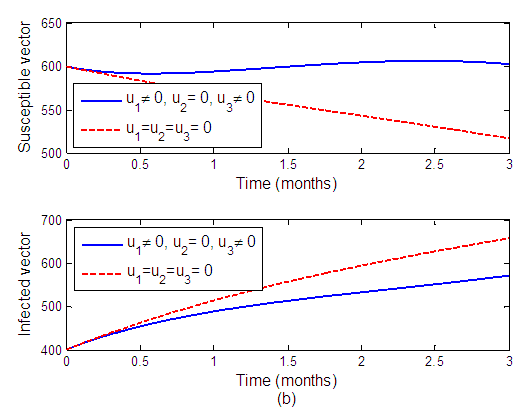
Strategy C: Combination of insecticide and removal of infected tomato plantsThe results show that the use of insecticide and removal of infected tomato plants in the system will reduce the spread of the disease. We can observe this from Figure 3(a) where the infected tomato decreases because of removing the infected plants; and infected vector decreases by increasing insecticides to the system. Moreover, the combination of strategies and
and give good results to optimize the objective function (J).
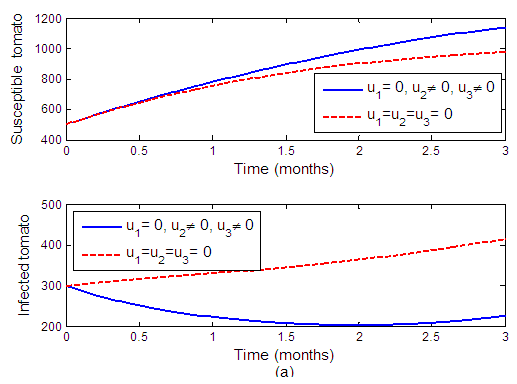 | Figure 3(a). The effects of insecticide and removal of infected tomato plants on tomato population |
 | Figure 3(b). The effects of insecticide and removal of infected tomato plants on vector population |
Strategy D: Combination of insecticide, protective netting and removal of infected tomato plantsThe results show that the use of insecticide, protective netting and removal of infected tomato plants in the system will reduce the spread of the disease. We can observe this tendency from Figure 4(a), which displays that the infected tomato decreases by intensifying the removal of the infected plants and infected vector decreases by strengthening insecticides application and protective netting to the system. Moreover, Figure 4(b) shows that when the control is applied, the infected vector decreases. The combination of strategies ,
,  and
and  give the best results to optimize the objective function (J).
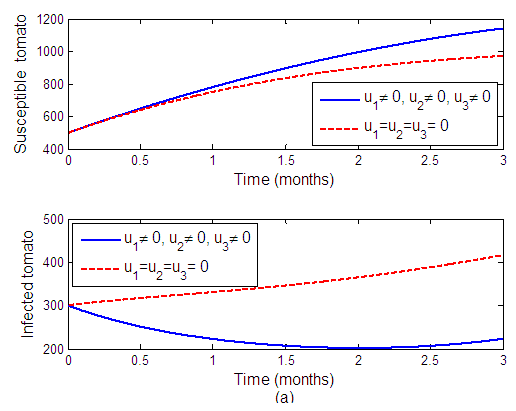 | Figure 4(a). The effects of insecticide, protective netting and removal of infected tomato plants on tomato population |
 | Figure 4(b). The effects of insecticide, protective netting and removal of infected tomato plants on vector population |
4. Cost-effective Analysis
The cost effectiveness analysis helps to show the economic benefit of each control measure. It is used to make comparisons between the relative costs and outcomes of different strategies. In making decision on which intervention to implement in limited resources, the economic evaluation of tomato yellow curl leaf disease is carried out to find the most cost effective strategy. In this study, the cost effectiveness is thoroughly analysed using incremental cost effectiveness ratio (ICER) which compares the differences between the costs and health outcomes of the two competing intervention strategies. Each intervention is compared with the next less effective alternative [19]. The averted plant is computed by finding the difference between the total number of plants without control and the total number of plants with control. The total control cost is evaluated as: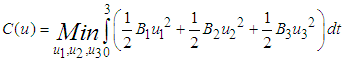 The total control costs
  ,
,  and
and  (where
  for
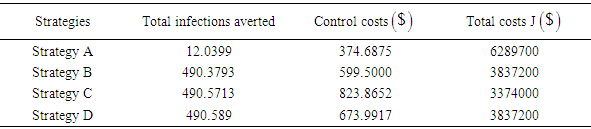
for  ) are relative cost weight for each control measure. The numerical output for the control strategies are ranked in increasing order of effectiveness in form of infection averted as shown in Table 2.
Table 2. Control strategies in order of increasing averted
 |
| |
|
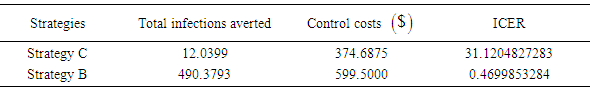
We calculate and compare the ICER for strategy C and B as shown in Table 3:Table 3. Total infection averted, total cost and ICER
 |
| |
|
The ICER is calculated as follows: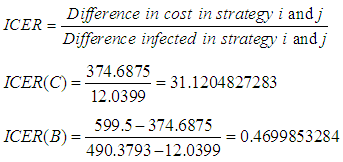 Table 3 presents the comparison between strategies C and B shows a cost savings of 0.4699853284 for strategy B over strategy C. Similarly, the high ICER for strategy C indicates that strategy C is costlier and less effective than strategy B. Therefore, strategy C is excluded from the set of alternatives so it does not consume limited resources. The strategy B is now compared with D as presented in Table 4.
Table 4. Total infection averted, total cost and ICER
 |
| |
|
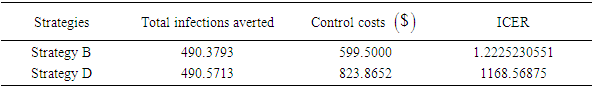
The ICER is calculated as follows: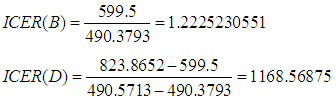 The comparison between strategies B and D shows a cost savings of 1.2225230551 for strategy B over strategy D. Similarly, the high ICER for strategy D indicates that strategy D is more costly and less effective than strategy B. Therefore, strategy D is excluded from the set of alternatives because it does not consume limited resources. The next comparison between the strategy B and A is presented in Table 5.
Table 5. Total infection averted, total cost and ICER
 |
| |
|
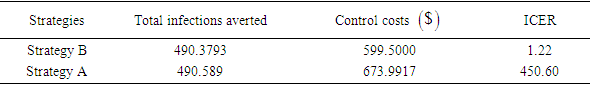
The ICER is calculated as follows: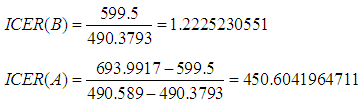 The comparison between strategies B and A, shown in Table 5 shows, the cost savings of 1.22 for strategy B over strategy A. The lower ICER for strategy B indicates that strategy B is strongly dominated. That is, strategy A is costlier and less effective than strategy B. Strategy A has to be excluded from the set of alternatives since it consumes limited resources. From the result, we conclude that strategy B (the control variable based on protective netting and removal of infected tomato plants) has the least ICER and therefore, is the more cost-effective strategy.
5. Conclusions
In this paper, deterministic model for the transmission of the tomato yellow leaf curl disease was formulated and three control strategies have been investigated. The cost effectiveness analysis was also a focal point of concentration to combat the disease in tomato plants. The Pontryagin’s maximum principle was used in deriving and analysing the conditions for optimal control of the tomato yellow leaf curl disease with control strategies such as protective netting  , the insecticide control
  and removal of the infected plant
  . The numerical analysis shows that each strategy has potential to control the transmission of the disease. Whenever control is applied, numerical results show that susceptible tomato increases while infected tomato decreases. The significant difference is also observed in susceptible and infected vector, when the control is applied, infected vector decreases as well as susceptible vector decreases. Cost effectiveness analysis indicates that the use of protective netting and removal of the infected plant is the cost effective optimal control strategy and is sufficient to combat the epidemic of tomato disease with limited resources.
References
| [1] | AL-MUSA A. Incidence,economic importance and control of tomato yellow leaf curl in Jordan. Plant Dis. 1982;66(7):561–3. |
| [2] | Czosnek H, Laterrot H. A worldwide survey of tomato yellow leaf curl viruses. Arch,Virol. 1997;142:1391–406. |
| [3] | Akad F, Eybishtz A, Edelbaum D, Gorovits R, Dar-Issa O, Iraki N, et al. Making a friend from a foe: Expressing a GroEL gene from the whitefly Bemisia tabaci in the phloem of tomato plants confers resistance to tomato yellow leaf curl virus. Arch Virol. 2007;152(7):1323–39. |
| [4] | Jones, C.M., K. Gorman, I. Denholm and MSW. High through put allelic discrimination of B and Q biotypes of the whitefly, Bemisia tabaci, using TaqMan allele-selective PCR. Pest Manag Sci. 2008;64:12–15. |
| [5] | Glick E, Levy Y, Gafni Y, Dagan B, Mina T. The Viral Etiology of Tomato Yellow Leaf Curl Disease – A Review. 2009;45(3):81–97. |
| [6] | Kashina BD, Mabagala RB, Mpunami A. Tomato Yellow Leaf Curl Begomovirus Disease in Tanzania: Status and Strategies for Sustainable Management. J Sustain Agric [Internet]. 2003;22(2):23–41. Available from: http://www.tandfonline.com/doi/abs/10.1300/J064v22n02_03. |
| [7] | Mehta, P.; Wyman, J.A.; Nakhla, M.K.; Maxwell DP. Transmission of tomato yellow leaf curl geminivirus by Bemisia tabaci. J Econ Entolomogy . 1994;87:1291–7. |
| [8] | Butter, N.S. & Rataul HS. The virus vector relationship of the tomato leaf curl virus (TLCV) and its vector, Bemisia tabaci (Hemiptera: aleyrodidae). Phytoparasitica. 1977;5:173–86. |
| [9] | Cohen, S. & Nitzany FE. Transmission and host range of Tomato yellow leaf curl virus. Phytopathology. 1966;56:1127–1131. |
| [10] | Polston, J.E.; Bois, D.; Serra, C.A.; Conceptíon S. First report of a tomato yellow leaf curllike geminivirus in the western hemisphere. Plant Dis. 1994;78:831. |
| [11] | Palumbo JC, Horowitz AR, Prabhaker N. Insecticidal control and resistance management for Bemisia tabaci. Crop Prot. 2001;20(9):739–65. |
| [12] | Poston, J.E.; Anderson PK. “The Emergency of Whitefly-Transmitted Geminiviruses in Tomato in the Western Hemisphere”. Plant Dis. 1997;12(81):1358. |
| [13] | M.J. Sabuka RK and TK. A dynamical model for epidemic outbursts by begomovirus population clusters. Ecol Modell. 2015;297:60–8. |
| [14] | Leung, B., Lodge, D.M., Finnoff, D., Shogren, J.F., Lewis, M.A & Lamberti G. An ounce of prevention or a pound of cure:bioeconomic risk analysis of invasive species. Proc R Soc Lond B. 2002;269:2407–13. |
| [15] | Epanchin-Niell, R. S., Hastings, A. Controlling established invaders: Integrating economics and spread dynamics to determine optimal management. Ecol Lett. 2010;13:528–541. |
| [16] | Sethi, S. P. & Thompson GL. Optimal control theory: applications to management science and economics. London, UK: Kluwer Academic Publishers; 2000. |
| [17] | Huang Y, Zhang B, Sun S, Xing G, Wang F. AP2 / ERF Transcription Factors Involved in Response to Tomato Yellow Leaf Curly Virus in Tomato. 2016;1–15. |
| [18] | M. J. Jeger, J.Holt, F.Vandenbosch and L. V. Madden. Epidemiology of insect-transmitted plant viruses: modelling disease dynamics and control interventions. Physiol Entomol. 2004;29:291–304. |
| [19] | S. Lenhart and J.T. Workman. Optimal control applied to biologicalmodels. CRC Mathematical and Computational Biology Series; 2007. |
| [20] | Maruthi MN, Czosnek H, Vidavski F, Tarba S. Comparison of resistance to Tomato leaf curl virus (India) and Tomato yellow leaf curl virus (Israel) among Lycopersicon wild species , breeding lines and hybrids. 2003;1–11. |
| [21] | J. Holt JC and VM. Identifying control strategies for tomato leaf curl virus disease using an epidemiological model. J Appl Ecol. 1999;36:625–33. |
| [22] | Okosun K., Makinde OD, Takaidza I. Impact of optimal control on the treatment of HIV / AIDS and screening of unaware infectives. Appl Math Model. 2013;37(6):3802–20. |
| [23] | Sabuka, M.J., Rishee, K., Tuomo, K. A dynamical model for epidemic outbursts by begomovirus population, J. Ecological Modelling, 2015; 297, 60-68. |

 Abstract
 Reference
 Full-Text PDF
 Full-text HTML