-
Paper Information
- Paper Submission
-
Journal Information
- About This Journal
- Editorial Board
- Current Issue
- Archive
- Author Guidelines
- Contact Us
Applied Mathematics
p-ISSN: 2163-1409 e-ISSN: 2163-1425
2017; 7(2): 23-31
doi:10.5923/j.am.20170702.02

Mathematical Model of the Spread and Control of Ebola Virus Disease
 Abstract
 Reference
 Full-Text PDF
 Full-text HTML
1Department of Mathematics, University of Abuja, Abuja, Nigeria
2Mathematics Programme, National Mathematical Center, Abuja, Nigeria
Correspondence to: Durojaye M. O., Department of Mathematics, University of Abuja, Abuja, Nigeria.
| Email: |  |
Copyright © 2017 Scientific & Academic Publishing. All Rights Reserved.
This work is licensed under the Creative Commons Attribution International License (CC BY).
http://creativecommons.org/licenses/by/4.0/

This paper analyses the transmission dynamics of Ebola Virus Disease using the modified SEIR model which is a system of ordinary differential equation. We study the SEIR model with vaccination to see the effect of vaccination on both the spread and control of the disease. The numerical analysis is done using MATLAB ode 45 which uses Runge Kutta method of fourth order. Our study reveals that vaccination is a very efficient factor in reducing the number of infected individuals in a short period of time and increasing the number of recovered individuals. Our analysis made use of data from the 2014 Ebola outbreak in Liberia and Sierra Leone provided by the World Health Organization
Keywords: Ebola Virus Disease, Mathematical Modelling, Vaccination
Cite this paper: Durojaye M. O., Ajie I. J., Mathematical Model of the Spread and Control of Ebola Virus Disease, Applied Mathematics, Vol. 7 No. 2, 2017, pp. 23-31. doi: 10.5923/j.am.20170702.02.
Article Outline
1. Introduction
- Ebola virus disease (EVD); also known as Ebola hemorrhagic fever, (or EHF), is a viral hemorrhagic fever of humans and other primates caused by Ebola viruses. Ebola is a rare and deadly disease caused by infection with one of the Ebola virus species. According World Health Organisation, Ebola is caused by infection with a virus of the family Filoviridae, genus Ebolavirus. There are five identified Ebola virus species, four of which are known to cause disease in humans: Ebola virus (Zaire ebolavirus); Sudan virus (Sudan ebolavirus); Taï Forest virus (Taï Forest ebolavirus, formerly Côte d’Ivoire ebolavirus); and Bundibugyo virus (Bundibugyo ebolavirus). The fifth, Reston virus (Reston ebolavirus), has caused disease in nonhuman primates, but not in humans [15]. Signs and symptoms typically start between two days and three weeks after contracting the virus with a fever, sore throat, muscular pain, and headaches. Then, vomiting, diarrhea and rash usually follow, along with decreased function of the liver and kidneys. At this time some people begin to bleed both internally and externally. The disease has a high risk of death, killing between 25 and 90 percent of those infected, with an average of about 50 percent. This is often due to low blood pressure from fluid loss, and typically follows six to sixteen days after symptoms appear. People get Ebola through direct contact (through broken skin or mucous membranes in, for example, the eyes, nose, or mouth) withŸ blood or body fluids (including but not limited to urine, saliva, sweat, feces, vomit, breast milk, and semen) of a person who is sick with or has died from Ebola,Ÿ objects (like needles and syringes) that have been contaminated with body fluids from a person who is sick with Ebola or the body of a person who has died from Ebola,Ÿ infected fruit bats or primates (apes and monkeys), andŸ possibly from contact with semen from a man who has recovered from Ebola (for example, by having oral, vaginal, or anal sex) [15].
2. Mathematical Model of Ebola Virus Transmission
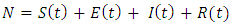
- Mathematical modelling of infectious diseases is very useful in investigating human infectious diseases, such as Ebola virus. This helps in the understanding of the disease dynamics and gives useful predictions about the potential transmission of the disease and the effectiveness of possible control measures, which can provide helpful information for public health policy makers [2].The most commonly implemented models in epidemiology are the SIR and SEIR models. The SIR model consists of three compartments: Susceptible individuals S, Infectious individuals I, and Recovered individuals R. The SEIR model takes into consideration that, in many infectious diseases there is an exposed period after the transmission of the infection from susceptible to potentially infective members but before these potential infective can transmit infection. This is why an extra compartment is introduced, which is the exposed class E. hence the SEIR model is a gives a generalization of the basic SIR model. When analyzing a new outbreak, the researchers usually start with the SIR and SEIR models to fit the available outbreak data, obtaining estimates for the parameters of the model [8]. Many researchers have employed both the SIR and the SEIR models in the modelling of the Ebola outbreak [1, 2, 4] This paper also uses the SEIR model to analyse the spread and control of the disease and adopt vaccination as a control strategy. We look at the spread of the disease with different rates of vaccination. Having discovered a minimum rate of vaccination that will control the spread, we also look at the effect of vaccination on the rate of the susceptible individuals, S, the effect on the rate of the Infectious individuals I, on the exposed individuals, E and on the rate of the Recovered individuals R.We describe the transmission of Ebola virus by a SEIR model, proposed by Rachah and Torres (2016) where the population is divided into four groups such that the susceptible individuals at time t, denoted by S(t), enter the exposed class E(t) before they become infectious. The nfectious class at time t, denoted by I(t), represents the individuals that are infected with the disease and are suffering the symptoms of Ebola, then the recovered class, which at time t is denoted by R(t). The total population assumed constant during the short period of time under study, is given by
 | (1) |
 | (2) |
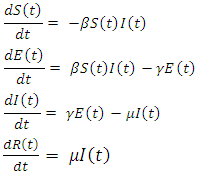
 is the rate of transmission,
  is the rate of infection and
  the rate of recovery.This model is very simple and assumes that the population is constant in the period of time under study so that the sum of the right hand side of the equations of system (2) is zero.
 3. Related Work
- Many researchers have worked on the mathematical modelling of Ebola Virus Disease. Chowell G and Nishiura H [4] in their work showed that mathematical modeling offers useful insights into the risk of a major epidemic of EVD and the assessment of the impact of basic public health measures on disease spread. They also discussed the critical need to collect detailed epidemiological data in real-time during the course of an ongoing epidemic, carry out further studies to estimate the effectiveness of interventions the epidemic, and develop large-scale modeling studies to study the spread and control of viral hemorrhagic fevers in the context of the highly heterogeneous economic reality of African countries.Amenaghawon C, Osemwinyen and Diakhaby (2015) in their study simulated the transmission dynamics of Ebola Zaire virus using the models, namely, a modified SIR model with the understanding that the recovered can become infected again and the infected die at a certain rate and a quarantine model, which ascertained the effects of quarantining the infected. They also formulated, an appropriate system of Ordinary Differential Equations (ODE) for the transmission and used the method of linearized stability to solve the equations. Their stability analysis of both models indicated that, the Disease Free Equilibrium (DFE) states of the models were unstable if they exist. These equilibria states showed that the disease can easily be triggered off, so there is need to be constantly alert and effective preventive measures put in place against its spread. In addition, numerical experiments were carried out with the models' parameters assigned specific hypothetical values and graphs were plotted to investigate the effect of these parameters on the transmission of the disease. Their results showed that, with the nature of Ebola Zaire virus, uncontrolled transmittable contacts between the infected and the susceptible can lead to a very serious outbreak with high mortality rate, since no immunity and drugs at moment. However, with effective quarantining structures put in place such situation can be better managed and outbreak controlled.Rachah and Torres in 2015 [8], gave a comparison between two different mathematical models used in the description of the Ebola virus propagation in West Africa. They investigated the two models in order to improve the prediction and the control of the propagation of the virus and particularly studied the case when the two models generate similar results.Nishiura H, and Chowell G [12], estimated the effective reproduction number of Ebola virus estimated using country-specific data reported from Guinea, Liberia and Sierra Leone to the World Health Organization from March to August, 2014. They observed that the reproduction number for the three countries lies consistently above 1.0 since June 2014. Country-specific reproduction number for Liberia and Sierra Leone was found to lie between 1.0 and 2.0.
 indicate that control could be attained by preventing over half of the secondary transmissions per primary case.Rachah and Torres [7] in their work, presented a mathematical description of the spread of Ebola virus based on the SEIR (Susceptible–Exposed–Infective–Recovered) model and optimal strategies for Ebola control. In order to control the propagation of the virus and to predict the impact of vaccine programmes, they investigated several strategies of optimal control of the spread of Ebola using parameters estimated from statistical data based on the WHO report of the 2014 Ebola outbreak.Paul D et al [11], in their paper developed a deterministic SEIR model for the 2014 Ebola epidemic occurring in the West African nations of Guinea, Liberia, and Sierra Leone. The model describes the dynamical interaction of susceptible and infected populations, while accounting for the effects of hospitalization and the spread of disease through interactions with deceased, but infectious, individuals. Using data from the World Health Organization (WHO), parameters within the model were fit to recent parameters within the model and recent estimates of infected and deceased cases from each nation. The model was then analyzed using the parameter values obtained. Finally, several metrics were proposed to determine which of these nations is in greatest need of additional resources to combat the spread of infection. These include local and global sensitivity metrics of both the infected population and the basic reproduction number with respect to rates of hospitalization and proper burial.
4. The SEIR Model of Ebola virus Transmission with Vaccination
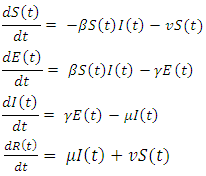
- One of the control measures adopted to limit the spread of the virus is vaccination, [16, 17, 20], we therefore introduce vaccination into the model and present the SEIR model with vaccination as
 | (3) |
 the rate of transmission,
 the rate of infection,
 the rate of recovery and
  the rate of vaccination.
5. Numerical Simulation
- We now simulate the SEIR model with vaccination in order to study the transmission of the disease in case of vaccination. We use the Matlab differential equation solver ode45. The routine uses a variable step Runge–Kutta 4th/5th-order method to solve the differential equations numerically [13]. We adopt the data used by Rachah and Torres in their numerical study of the propagation of the virus by the SEIR model. Motivated by the data of WHO, they considered the SEIR model with a transmission rate
 an infectious rate
  a recovered rate
 and initial values of susceptible,
  exposed,
  infected,
  and recovered
  We simulate our SEIR model with vaccination using the same parameters for different rates of vaccination.The results are shown in the following figures.
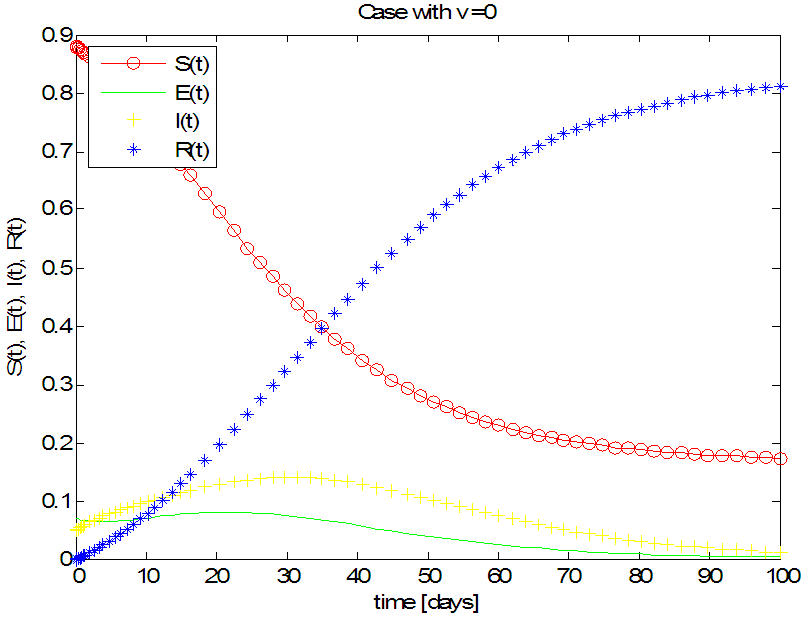 | Figure 1. Solution of the SEIR model with  exposed, exposed,  and rate of vaccination v=0 and rate of vaccination v=0 |
 | Figure 2. Solution of the SEIR model with  exposed, exposed,  and rate of vaccination v=0.01 and rate of vaccination v=0.01 |
 | Figure 3. Solution of the SEIR model with  exposed, exposed,  and rate of vaccination v=0005 and rate of vaccination v=0005 |
 | Figure 4. Solution of the SEIR model with  exposed, exposed,  and rate of vaccination v=0.01 and rate of vaccination v=0.01 |
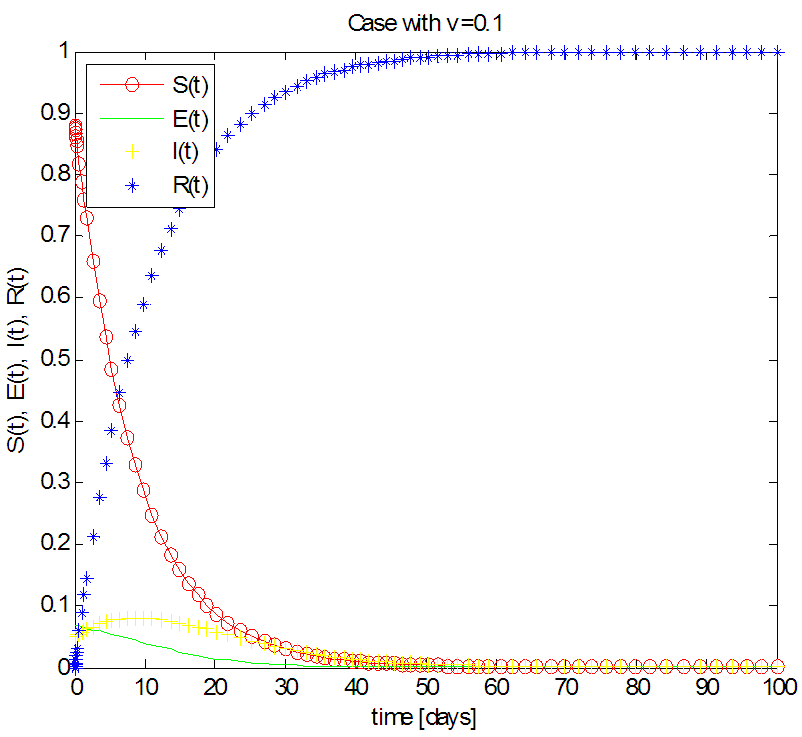 | Figure 5. Solution of the SEIR model with  exposed, exposed,  and rate of vaccination v=0.1 and rate of vaccination v=0.1 |
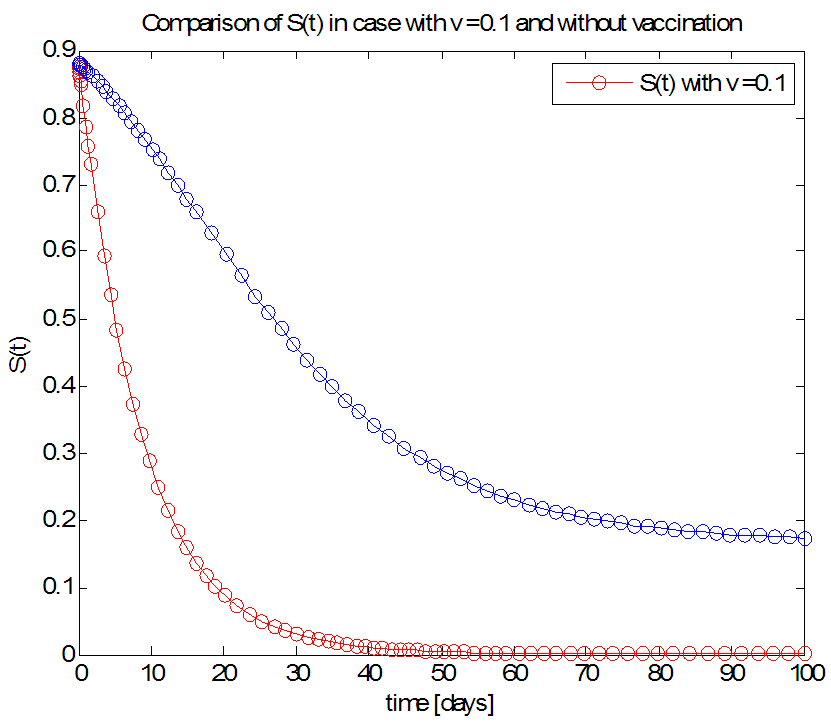 | Figure 6. The rate of susceptible individuals  with and without vaccination with and without vaccination |
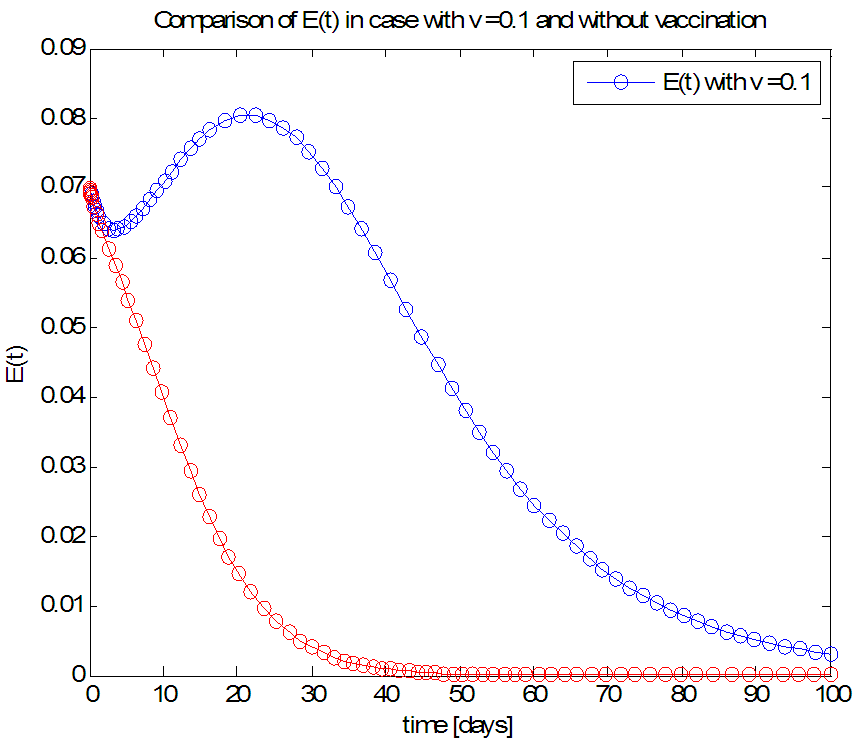 | Figure 7. The rate of exposed individuals  with and without vaccination with and without vaccination |
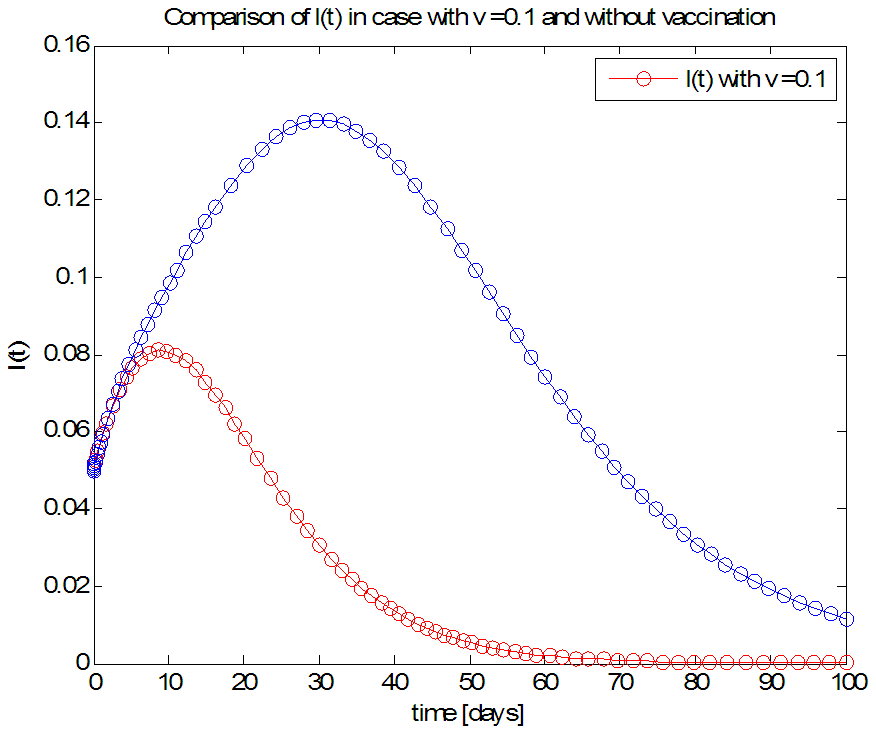 | Figure 8. The rate of infected individuals  with and without vaccination with and without vaccination |
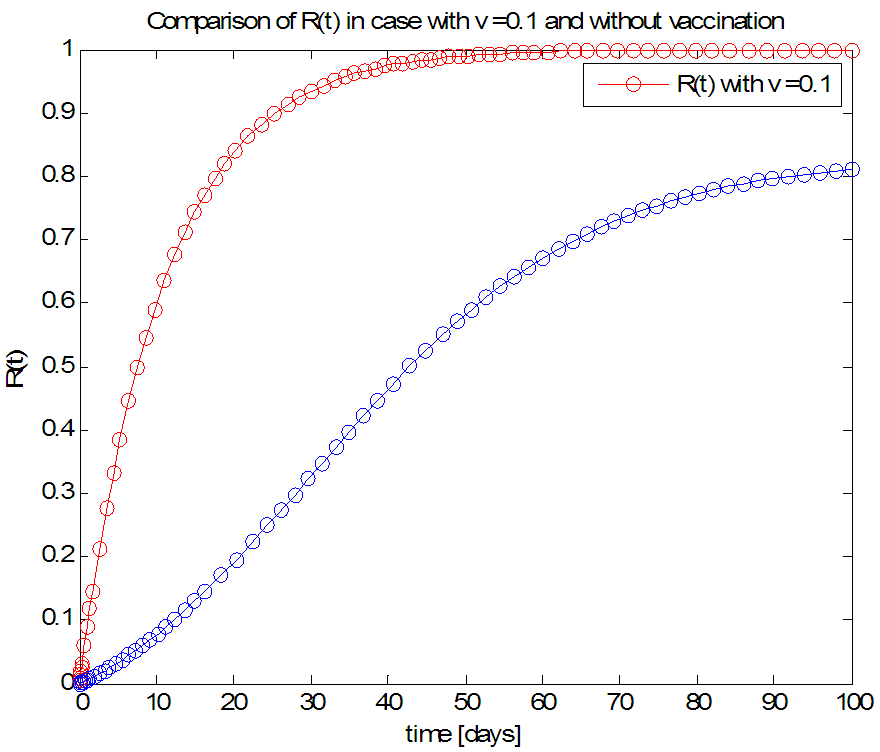 | Figure 9. The rate of recovered individuals  with and without Vaccination with and without Vaccination |
6. Observations
- Figure 1 shows that, without vaccination,Rate of susceptible individuals
 in about 100 daysRate of exposed individuals
  in about 90 daysRate of infected individuals
  in about 100 daysRate of recovered individuals
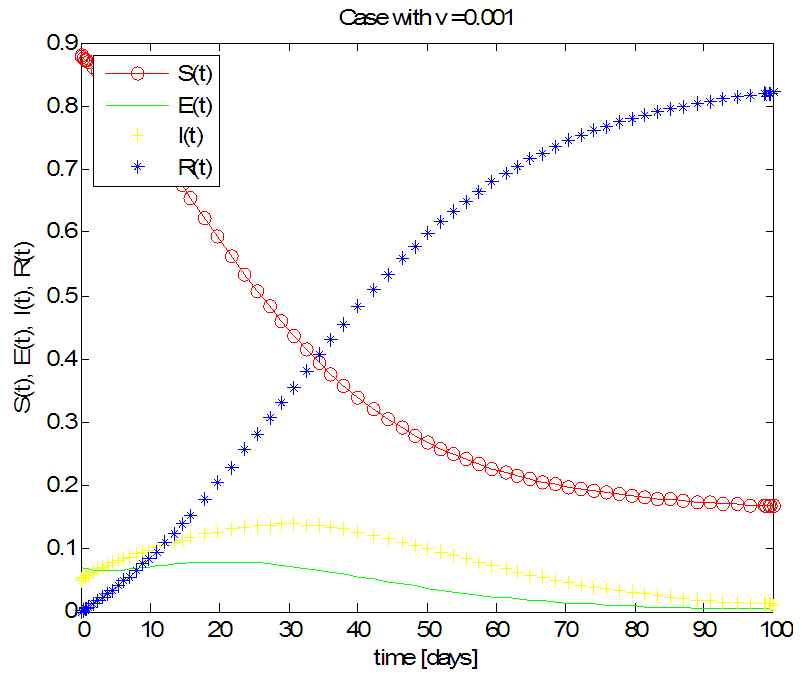
  in about 100 daysFigure 2 shows that with vaccination rate v=0.001,Rate of susceptible individuals
  in about 100 daysRate of exposed individuals
  in about 100 daysRate of infected individuals
  in about 100 days Rate of recovered individuals
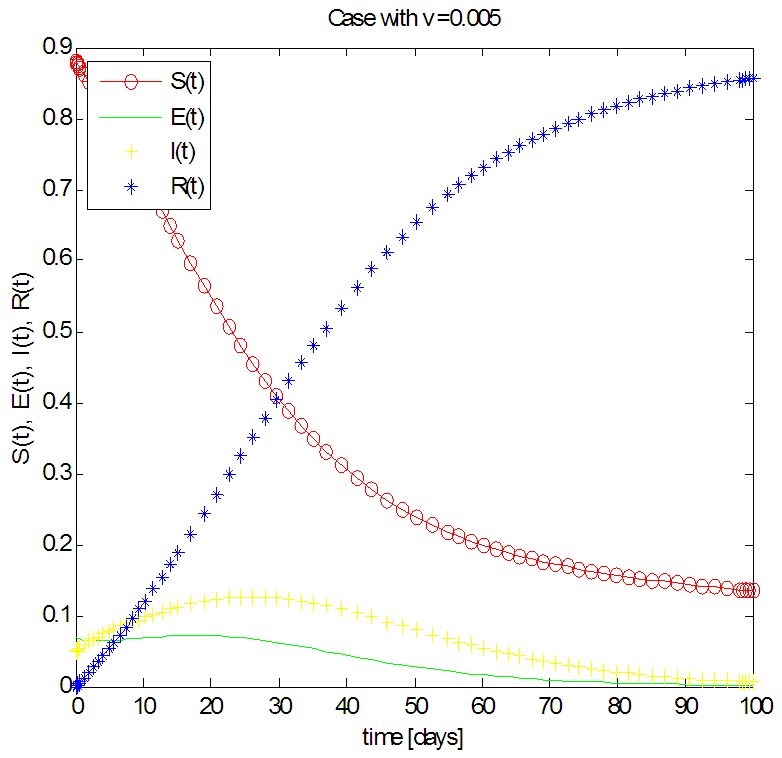
  in about 100 daysFigure 3 shows that with vaccination rate v=0.005,Rate of susceptible individuals
  in about 100 daysRate of exposed individuals
  in about 80 daysRate of infected individuals
  in about 100 days Rate of recovered individuals
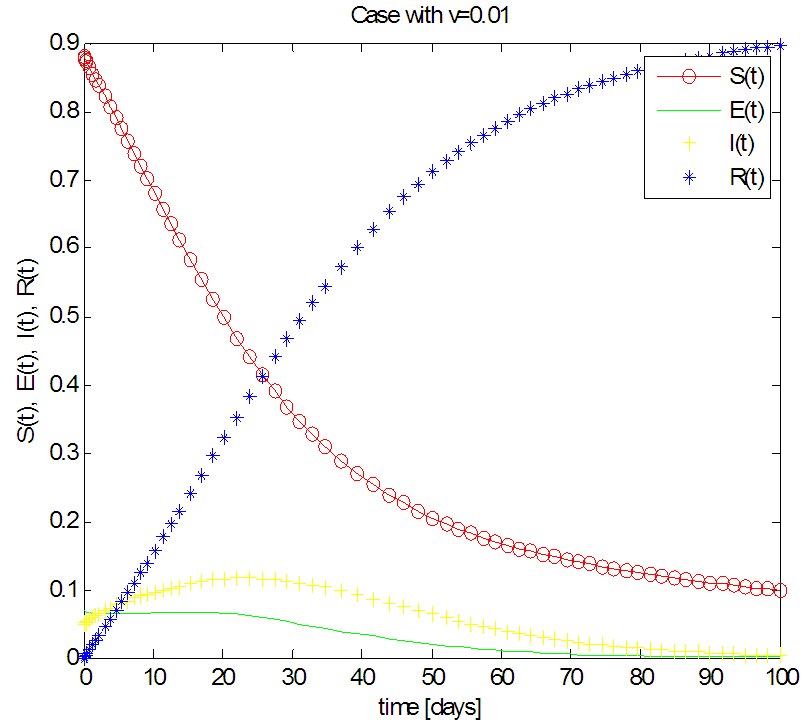
  in about 100 daysFigure 4 shows that with vaccination rate v=0.01,Rate of susceptible individuals
  in about 100 daysRate of exposed individuals
  in about 70 daysRate of infected individuals
  in about 80 days Rate of recovered individuals
  in about 100 daysFigure 5 shows that with vaccination rate v=0.1,Rate of susceptible individuals
  in about 40 daysRate of exposed individuals
  in about 30 daysRate of infected individuals
  in about 40 days Rate of recovered individuals
  in about 50 days
7. Conclusions
- We have investigated the spread and control of ebola virus disease using the SEIR model with vaccination as a control measure. The observations given above reveals that with a vaccination rate of o.1 the spread of this viral disease can be brought under control within fifty (50) days. We therefore recommend a vaccination rate of 0.1 as an effective control measure for the spread of the ebola disease.Adopting v=0.1 as an effective vaccination rate, we also investigated the effect of this vaccination rate on each of the classes of the equation and the results are presented in figures 6, 7, 8 and 9.