D. Asamoah Owusu, S. K. Appiah, A. Y. Omari-Sasu, G. S. Owusu
Department of Mathematics, College of Science, Kwame Nkrumah University of Science and Technology, Kumasi, Ghana
Correspondence to: D. Asamoah Owusu, Department of Mathematics, College of Science, Kwame Nkrumah University of Science and Technology, Kumasi, Ghana.
| Email: |  |
Copyright © 2016 Scientific & Academic Publishing. All Rights Reserved.
This work is licensed under the Creative Commons Attribution International License (CC BY).
http://creativecommons.org/licenses/by/4.0/

Abstract
Investors all over the world and most especially pension fund managers will all the time try to reduce risk and achieve higher returns as well. The managing of an investment portfolio requires careful selection of assets to invest in, as well as managing the proportions of funds to be channeled into a particular asset. The rationale behind this study is to explore the useful application of the Markowitz technique for optimal asset allocation of a national pension fund scheme in Ghana. The data were collected on the various investments undertaken by pension fund over the period 2004–2013. The Markowitz model allowed resources to be allocated to various investment opportunities, taking into account the associated risk. The results showed that should the pension fund be interested in minimizing the portfolio expected risk at a given return of 20.1% from their pool of investments, then they should invest 53.65% in student loan, 19.56% in short-term investment, 19.55% in properties, 5.87% in investment available for sale and 1.37% in investment held to maturity. On the other hand, if the fund wants to maximize the portfolio expected returns at a given risk level of 3.6% being the lowest risk for all the assets, then 28.85% of the total investment portfolio is to be channelled to one-year Treasury bill, 26.76% to student loans, 24.19% to short-term investments, 10.3% to properties, 9.22% to investment available for sale and 0.96% to loans and receivables. In this way the pension fund’s investments can be managed as a portfolio, combining risk and return to maximize benefits and help managers to choose the best option for informed decision-making.
Keywords:
Pension fund, Markowitz model, Investment risk and expected Returns, Optimal allocation
Cite this paper: D. Asamoah Owusu, S. K. Appiah, A. Y. Omari-Sasu, G. S. Owusu, Pension Fund Asset Allocation under the Markowitz Model: A Case of the National Pension Scheme in Ghana, Applied Mathematics, Vol. 6 No. 4, 2016, pp. 86-91. doi: 10.5923/j.am.20160604.04.
1. Introduction
A lot of investment strategies have over the years been employed to properly allocate the assets of individuals and institutions such as pension funds. The most sought for by these participants is to effectively manage the assets of the funds and to be able to hedge against risk by meeting expected benefit payment obligations. Due to the risk of losing their investments as a result of investing in a particular asset, many participants have become aware of the need to diversify (Franzen, 2010; Bagliano et al., 2009; Economou et al., 2013). To be able to make adequate funds available to meet future obligations within the short-term and long-term, pension funds invest in capital markets. Funds of pension schemes are usually the main background for long-term domestic capital. Funds are initially routed through risk free investments such as treasury bills. Upon maturity, some are channelled to other investment areas which turn to generate good returns than pension fund assets, notwithstanding higher the expected risk to be involved (Inderst and Stewart, 2014; Vives, 1999). In many developed countries there has been significant increase in pension funds investment in hedging. These pension funds often overtake the stock market in terms of performance by significant levels. Despite the variability in estimations, as high as 20% of pension funds in these countries are channelled to hedge funds for investment while others can go as high as 40%. Some pension funds have also sought to invest in socially beneficial investments in energy and affordable housing for the poor. These strategies tend to increase financial returns and social amenities for the communities. Recent new direction in infrastructure for better returns is increasingly exhibiting its potential to match other long-term investments, which serves as a source of diversity in pension fund investments (Inderst, 2009; Inderst and Stewart, 2014). Investment strategies include the maximization of returns for a specified risk and also minimization of risk for a specified return. However, in most developing countries including Ghana, there is little information relating to the level of risk pension fund assets and what proportion to invest in these assets to be able to spread the risks for some expected returns. The lack of information and understanding of such level of risks associated with the investment opportunities often lead to financial losses. This poses serious challenge to pension fund managers in terms of efficient allocation of resources. Thus, fund managers or investors are often confronted with the problem of how to quantify the risk that will also lead to higher returns on their investments. However, higher returns may lead to higher risk. Therefore, to be able to maximize returns on investments, how much risk is the investor prepared to take? Such is the very crucial decision-making that adversely affects fund managers or investors when they are unable to quantify and spread the risk over sensitive investment opportunities. This is one major problem characterised with pension fund and insurance schemes. This study provides a brief review the Markowitz analysis (Markowitz, 1952, 1959), which has revolutionized the modern portfolio theory and then applies it to the various investment opportunities undertaken by a national pension fund scheme in Ghana. The rest of the section presents the related empirical review of the Markowitz modelling approach to pension fund investment portfolios. The pioneering work of Markowitz (1952, 1959) provides the basis for the modern theory of portfolio choices through diversification. Maximizing expected returns while minimizing the risk of a portfolio is the rationale behind the Markowitz theory. According to this modelling, the investor’s utility is usually a function of the first two moments, the mean and variance of returns (Mensah et al. (2013). Thus, Markowitz’s study proposes that in selecting investments, the investor should consider the expected and variability of return on the portfolio together so that portfolios that minimized variance for a given return are proved to the most worthwhile venture. The full formulation and solution of the mean-variance (M-V) model is found in Markowitz (1956) while Mangram (2013) gives extensive discussion on the framework and key concepts, including expected return, measures of risk and volatility as well diversification. Hung and Yang (2010) postulates a generalised Markowitz investment model accounting for skewness and kurtosis. Other studies have been conducted on the optimal allocation of pension assets. Driessen and Leaven (2005) used the mean-variance model to establish that benefits are high for countries with significant risks. They used monthly data spanning over a period of 17 years for a number of both developed and developing countries. It was established that the addition of international assets increases risk but reduces upon imposition of short sale constraints. In a similar study, Pfau (2009) also found international diversification could dramatically help to create sustainability for Pakistan’s main public pension fund available to private workers.Stock market is a very import component of capital market where share of various companies including pension fund schemes are traded. Mensah et al. (2013) applied the classical Markowitz method of optimization model to investigate the allocation of assets on the Ghana Stock Exchange, using stock prices data. They established a reward for risk on the Stock Exchange although the Markowitz’s model strategy did not exceed the buy and hold strategy of the market index. Antolin (2008) presents a simple life-cycle model, calibrating quantitative predictions on optimal portfolio allocation for pension funds. It then proposes a welfare-based metric to evaluate the pension funds’ performance. Bai et al. (2007) complements the theoretical work of the M-V theory by developing a new estimator to capture portfolio selection. They developed bootstrap estimators for the optimal return and its asset allocation, which proved that the estimates are more consistent with the parameters. The capital asset pricing model (CAPM), which provides a fundamental understanding of the determinants of asset prices is highlighted in Perold (2004) and Sharpe (1964). The CAPM is based on the concept that not all risks should affect asset prices. In particular, a risk can be diversified along with other portfolios without much risk. Bogentoft, et al. (2001) explored a new approach to modelling asset/liability management problems for pension funds using the conditional value at risk.
2. Research Methodology
2.1. Markowitz Mean-Variance (M-V) Model
The mathematical framework, developed by Markowitz (1952; 1959), has always been denoted as M-V model. The portfolio selection problems faced by many pension funds and other investors are solved by the M-V model. The M-V model uses mean returns as the expected return on portfolio and applies the variance as the risk measure of the portfolio. The M-V model considers a market where d different securities with prices  at the initial time
  are traded. The security prices at the final time
  are not feasible. Therefore they are modelled as non-negative random variable on a given probability space. The return of the securities is given by;
 | (1) |
where we are assuming that we know their means and covariances as given by (2) and (3) respectively: | (2) |
 | (3) |
An investor with an initial wealth  is also assumed to hold
  assets of investment
  with
with | (4) |
Then the portfolio vector is  , where
 | (5) |
which leads to the corresponding portfolio return (6):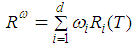 | (6) |
The components of the portfolio vector represent the fraction of wealth which are invested in the corresponding securities. The mean and the variance of the portfolio return are given by (7) and (8), respectively: 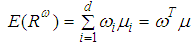 | (7) |
 | (8) |
where represents covariance between the assets.We further assume that neither short sale nor borrowing is allowed because the investor expects to maximize the return and to minimize the risk. Then the investment problem can be formulated as:
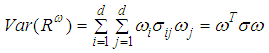
  | (9) |
 | (10) |
The Markowitz model indicates that with continuous addition to investment portfolio, the risk associated with such assets, as determined by the standard deviation or variance of total return, reduces. This framework of portfolio optimization also indicates that as assets are further complemented to the portfolio of investments, the risk associated with that specific portfolio declines constantly. The associated risk of the portfolio is measured by the standard deviation. The weighted average is used to represent the expected returns of the portfolio. The behaviour of investors and financial markets under the Markowitz model are based on assumptions including:1. Investors can determine the probability distribution for likelihood of returns during a period. 2. Investors are exposed to one-period utility functions where utility can be maximized within the context of diminishing marginal utility of wealth. 3. Investors uses the variability about the values of expected return to measure risk. 4. The means and variance of the returns for a period are of the only essence to investors. 5. Expected return and risk as used by investors are measured by the first two moments of the probability distribution of returns. 6. Returns are desirable but risks are avoidable.
2.2. Data on Pension Fund in Ghana
The Social Security and National Insurance Trust (SSNIT) is the Ghana’s largest pension fund scheme and also largest institutional investor in Ghana Stock Exchange (GSE). It has about 1.12 million active members with over 128,500 pensioners who receive monthly pension income (Kpessa, 2011; SSNIT, 2014). Membership contributions constitute about 33% of its total source of funds and sustainability of the scheme remains essentially on the various investments undertaken. The total investment portfolio of SSNIT increased by 30.14% from 3,972.68 million in 2012 to 5,170.13 million (in Ghana cedis) at the end of 2013 while real return on investments was 16.90% in 2013 compared to 10.67% in 2012 (SSNIT, 2013, 2014). SSNIT has over the years ventured in various investments based on segmented assets into the following portfolios on which data were collected for this study: • Investment in properties (IVP), which are long term investments and carried at market values determined periodically. They are not subject to depreciation. • Investment available for sale (IVS), relating to investment in listed and unlisted equities. • Investment held to maturity (IVM), relating government bonds and HFC mortgage bonds. • Loans and receivables (LR), represent advances to companies less related impairment allowance. • Student loans (SL), offered to students during their study at the tertiary education level. • Short-term investment (STI), in short term government securities.• Treasury bill (TB) for one year, a risk-free asset. The data on returns of these portfolio of assets were obtained from the financial statement report of the Trust for period spanning from 2003 to 2013. The analysis was performed following (1)–(8), using Matlab and Microsoft excel programming solver to generate results.
3. Results and Discussion
Returns of the risk-free asset (Treasury bill) investment was used to establish correlation between it and the other risky assets. The descriptive statistics of the data set and results of allocation of the pension fund assets from the maximization of the expected returns and minimization of the total risks are presented (see Tables 1–3) for discussion.
3.1. Descriptive Statistics
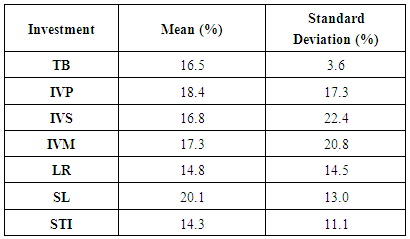
Table 1 shows the returns and risks associated with the different investment opportunities. The mean represents returns from each portfolio while the standard deviation measures the risk associated with each of the expected returns. Investment in student loan recorded the highest expected returns of 20.1% while short term investment has the lowest expected return of 14.2%. Despite the significant positive returns expected from student loan, its associated risk will also be low at 13.1%, compared with the other investments (except that of short term loan and risk-free assets with risk levels of 11% and 3.6%, respectively). This means that with higher expected returns, investment in student loan is expected to record lower risk. The one-year Treasury bill (risk-free) investment shows lower returns of 16.5%, compared with the student loan, property investment, investment to maturity and investment available for sale. This can be attributed to its lowest associated risk, which agrees with the finding of Mensah, et al, (2013) in a three-month Treasury bill investment. The highest risk of investment is in asset available for sale with relatively low returns of 16.8% while loans and receivables investment has very low returns with a risk of 14.5%. Table 1. Returns and risks associated with investments
 |
| |
|
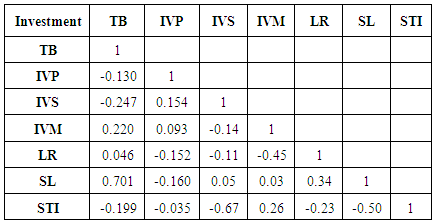
The pair-wise correlations among the investment assets are produced in Table 2. These are used to enhance the portfolio selections (Perold, 2004) for the pension fund under investigation. The risk-free asset (Treasury bill) investment correlates positively and strongly with investments in student loans and held to maturity with correlations of 70.1% and 22%, respectively. However, the other investments correlate negatively but relatively weaker with the risk-free asset investment. The investment available for sale recorded the highest negative correlation of 24.7%, followed by short-term investment and investment in properties of correlations of 19.9% and 13%, respectively. Table 2 also depicts significant relationships existing between other investments. The short-term investment has significant relationships with the other investments with a very strong negatives correlations of 67% and 50% with investments available for sale and student loans, respectively. Appreciable significant correlations can also be observed between investments held to maturity and loans and receivables (-0.45), and investments between student loans and loans and receivables (0.34). Table 2. Correlation matrix of the pension fund investments
 |
| |
|
3.2. Allocation of Pension Fund Assets
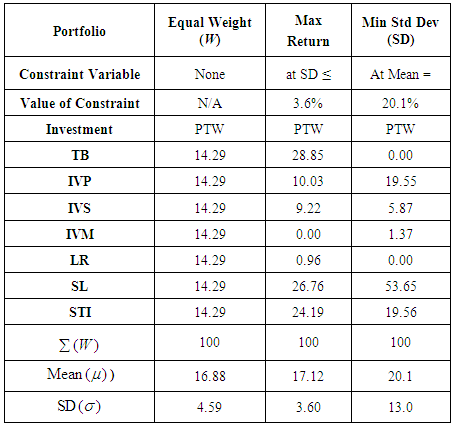
The various options available to the SSNIT’s pension fund in terms of which asset is to be invested in, given the various constraints are considered. The Markowitz portfolio optimization technique, as outlined in section 2.1, is applied to generate the portfolio diversification. However, portfolio allocation rests on market risk and return from the various assets as well as the correlation between these assets. The rational for asset optimization is to allocate weights to assets that ensures a minimum level of risk for good levels of expected returns. Our aim is to identify the combination of the investment opportunities that brings a minimal risk with various amount of returns expected. To achieve this, we apply two different constraints. The first is that we want to achieve the minimum risk (standard deviation) of 3.60% and its impact on the weights. Thus, a risk level equal to or less that 3.60%. Secondly, what happens to the weights if we want to maximize the expected return at 21.1%? In all, the weights applied to the various assets will not exceed 1 (or 100%). The study also looks at a situation when the pension fund expects equal expected returns. Table 3 below illustrates the various possible solutions for the optimization problems under the above three scenarios: equal expected returns, maximizing expected returns and minimizing the expected risk.Table 3. Optimal allocation of the pension fund assets
 |
| |
|
3.2.1. Equal Expected Returns
The results in Table 3 show that should the pension fund be interested in enjoying equal weights (expected returns) from all the investment assets, then the total portfolio return will be 16.88% with a risk level of 4.59%.3.2.
3.2.2. Maximizing Expected Returns
Should the pension fund be interested in maximizing return at a risk level of 3.60% (as indicated in Table 3), the following weights is to be applied to the various investments:• 28.85% in investment in the risk free rate, the one year Treasury bill;• 26.76% of the total investment into student loans; • 24.19% in short term investment;• 10.03% of its total investment portfolio into investment properties;• 0.96% in Loans and receivables• 9.22% into investment available for sale• 0% into investment held to maturity. With these weights applied the available investments, it can be realized that the total portfolio returns would increase to 17.12%, which is an improvement compared with the expected return of 16.88%, when equal weights are applied. The associated total portfolio risk of 3.60% (standard deviation) is also an improvement over that with equal weights risk of 4.59%. In this case, the pension fund enjoys higher returns with lower associated risk if the above weights are applied.
3.2.3. Minimizing Expected Risk
Lastly, where the pension fund is interested in minimizing the portfolio expected risk at a given return of 20.1% from their pool of investments, they should undertake the following investments: • invest 53.65% in students’ loan, • 19.56% in short term investment, • 19.55% in properties, • 5.87% in investment available for sale, • 1.37% in investment held to maturity, • 0% in treasury bills and loans & receivables. These investments will result in total portfolio risk of 13% which is higher than all the other scenarios. This is not surprising because, higher returns come with higher risk.
4. Conclusions
Risk management is crucial to pension funds and a risk measure can efficiently demonstrate the risk embedded in the financial products. The mean-variance model via the Markowitz optimization technique (Markowitz, 1952, 1959) has been explored and applied to the various investments portfolio of SSNIT, the largest pension fund in Ghana. The study aimed at establishing an optimal way of allocating the fund investment portfolios while looking at the risks associated with the investment opportunities. The results showed significant improvement in terms of efficient management of the pension fund in their resource allocation to the various investment opportunities. The individual risk assessment indicated a lowest risk for investment in Treasury bill for one-year as it records the lowest risk (3.6%). The highest expected returns (20.1%) was obtained for investment in student loans with an associated rick under 14%, like the short-term investments. The allocation of the pension fund assets was performed under three scenarios. Scenario 1 embarked on equal allocation of resources and resulted in expected portfolio return of 16.88% but with a portfolio risk of 4.59%. Scenario 2, maximizing returns at a risk level of 3.60%, gave expected portfolio returns of 17.12% and investing high proportions in one-year Treasury bills (28.85%), student loans (26.76%) and short-term investments (24.19%). Scenario 3, minimizing risk for a return of 20.1% produced portfolio risk of 13% and investing more than half of available funds in student loans (53.65%), and the rest virtually in investment in properties (19.55%) and short-term investments (19.56%). Scenario 2 is highly recommended in view of its relatively smallest portfolio risk. The study has demonstrated the useful application of Markowitz model to quantify the risks associated with the investment portfolios at the Ghana’s Social Security and National Insurance Trust. The findings will help guide this national pension scheme to effectively manage their resources to the various investment opportunities available to them.
References
| [1] | Antolin, P. (2008). Pension fund performance. QECD Working paper on insurance and private pensions, n.20. |
| [2] | Bagliano, F.C., Fugazza, C. and Nicodano, G. (2009). Pension funds, life-cycle asset allocation and performance evaluation. The QECD WP conference on performance of privately managed pensions funds, Mexico City, 2009. |
| [3] | Bai, Z., Liu, H. and Wong, W-K. (2007). Making Markowitz’s portfolio optimization theory practically useful. Berkley-NUS Risk management Institute (RMI). Working Paper No. 07/10. |
| [4] | Bogetoft, E, Romeijn, H.E. and Yryasev, S. (2001). Asset/liability management for pension funds usin CVaR constraint. The Journal of Risk Finance, 3(1): 57-71. |
| [5] | Driessen. J. and Leaven, L. (2005). International portfolio diversification benefits. Social Science Research Network, pages 200–215. |
| [6] | Economou, T., Haenni, G., Manola-Bonthond, E. (2013). A governance framework designed for dynamic asset allocation: The CERN pension fund model. The Journal of Investment Consulting, 14(1): |
| [7] | Franzen, D. (2010). Managing investment risk in defined pension funds. OECD Working Papers on Insurance and Private Pensions, No. 38, OECD publishing. doi: 10.1787/5kmjnrssr2F3-en. |
| [8] | Hung, K. and Yang, C. (2010). A generalized Markowitz portfolio model selection model with higher moments. International Review of Accounting Banking and Finance, 2: 69–92. |
| [9] | Inderst, G. and Stewart, F. (2014). Institutional investment in infrastructure in emerging markets and developing Economies. Washington, DC, Public-Private Infrastructure Advisory Facility (PPIAF). |
| [10] | Inderst, G. (2009). Pension fund investment in infrastructure. OECD Working paper on insurance and private pensions, No. 32. |
| [11] | Kpessa, M.V. (2011). The politics of retirement income security policy in Ghana: Historical trajectories and transformative capabilities. African Journal of Political Science and Relations, 5(2):91-102. |
| [12] | Mangram, M.E. (2013). A simple perspective of the Markowitz portfolio theory. Global Journal of Business Research, 7(1): 58-70. |
| [13] | Markowitz, H.M. (1959). Portfolio selection: Efficient diversification e of investments. New York: John Wiley & Sons, Inc. pp. 1041–1045. |
| [14] | Markowitz and Harry M.N. (1996). The likelihood of various stock market return distributions. Journal of Risk and Uncertainty, pages 13, 207–219. |
| [15] | Markowitz, H.M. (1952). Portfolio selection. Journal of Finance, 7(1): 77–91. |
| [16] | Mensah, L., R.K. Avuglah and V. Dedu (2013). Allocation of asset on the Ghana stock exchange (GSE). International Journal of Financial Research, pages 108–114. |
| [17] | Perold, A.F. (2004). The capital asset pricing market. Journal of Economic Perspective, 18(3): 3-24. |
| [18] | Pfau, W.D. (2009). The role of international diversification in public pension systems: The case study of Pakistan. Economic Issues. 14(2): 81-105. |
| [19] | Sharpe, W.F. (1964). Capital asset prices: A theory of market equilibrium under conditions of risk. The Journal of Finance, 19(3): 425-442. |
| [20] | Stewart, F. and J. Yermo (2012), Infrastructure investment in new markets: Challenges and opportunities for pension Funds. OECD Working papers on finance, Insurance and private pensions, No. 26, OECD Publishing. |
| [21] | SSNIT (2013, 2014). Annual Report 2013; 2014. Accra, Ghana, Social Security and National Insurance Trust (SSNIT). |
| [22] | Vives, A. (1999). Pension funds in infrastructure project finance: Regulations and instrument design, The Journal of Structured Finance, 5(2: 37-52. |

 Abstract
 Reference
 Full-Text PDF
 Full-text HTML