Sacrifice Nana-Kyere 1, Glory Kofi Hogar 2, Eric Okyere 3, Seth N. Marmah 4, Justice Kwame Appati 5, Obuobi Darko Victor 6
1Department of Mathematics, Ola Girl’s Senior High School, Kenyasi, Ghana
2Department of General and Liberal Studies, Sunyani Polytechnici, Ghana
3Department of Basic Sciences, University of Health and Allied Sciences, Ho, Ghana
4Department of Mathematics, Methodist Senior High, Technical School, Berekum, Ghana
5Department of Mathematics, Kwame Nkrumah University of Sci. Tech., Kumasi, Ghana
6Department of Mathematics, Ola Senior High School, Kenyasi, Ghana
Correspondence to: Sacrifice Nana-Kyere , Department of Mathematics, Ola Girl’s Senior High School, Kenyasi, Ghana.
| Email: |  |
Copyright © 2016 Scientific & Academic Publishing. All Rights Reserved.
This work is licensed under the Creative Commons Attribution International License (CC BY).
http://creativecommons.org/licenses/by/4.0/

Abstract
In this research article, we present a treatment epidemic model for Neisseria Gonorrhea disease which is deadly in its transmission. The model dynamics was studied to understand the epidemic phenomenon and recommend strategies for its control. We carried out a global qualitative analysis for this model and studied the stability of the disease-free and endemic equilibrium using Lyapunov function. The disease-free equilibrium was found to be globally stable when  and the endemic equilibrium is globally stable when
  To investigate whether treatment has any effect on the infective, we experimented our model on various sets of treatment parameter values. Our simulations showed that an increase in the treatment rate has significant effect on the infectives.
Keywords:
Next-Generation matrix, Lyapunov function, Neisseria Gonorrhea, Basic Reproduction ratio
Cite this paper: Sacrifice Nana-Kyere , Glory Kofi Hogar , Eric Okyere , Seth N. Marmah , Justice Kwame Appati , Obuobi Darko Victor , A Qualitative Analysis of Neisseria Gonorrhea Disease with Treatment Effect, Applied Mathematics, Vol. 6 No. 1, 2016, pp. 6-15. doi: 10.5923/j.am.20160601.02.
1. Introduction
Gonorrhea is one of the sexually lethal transmitted diseases (STD), due to the number of complications that it causes in the infected persons [1]. The disease is caused by Neisseria Gonorrhea, a bacterium. Gonorrhea is formed in the warm, moist area of the reproductive tract such as the cervix, uterus and the fallopian tubes in women and in the urethra in both women and men [3]. The history of Gonorrhea goes down to 1792, in Edinburg where the surgeon Benjamin Bell clearly differentiated it from syphilis infection [16]. Gonorrhea has a lot of complications in the infected persons, and a prolong infection can lead to severe eye infections, infertility in both men and woman, ectopic pregnancy, spontaneous abortion, still births and eventually death if untreated [2].(WHO, 2012) [15], estimated approximately 106 million new cases of gonorrhea among adults globally. This is just an embodiment of the reported cases from Gonorrhea bacterium infection in that year. The incubation period of the disease is approximately 10 days in women and 2 to 5 days in men, but in rare cases, there can be as long as 30 days in which the infective is asymptomatic [4]. The bacterium also grows in the mouth, throat, eyes and anus [6]. First noticeable signs from the infection in men are often a painful sensation during urination, persistent sore throat and pains in the testicles. Women however don’t develop overt signs of the disease. When women have the symptoms, they tend to be mild or similar to other infections, making them more difficult to identify. Some of the symptoms women experience are discharge from the vagina, frequent urination, sore throat and uneasy sensation while urinating [5].Gonorrhea transmission happens through direct contact with exudates from mucous membranes of infected people through unprotected oral, anal or vaginal sex. Infected people without the symptoms are likely to spread the infection to others if condoms and dental dams are not used during sexual intercourse [7].Gonorrhea treatment can be achieved through a positive rapid diagnostics and nuclei test, followed by the administration of antibiotics in adolescents and adults [10]. However, drug-resistant strains of the bacterium has recently awakened public health bodies on the area of finding an alternative drugs for the treatment of the disease [8]. We however backed that preventive educational programmes should be embarked upon by all stakeholders in order to prevent and control Gonorrhea in the world by means of safer sexual intercourse.Since discovered, numerous imperative works have been contributed by mathematical and non-mathematical researchers, and these works have helped immensely in the area of vaccine development and control intervention strategy to vaccine manufacturers and public health workers at large. Garnett et al [19], examined the sexual behavior of gonorrhea patients in New York, and used it to estimate the parameters of their gonorrhea model. Their model was used to assess the potential impacts of treatment intervention. Kretzschmar et al [9], proposed a stochastic model for gonorrhea which analyze the underlying structure of sexual contact pattern. They compared the benefits of condom use in an age-structured population of sexually active core group. Prabhakararao [11], analyzed a mathematical model of Gonorrhea disease. They ascertained that the spread of the disease involves interaction of the susceptible and the infective. Leung and Gopalsamy [20], formulated a continuous time SIV model for Gonorrhea transmission among homosexuals. They also used a non-standard discretization method to formulate a discrete time model, and they compared the results of their models. Yorke [12], modelled the spread of Gonorrhea in a population that was categorized into  group and used it to further study the asymptotic stability of the model. Kishore and Pattabhiramacharyulu [13], proposed a simple non-linear first order ODE model for Gonorrhea that measure the growth rates of promiscuous and infective in a homosexual population. They further used numerical examples to explain the effect of cure rate and infective rate on the spread and control of the disease.Besides the mathematical models, an equally outstanding contribution has been achieved by the non-mathematical models. Karnath [17], discusses the symptoms and signs of Neisseria Gonorrhea with regards to the genitourinary and extra-genital, and outlines laboratory diagnosis with recommended treatment measures. Benedek [16], discusses the unsuccessfulness of various experiments in an attempt to infect animals with Gonorrhea infection as well as history of researches on causes and spread of Gonorrhea in humans over the decades. Bala [18], compared and compiled the resistance trends of Neisseria Gonorrhea across various countries of south-East Asia Region by means of surveillance.In this research article, we consider a mathematical model of Gonorrhea disease using the
  compartmental model, where
  Susceptible,
  Exposed,
  Infected,
  Treatment,
  Removed. We however studied the local and the global stabilities, as well as assessing the effect of treatment on the infective.
2. Model Formulation
The model considers five mutually exclusive compartments of  of a deterministic ordinary differential equation (ODE), in a mixing homogeneous population. The total population at any time
 denoted by
  is the sum of individual populations in each compartment. Thus
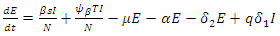
 The model maintains the basic intuition of the SEIR model, with the exception of the introduction of treatment compartment, making it five compartments.The susceptible population
  increases at a recruitment rate
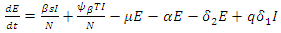
  Recruitment into the exposed class occurs at a rate of
  The population of the infected individual occurring at a rate
  decreases when an infected individual is treated at a rate
  However, given that treatment is only partially effective, and that, a fraction
  of the treated individuals recover with partial immunity, then a fraction
  moves to the latent stage of the infection. We further assume that, treatment of latently infected individuals at a rate
  always results in a recovery. Since treatment only provides partial immunity, individuals treated are reinfected at a rate
  The treated population is further decreased by treated individual recovering at a rate
  Again, natural death occurs at various compartments at a rate, and hence reduces the population further. Treatment here refers to the process of offering the Gonorrhea infected individual with antibiotic drug Ceftriaxone (Rocephin), in combination with either Azithromycin or doxycycline.The dynamics of the model is displayed in the figure 1.
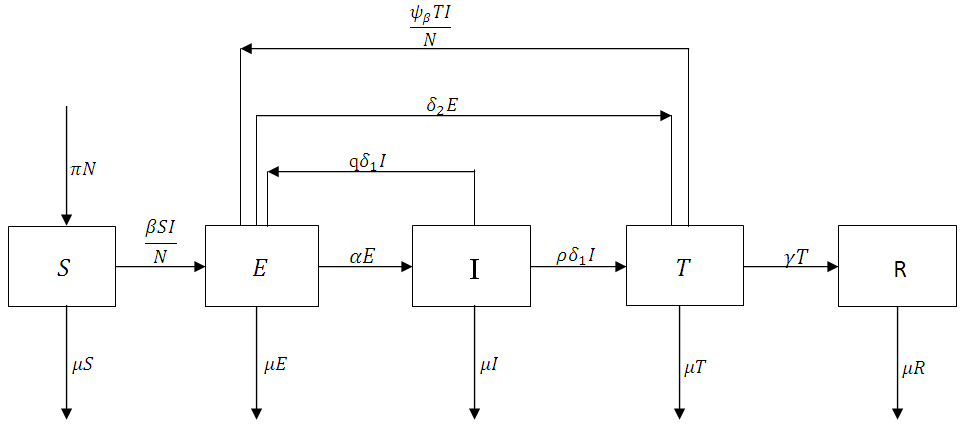 | Figure 1. The flowchart showing the dynamics of the model |
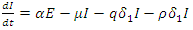
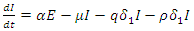
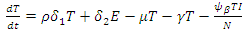
The non-linear differential equations of the model are given by 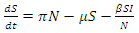 | (1) |
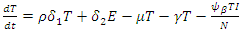
 | (2) |
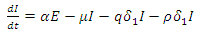 | (3) |
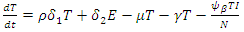 | (4) |
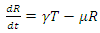 | (5) |
The above systems are equipped with the initial conditions as follows: 
 and
and  The population size
  can be determined by
 Since
Since  , the system (1-5) becomes
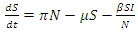 | (6) |
 | (7) |
 | (8) |
 | (9) |
From Biological point of view, the solution has to be nonnegative. Mathematical properties require that the solution of the system (1)-(5) be studied in a closed set 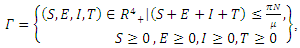 The vector field points to the interior of
  on the part of the boundary when
 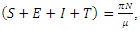 and is positively invariants. Let
  represent the boundary and the interior of
  in
in  respectively. Then, by direct calculation, it can be shown that the system (6)-(9) has two equilibria in
  the disease-free equilibrium
 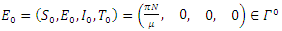 , and a unique endemic equilibrium
 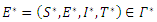 where
where
2.1. The Basic Reproduction Number
The Basic reproduction number or the contact number  is defined as the secondary infection coming from a single infected pathogen that invades a population of only susceptible. If
  it means that
  is the only equilibrium in
  the endemic equilibrium exists and is unique in
  Our calculation would be based on the next generation matrix, as introduced by Diekmann et al [22], for the
  We will use differential equations associated with the exposed (E), infected (I), and treatment (T) compartments given below. We would compute the functions (F) for the rate of new infection term and (V) for the rate of transfer into and out of the exposed, infected, and treatment compartments as indicated in figure 1.
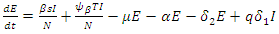 | (10) |
 | (11) |
 | (12) |
Hence  and
and 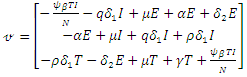 The matrices
  and
and  at
at 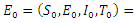
 are given by
 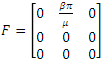 and
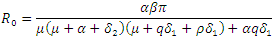
and 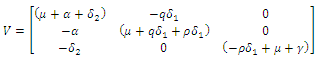 Hence the reproduction ratio is given by
 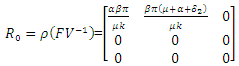 Where
Where 
3. The Disease-free Equilibrium and Its Stability
Theorem 3.1.1: The disease-free equilibrium  of the system (6)-(9) is locally asymptotically stable in
  if
if  and unstable if
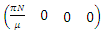
  Proof: The disease-free equilibrium has
 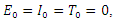 hence the solution of the system of equations (6-9) produce a steady state,
 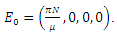 The local stability at the point is deduced from the Jacobian of the system (6-9). The Jacobian is given by
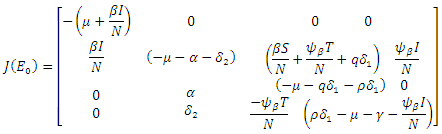 The Jacobian matrix evaluated at
 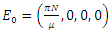 gives
gives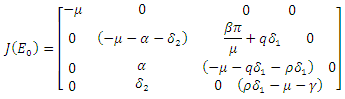 Hence det
 The characteristic equation of the det
  is in the form
 | (13) |
with  being
being  where
where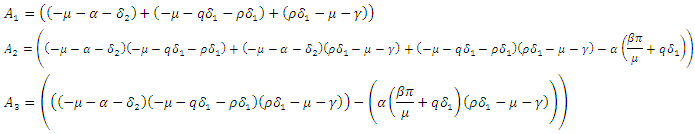 From (13), it is clear that the eigenvalue
  has a negative real part. The other eigenvalues are all determined by the solution of the characteristic equation
 | (14) |
Hence if  then, according to Hurwitz criterion, the quadratic equation would be with roots with negative real parts and
  . Thus, the local stability of
  is asymptotically stable. On the other part, if
  then the quadratic equation has only positive roots and the disease-free equilibrium
  is unstable.Theorem 3.1.2: The disease –free equilibrium
  of the system of equations (6)-(9) is globally asymptotically stable in
  Proof: To recognize the global stability of the disease-free equilibrium, we defined a Lyapunov function
  It follows that
  along the solution of the system (6)-(9) and
  when
when  are zero.The derivative of
  along the solution of (6)-(9) is
 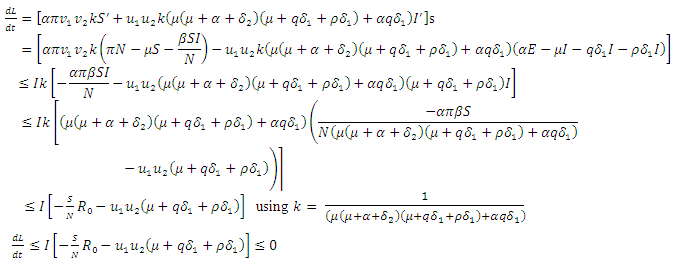 | (15) |
From the inequality (15),  if and only if
 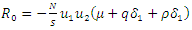 and
and  Thus, by lyapunov-Lasalle’s Thereom, all solution that begins in the feasible region where the solutions have biological meaning goes to
  This presupposes that the disease gradually die from the population. Hence, the disease-free equilibrium
  is globally asymptotically stable and this proved theorem 3.1.2.
3.1. The Endemic Equilibrium and Its Stability
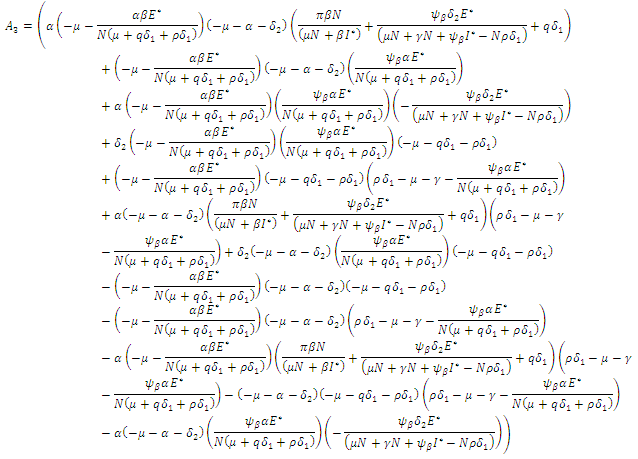
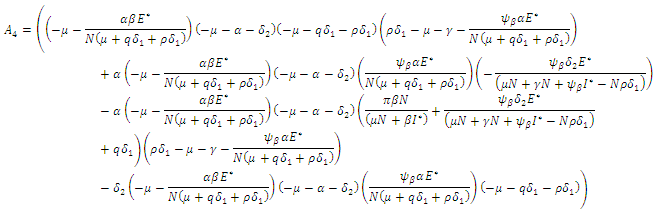
Theorem 3.2.1 The Endemic equilibrium  of the system of equations (6)-(9) is locally stable in
  Proof: We will linearize the system (6)-(9) around the endemic equilibrium
  . The matrix of the linearization of the system (6)-(9) at the point
  is give by
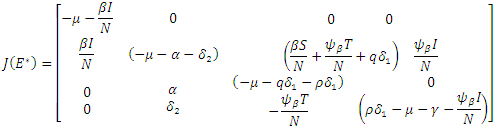 When the above matrix is evaluated at
 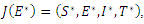 it produces
 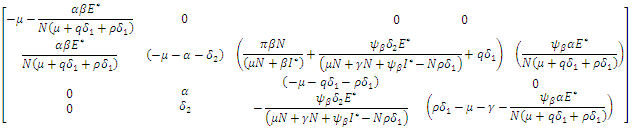 Hence det
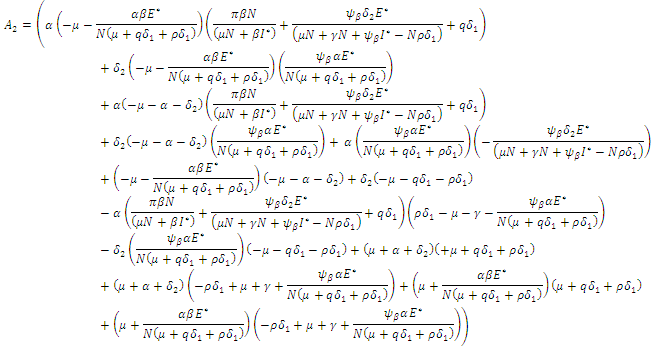
  gives the characteristics equation
  where
where  | (16) |
With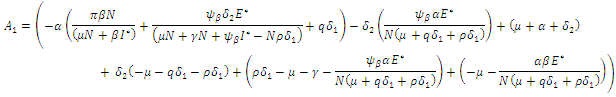
 According to Hurwitz criterion [23], the endemic equilibrium
  is locally asymptotically stable in
  if
if  for
for  and
and 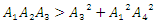 . Hence if equation (16) satisfy these conditions, then
  is locally asymptotically stable, otherwise unstable. Theorem 3.2.2 The endemic equilibrium
  of the system of equations (6)-(9) is globally asymptotically stable in
  Proof: To see the global stability of the endemic equilibrium, we defined a Lyapunov function
  [21]. It is easy to verify that
  along the solution of the system (6)-(9) and
  when
when  are zero.By direct calculation,
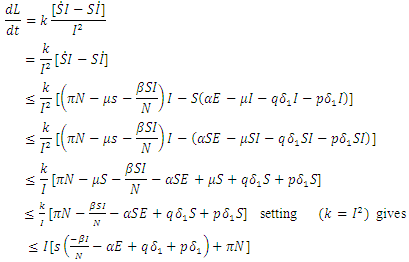 | (17) |
It can be deduced from inequality (17) that when  the derivative
  if and only
  . Consequently, the largest compact invariant set in
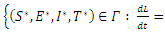
 is the singleton
  where
where  is the endemic equilibrium. Hence by LaSalle’s invariant principle, it implies that
  is globally asymptotically stable in
4. Simulation
The system (6)-(9) was simulated with various set of parameter values using Matlab. We have investigated the stability of the disease-free and the endemic equilibrium using linearization approach and Lyapunov functions for both the local and global stability respectively. We have described in figure 4-6, the effect of treatment on the infective; thus reducing the number of infections in the treated class.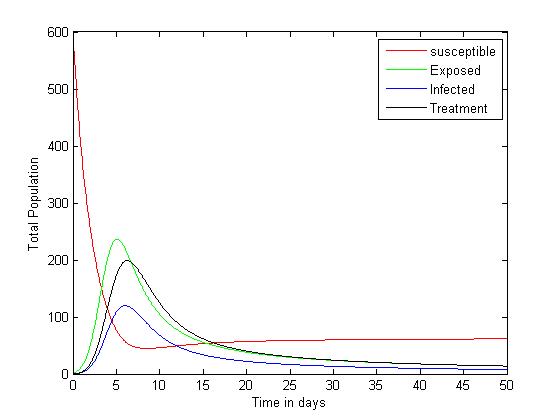 | Figure 1. Plot showing the dynamics of the model |
 | Figure 2. Plot showing the dynamics of the Susceptible and Infected |
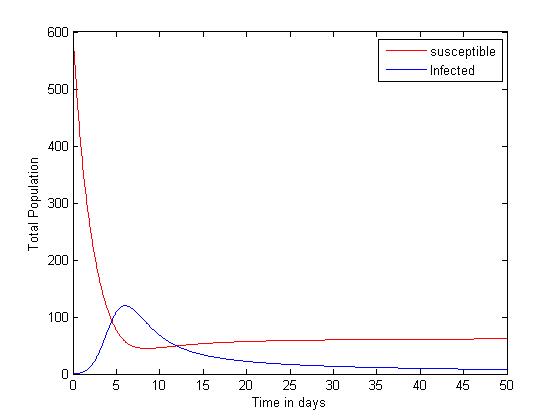
 | Figure 3. Plot showing the dynamics of the Susceptible and Treatment |
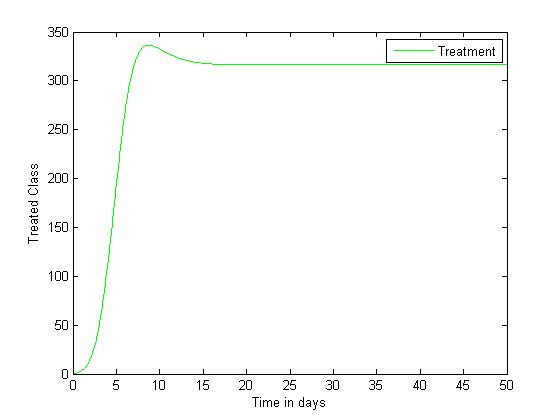 | Figure 4. Disease infections in the treated class with a treatment rate  |
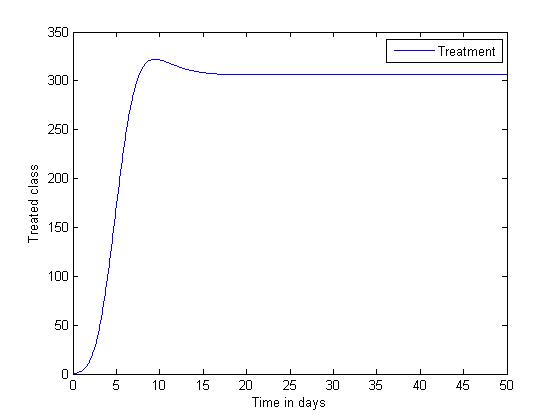 | Figure 5. Disease infections in the treated class with a treatment rate  |
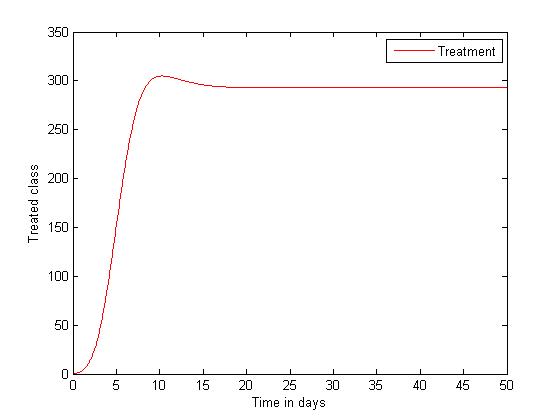 | Figure 6. Disease infections in the treated class with a treatment rate  |
To understand the dynamics of the model, our system of equations (6)-(9) were simulated using the parameter values
 The simulated result of figure 1, shows a sudden rise of the infectives in the early stages of the epidemic, and slows down gradually until it reaches its equilibrium. The susceptible however, decreases sharply and meets the infective at 5 and 12 days where they produce equilibrium points, and maintains its equilibrium thereafter.
5. Conclusions
As stated in the introduction, our main purpose is to study the dynamics of deadly Gonorrhea disease in order to understand the epidemic phenomenon and recommend strategies for its control. We have therefore proposed a treatment epidemic model for Neisseria Gonorrhea disease which is deadly when is not properly treated by the infected person, due to it complicated effects in the host. We have carried out a global qualitative analysis for this model and studied the stability of the disease-free and endemic equilibrium. In terms of the basic reproduction number 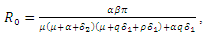 our results shows that when
  the disease-free equilibrium is globally stable and when
  the endemic equilibrium is globally stable.To determine whether treatment has any effect on the infective, we experimented our model on various sets of treatment parameter values. Our simulations showed that an increase in the treatment rate has significant effect on the infective. Thus it reduces infection in the treated class. Hence we recommend that Gonorrhea treatment should be sought at the early stages of the infection to prevent further complications.
References
| [1] | Kieter. D; Gonorrhea. What is Gonorrhea? (September 26, 20015). Retrieved from http://www.health.com (health on gonorrhea. Accessed on October, 2015. |
| [2] | http://www.gov.mb.ca/health/publichealth/cdc/protocol/pharp.pdf. Accessed October 2015. |
| [3] | Division of STD prevention (DSTDP) center for disease control and prevention. Retrieved from http://www.cdc.gov/stds. |
| [4] | Balmelli C, Gunthard HF. Gonococca tonsilar infection-a case report and literature review. Infection 2003; 31: 362-5. |
| [5] | Chacko MR, Wiemann CM, Smith PB. Chlamdia and gonorrhea screening in asymptomatic young women. J Pediatr Adolesc Gynecol 2004;17:169-78. |
| [6] | Gonorrhea: Health topics on UHS website, Retrieved from www.rochester.edu.uhs. |
| [7] | Kodner C. Sexually transmitted infections in men. Prim Care 2003: 30: 173-9. |
| [8] | Katz AR, Effler Pv, Ohye RG.et al, “False positive gonorrhea test result with a nuclei amplification test: The impact of how prevalence on positive predictive value.clin infect DV 2004:38.814-819. |
| [9] | Krestzschmar. M, Yvonne. T. H, Van Duynhoven. P and Severijnen. A. J, “Modeling prevention strategies for Gonorrhea and Chlamydia using stochastic network stimulation: American journal of Epidemiology vol. 144, 1996 . |
| [10] | World Health Organization (WHO), “Laboratory diagnosis of sexually transmitted infection, including human immunodeficiency virus, 2013. http//www.who.mt/reproductivehealth/rtis9789241505840/en/. |
| [11] | Prabhakararao. G., “Mathematical modeling of gonorrhea disease a case study with reference to Anantapur district-Andhrapradesh-India, Global journals Inc., mathematics and decision sciences.vol 13, pp ISSN: 0975-5896, 2013. |
| [12] | Lajmanvovich. A and Yorke. J.A, “A deterministic model for gonorrhea in a Nonhomogeneous population. Mathematical bioscience 28,221-236 (1976). American Elsevier publishing company, Inc .,1976. |
| [13] | Ramakishore. R and Pattabhiramacharyulu. N. CH, “A numerical approach for the spread of gonorrhea in homosexuals. ARPN journal of engineering and applied sciences vol. 6, no. 6, june 2011. Issn 1819 6608. |
| [14] | Biguel. C. and Umemo. M, ‘‘International journal of std and aids. 2012 European guideline on diagnosis and treatment of gonorrhea in adult.int JSTD AIDS 2013:88. |
| [15] | WHO (2012). “Global action plan to control the spread and impact of antimicrobial resistance in Neisseria gonorrhoeae.www. who.2012. |
| [16] | Benedek. T .G, ‘‘Gonorrhea and the beginning of clinical research ethics, Johns Hopkins University Press, V. 48, pp no: 54-73, winter 2005. |
| [17] | Karnett. B .M, MD, “Manifestation of gonorrhea and Chlamydia infection, Review of clinical signs. May/ June 2009, www.turner. White. pp .44-48. |
| [18] | Bala. M, ‘‘Antimicrobial resistance in Neissseria gonorrhea south-east Asia, Regional health forum - vol. 15, number 1, 2011. |
| [19] | Garnett GP, Mertz KJ, Finelli L, et al. The transmission dynamics of Gonorrhea: modeling the reported behavior of infected patients from Newark, New Jersey. Philosophical Transactions of the Royal Society London, B 1999; 354:787-97. |
| [20] | Leung. I. K. C and Gopalsamy. K, ‘‘Dynamics of continuous and discrete time SIV models of Gonorrhea transmission, Dynamics of Continuous, Discrete and Impulsive Systems, ser. B, Vol.19, no. 3, pp. 351-375, 2012. |
| [21] | Frakas. M, ‘Dynamical Models in Biology, Academic Press 2001. |
| [22] | Diekmann. O., Heesterbeek. J.A.P. and Metz J.A.J ., ‘‘On the definition and the computation of the basic reproduction ratio mathcal in models for infectious disease in heterigenuos populations, J. Math.Biol.,28:365-382, (1990). |
| [23] | Userpages.umbc.edu/rostamia/math481/Routh-Hurwitz. |

 Abstract
 Reference
 Full-Text PDF
 Full-text HTML