-
Paper Information
- Paper Submission
-
Journal Information
- About This Journal
- Editorial Board
- Current Issue
- Archive
- Author Guidelines
- Contact Us
Applied Mathematics
p-ISSN: 2163-1409 e-ISSN: 2163-1425
2014; 4(3): 86-96
doi:10.5923/j.am.20140403.03
Nonlinear Dynamics and Chaos in HIV/AIDS Epidemic Model with Treatment
 Abstract
 Reference
 Full-Text PDF
 Full-text HTML
Wiah E. N., Otoo H. Nabubie I. B., Mohammed H. R.
Department of Mathematics, University of Mines and Technology, Tarkwa, Ghana
Correspondence to: Wiah E. N., Department of Mathematics, University of Mines and Technology, Tarkwa, Ghana.
| Email: |  |
Copyright © 2014 Scientific & Academic Publishing. All Rights Reserved.
A nonlinear dynamical system and qualitatively analysis of HIV/AIDS epidemic model with treatment is investigated. The model allows for some infected individuals to move from the symptomatic phase to the asymptomatic phase by all sorts of treatment methods. Mathematical analyses establish that the global dynamics of the spread of the HIV infectious disease are completely determined by the basic reproduction number R0. If R0 ≤ 1, the disease free equilibrium is globally stable, where as the unique infected equilibrium is globally asymptotically stable if R0 ≤ 1. Finally, numerical simulations are performed to illustrate the analytical results.
Keywords: Nonlinear Dynamics, HIV\AIDS, Epidemics, Treatment
Cite this paper: Wiah E. N., Otoo H. Nabubie I. B., Mohammed H. R., Nonlinear Dynamics and Chaos in HIV/AIDS Epidemic Model with Treatment, Applied Mathematics, Vol. 4 No. 3, 2014, pp. 86-96. doi: 10.5923/j.am.20140403.03.
Article Outline
1. Introduction
- HIV/AIDS is one of the most deadly diseases humankind has ever faced, with profound social, economic and public health consequences. It has gradually over the decades become a global pandemic with Ghana not an exception. The number of people living with HIV rose from around 8 million in 1990 to 34 million by the end of 2011(USAID, 2012). The increasing trends of HIV pose a significant public health concern. Although there have been several attempts to curb the spread of HIV, the continual spread of the disease has persisted and there has been reported cases worldwide.Mathematical models have been extensively used over the years in researching into the epidemiology of HIV/AIDS, to help improve our understanding of major contributing factors in a given epidemic (Naresh et al., 2006).(Lima et al. 2008) developed a mathematical model to analyse the potential impact of scaling up highly active antiretroviral therapy (HAART) as a strategy to decrease HIV load at the population level on the spread of HIV. Results indicated that a higher HAART coverage consistently leads to decrease in the number of individuals testing newly positive for HIV.Other researchers have sought to study the effects of various factors that can affect the transmission of the disease. In particular, (Anderson and May, 1998) developed a HIV transmission dynamics model using difference equations in the deterministic case and state transition probabilities in the stochastic case that represents the progression from HIV+ status to AIDS where the population is divided into categories of progressive infectious stages. Patterns of HIV have been studied extensively for over half a century. (Simwa et al. 2003) formulated a deterministic mathematical model for HIV epidemic transmission through heterosexual contact and vertically from an infected mother to her unborn child with three stages of disease progression among infected patients using two systems of ordinary differential equations.With regard to the spread of disease, it has been established that the disease becomes more endemic due to immigration therefore the focus on infective immigrants is inevitable and comes in to ensure that the endemicity of the disease is practically reduced (Issa et al. 2011). In terms of HIV treatment, (Montaner et al. 2006) established from their study on universal HIV testing, the use of antiretroviral (ARVs) for prevention of mother-to-child transmissions (PMTCT) and through post-exposure prophylaxis for sexual assaults and needle-stick injuries. In this paper, we seek to develop a nonlinear deterministic system to study the dynamics of the HIV disease at four compartments of the populations with treatment.
2. Model Formulation
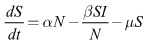
- In order to derive the model equations, the total population (N) is assumed to be constant and categorised into four compartments namely susceptible
 , infective
 , treated class
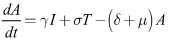
  and AIDS class
 . The detailed transition between these four compartments is depicted in Figure 1. There is an inflow of newly recruited to the susceptible population at a rate
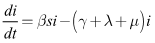
  . Moreover, with the introduction of infectives and homogeneous mixing in the population, an individual become infected at rate
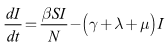
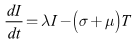
 . It is assumed that some people are not aware of their HIV status and thus do not seek medical attention. The treated class represents people who seek medical attention. Treatment is the process of offering the HIV positive individual with a life prolonging drug/medicine known as antiretroviral (ARV) medicine or antiretroviral treatment (ART). ART drugs are the main types of treatment for HIV/AIDS. New recruits into the treated class occur at a rate
  . Again, people who are ignorant of their HIV status in the infective class are recruited into the AIDS class at rate
  . Natural death at the various compartments occurs at a rate
  .
.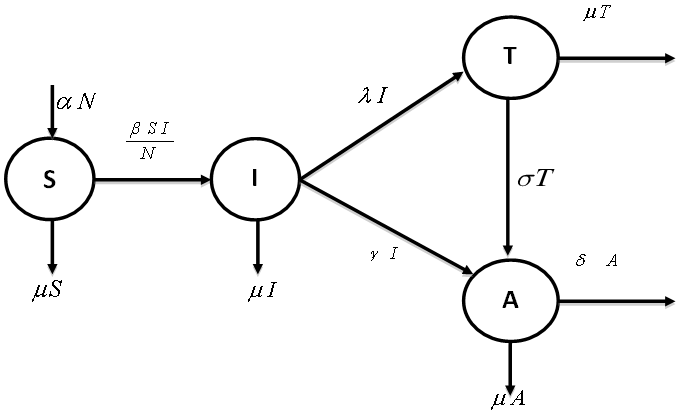 | Figure 1. Schematics of the Susceptible-Infective-Treated-Aids (SITA) model |
 | (1) |
 | (2) |
 | (3) |
 | (4) |
 . The total population, N is given by the formula:
  From equation (1)-(4)
 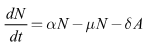 | (5) |
 Hence resulting systems of equations shall be based on
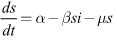 | (6) |
 | (7) |
 | (8) |
3. Basic Properties of the Model
3.1. Positivity of the Solutions
- Since the model monitors human population we need to show that all the state variables remain non-negative for all times.Theorem 1: Let
 then the solutions of
  of the system (6)-(8) are positive for all
  Proof:Taking the first equation, we have
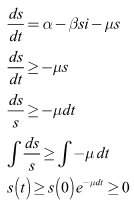 From the second equation we have
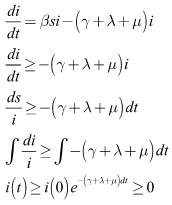 Finally, from the third equation, we have
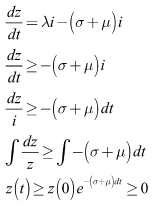
3.2. Invariant Region
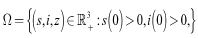
- The system (6)–(8) has solutions, which are contained, in the feasible region
 ProofLet
  be any solution of the system with non negative initial conditions then Adding the equations of the system (6)-(8), we have
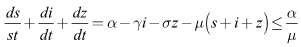 Hence
Hence 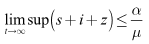 Thus the considered region for the system (6)-(8) is
 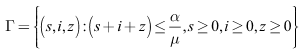 The vector field points to the interior of
  on the part of the boundary when
  for and is positively invariant.
 4. Equilibria
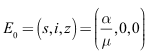
- Lemma 4.1. The disease-free equilibrium of system (1)-(4) is given by
 and the endemic equilibrium by
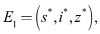 where
where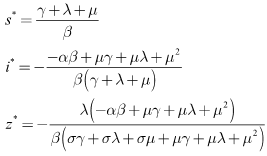 With the natural mortality rate,
  considered constant throughout the model, the duration spent in the infectious class is given by
4.1. Basic Reproductive Ratio 
- One of the fundamental questions of mathematical epidemiology is to find threshold conditions that determine whether an infectious disease will spread in a susceptible population when the disease is introduced into the population. It is defined as the average number of susceptible who can be infected by a typical infective in a population in which everybody is considered as susceptible (Diekmann et. al., 1990). If the basic reproductive ratio is found to be greater than one, the disease will spread throughout the entire population and also if it is less than one the disease eventually die off. Thus, the basic reproductive ratio determines the direction of the disease.Although there have been several theories proposed by various researchers in the estimation of the basic reproductive ratio, we use the Next Generation Matrix approach (van der Driessche et. al. 2002, Diekmann et. al. 2000). It is given mathematically as
 where
where  is defined as the spectral radius of the Next Generation Matrix
  is the rate of appearance of new infections in compartment
  and
and  is the transfer of individuals out of compartment
  by all other means.Given the DFE,
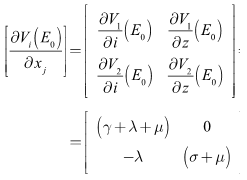
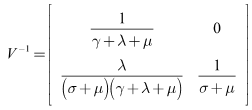
  is calculated as the largest eigenvalue (spectral radius) of the matrix of partial derivatives:
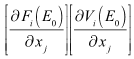 where
where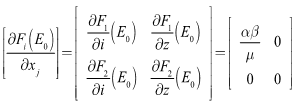 | (9) |
 | (10) |
 Therefore,
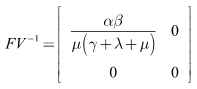 The spectral radius of the next generation matrix is
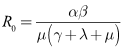 | (11) |
 | Figure 2. Phase plane portrait for the classic HIV endemic model with treatment rate σ = 0.01 |
4.2. Local Stability of the Disease-Free Equilibrium (DFE)
- Lemma 4.2: The disease-free equilibrium is locally asymptotically stable whenever
 We shall use the linearization approach to proof the local stability of the disease-free equilibrium (DFE). The Jacobian matrix associated with the system (6)-(8) is:
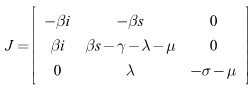 At the DFE, which is given by
 we have
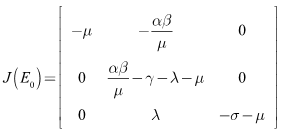 Clearly the eigenvalues at the DFE are given by:
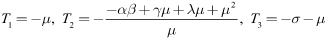 For the positive parameters
  and
and it can be seen that eigenvalues of the DFE are all negative and hence the DFE is stable.Since
 we have
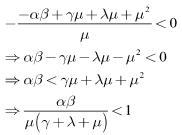 | (12) |
 implies that the inequality (12) also holds and thus we have proved Lemma 4.2.
4.3. Global Stability of the Disease-Free Equilibrium (DFE)
- Lemma 4.3: If
 then the disease-free equilibrium
  is globally asymptotically stable in
 Proof: Given that
 then there exist only the disease free equilibrium
 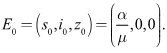 Considering that Lyapunov function candidate
 defined as
 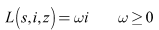 Differentiating
  with respect to time yields
 Substituting the system (6)-(8), we have
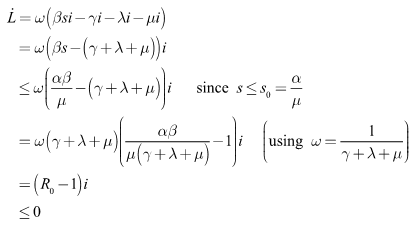 It is important to note that,
  only when
 . However, substituting
  into the equations for
  and
and  in (6)-(8) shows that
  and
and  as
as . Therefore, the maximum invariant set in
 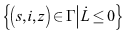 is the singleton set
 . Hence, the global stability of
  when
when  follows from LaSalle’s invariance principle (Lasalle, 1976 and Tewa et. al. 2009).
4.4. Local Stability of Endemic Equilibrium (EE)
- Lemma 4.4: The endemic equilibrium is locally asymptotically stable if
 Proof. The Jacobian equilibrium is locally asymptotically stable if
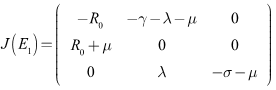 The eigenvalues of
  are
are 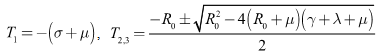 Hence, if
 then
then  and
and
4.5. Global Stability of the Endemic Equilibrium (EE)
- Lemma 4.5: For
 system (6)-(8) is globally asymptotically stable, if
 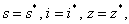 and
and and unstable
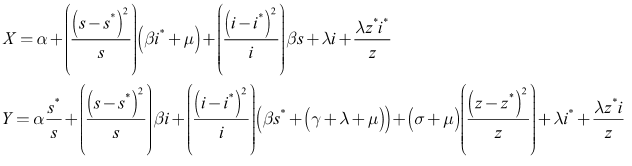
 Proof. Using the constructed Lyapunov function by (Cai, L. and Li, Z., 2010), the global stability of the endemic equilibrium is proved. By defining the Lyapunov function as follows.
 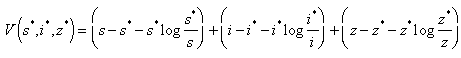 By direct calculating the derivative of
  along the solution of system (6)-(8) we have;
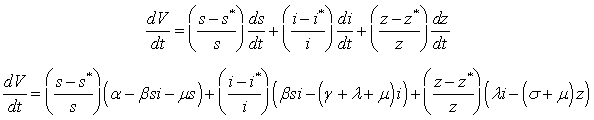 It implies that
 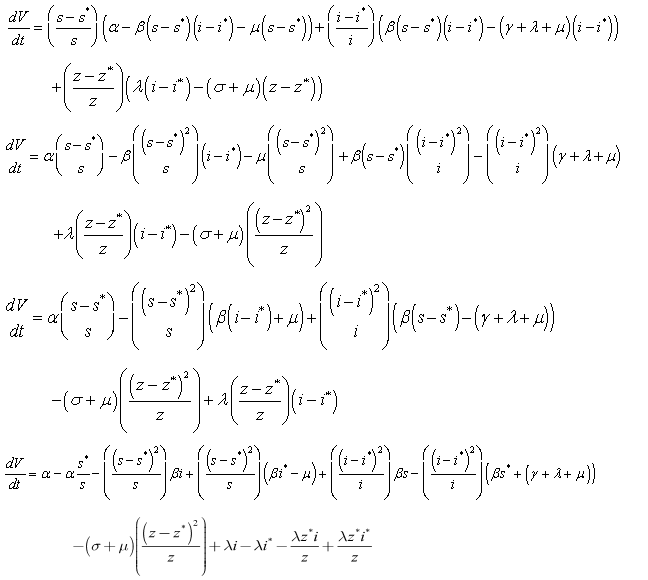 | (13) |
 | (14) |
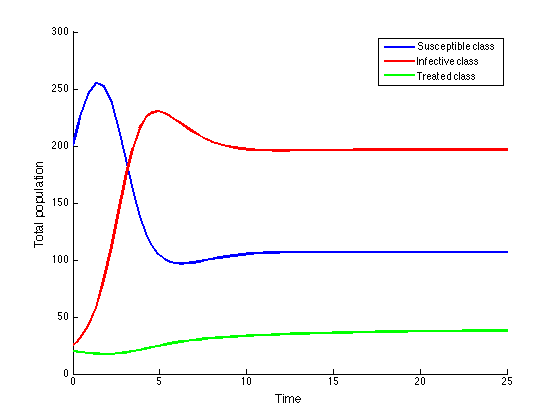 | Figure 3. Population dynamics of the HIV/AIDS epidemic model |
 then we obtain
 . Noting that
  if and only if
  therefore the largest compact invariant set
 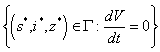 is the singleton
 , where
  is the endemic equilibrium. Hence by the LaSalle’s invariant principle, it implies that
  is globally asymptotically stable in
  if
if
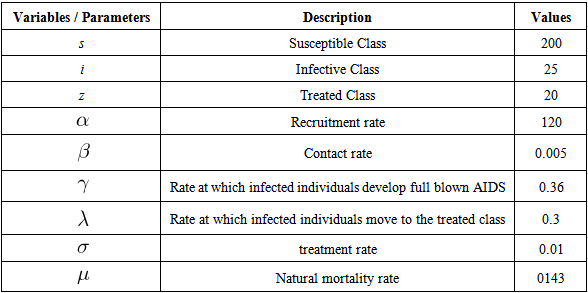
5. Numerical Analysis
- We now present numerical simulations for the nonlinear and chaos HIV model using parameter values in Table 1. Some values assigned to the parameters have been derived from epidemiological literature and WHO database while other parameters have been allowed to vary within the possible intervals. All simulations are performed using Matlab and Mathematica. It is worthy to note that although carefully chosen our parameter values are theoretical and may not be biologically realistic.
|
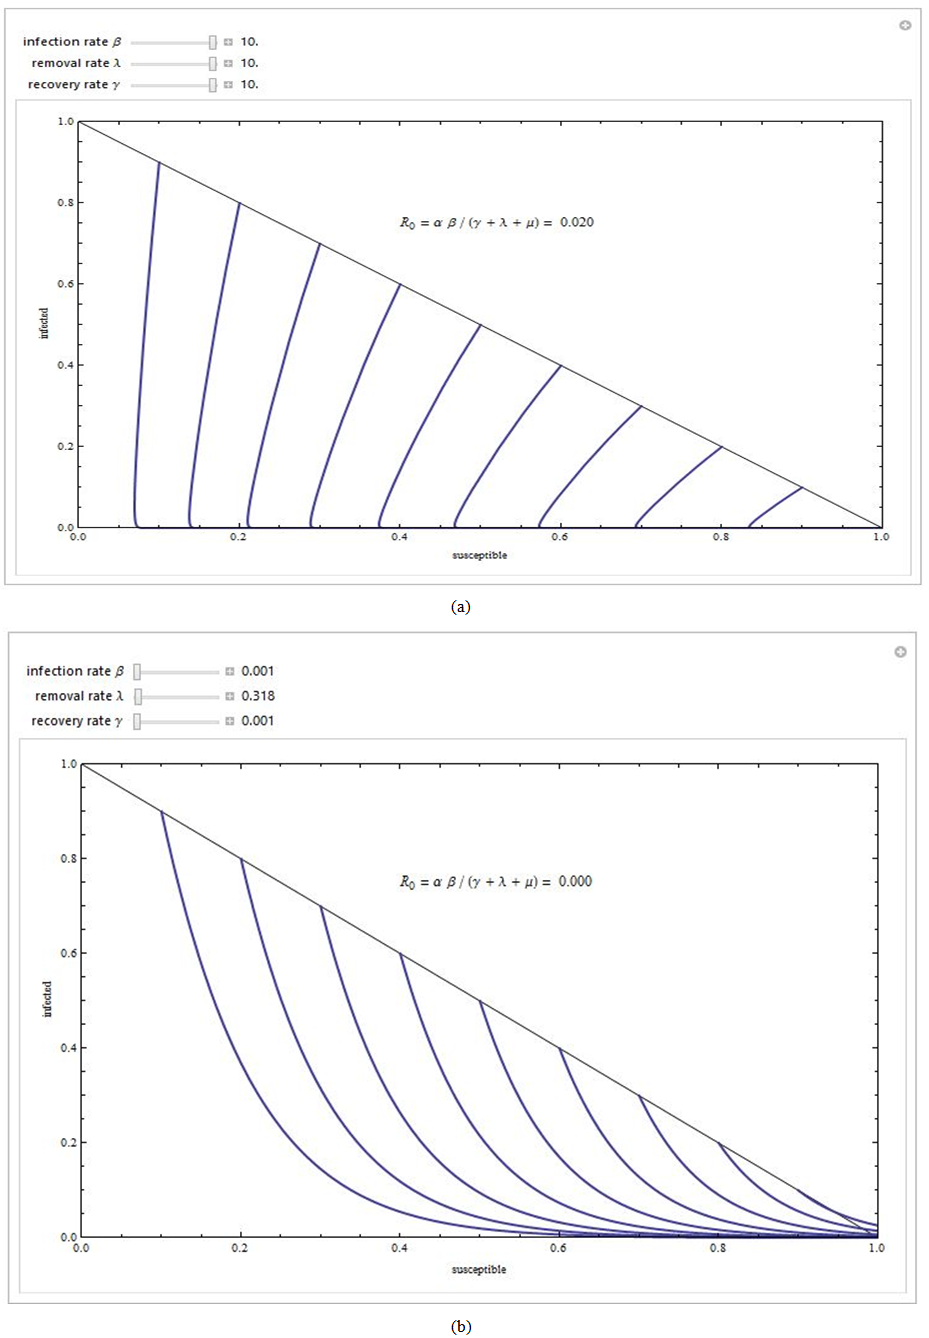
 . The phase portrait in figure (4a) indicates that the trajectories for any initial populations result in a situation where there are no infective individuals, that is, the disease-free equilibrium. From figure (4b) the phase portrait indicates that for any starting initial value, the solution curves tend to the equilibrium
 . Hence, we infer that the system (6)-(8) is globally stable about the endemic equilibrium point
  for the set of parameters chosen.
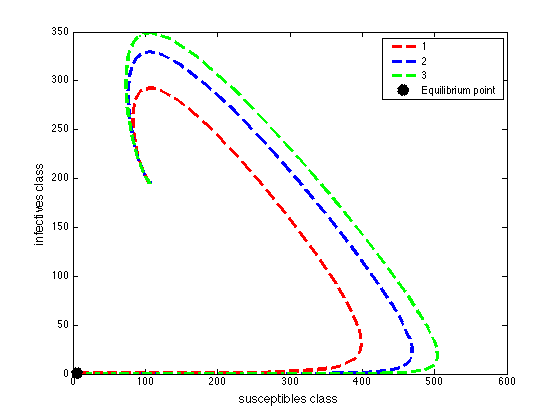 | Figure 4a. Phase portrait of the dynamics of susceptibles class and the infective class |
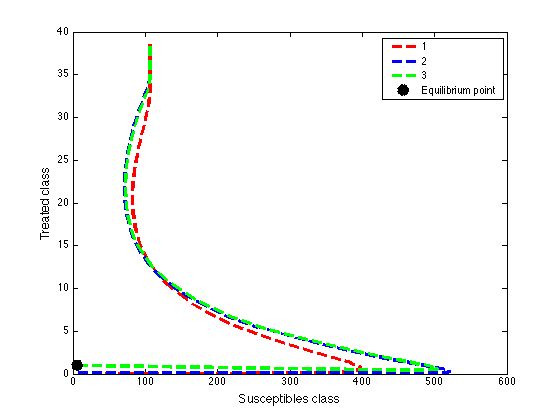 | Figure 4b. Phase portrait of the dynamics of susceptibles class and the treated class |
 These values depict the result in figure (5) and show that, increasing treatment rate has the effect of reducing the number of secondary cases and subsequently reduce the HIV/AIDS epidemic. The results further show that increasing the treatment rate decreases the severity of the epidemic as seen by gradual decrease in the peaks and time lags between peaks, as increases.
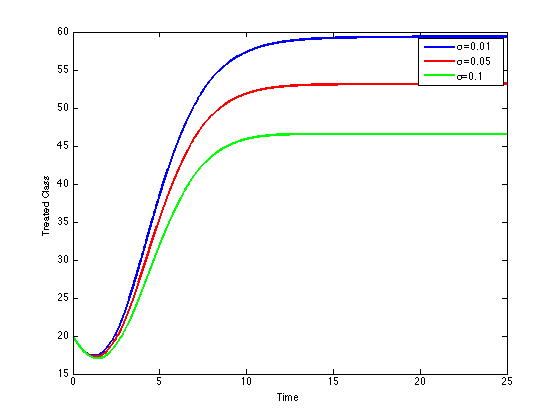 | Figure 5. Disease prevalence in treated class as the rate of treatment increases |
6. Conclusions
- In this paper, an SITA epidemic HIV/AIDS model with a nonlinear dynamics and chaos is designed and analysed. The model consisted of nonlinear ordinary differential equations for a population with variable size structure and studied the effect of treatment dynamics of HIV/AIDS transmission. Some of the theoretical and epidemiological findings of the study are as follows.(1) The dynamics behavior of the nonlinear chaos HIV/AIDS treatment model (6)-(8) such as the basic reproduction number
 were derived and it was shown that the disease can be eradicated if the basic reproduction is less or equal to unity.(2) The model (6)-(8) has a locally stable disease-free equilibrium whenever the associated reproduction number is less than unity.(3) The DFE of the model (6)-(8) is shown to be globally asymptotically stable when
 (4) The endemic equilibrium of the reduced model (6)-(8), is shown to be globally asymptotically stable, when
 To explain that treatment may result in the disease persisting or in the disease dying out, depending on parameter value, we simulated the model over different values of the treatment rate
 The results shows that increasing the treatment rate decreases the severity of the epidemic as seen by gradual decrease in the peaks and time lags between peaks, as
  increases.We conclude that treatment as an intervention strategy can help to contain the HIV/AIDS epidemic but can lead to evolution of drug resistance, which can reverse the benefits of treatment. Although, treatment may lead to evolution of drug resistance, it helps to reduce the proportion of vertically infected and prolongs the lives of all infected individuals.