Marius Boldea1, Florin Sala2
1Mathematics and Statistics, Faculty of Agriculture, Banat University of Agricultural Sciences and Veterinary Medicine from Timisoara, Timișoara, 300645, Romania
2Agrochemistry - soil science and plant nutrition, Faculty of Agriculture, Banat University of Agricultural Sciences and Veterinary Medicine from Timisoara, Timișoara, 300645, Romania
Correspondence to: Marius Boldea, Mathematics and Statistics, Faculty of Agriculture, Banat University of Agricultural Sciences and Veterinary Medicine from Timisoara, Timișoara, 300645, Romania.
| Email: |  |
Copyright © 2012 Scientific & Academic Publishing. All Rights Reserved.
Abstract
The dependence between agricultural yield and the doses of chemical fertilizers was expressed through various models in the specialized literature. The model we propose is based on the function that describes the relation among the dose of fertiliser, the dose already in the soil supply and agricultural yield (2), and it is just as suitable as the Mitscherlich function. The constants in the function taken into consideration were determined by the least squares method, by comparison with the experimental data. With this function, we optimized the fertilization area in order to obtain either the maximum benefit, or the minimum cost price, but not the maximum yield. These optimizations can be made by calculations and by graphical methods as well.
Keywords:
Optimization, Fertilized Area, Modelling, Economic Indicators, Yield, Wheat
Cite this paper: Marius Boldea, Florin Sala, Optimizing the Area Fertilized with Nitrogen-based Chemical Fertilizers for Wheat Crops, Applied Mathematics, Vol. 3 No. 3, 2013, pp. 93-97. doi: 10.5923/j.am.20130303.02.
1. Introduction
Under the conditions of modern agriculture, in order to obtain increased yields, soil is fertilized predominantly with chemical fertilizers based on nitrogen, phosphorus and potassium. Since these fertilizers are costly, they have to be used judiciously. The objectives of fertilization are the following: optimizing the doses, optimizing the proportions of fertilizers and optimizing the fertilized area. The research in this field started from models of the Mitscherlich - Baule type,[1],[2],[3],[4], which created prognoses for the classical economic indicator - agricultural yield. Authors such as[5],[6],[7],[8] realized modified versions of the Mitscherlich model, based either on primary generalizations of the production functions, or on methods of series expansion of continuous functions.In our prior research, we developed and expanded the same model in various analytical forms, in an attempt to obtain realistic prognosis for agricultural yield, depending on one or more types of fertilizers,[9],[10],[11],[12],[13],[14], [15],[16].Below, we present a new model for the production function, of the form: 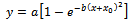 If the total quantity of fertilizers available does not cover what is necessary for ensuring the optimal level for the entire area, we optimized other economic indicators, such as benefit, productivity, and cost price.
2. Mathematical Considerations
2.1. Mathematical Model
If  represents agricultural yield, and
  is the dose of fertilizer in kilograms per hectare, then we admit that production increase
  is proportional to dose
 , more exactly to the total dose
 , where
  is the dose present in the soil, as well as with the saturation deficit
 where α is the maximum, saturation yield:
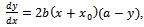 | (1) |
where  represents the proportionality constant.By integrating the differential equation (1), we get:
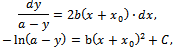 with
with  being an arbitrary constant of integration, which is determined from initial conditions: if
 , then
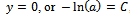 , so, in successive steps we get:
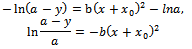 and so:
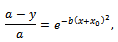 from where:
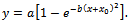 | (2) |
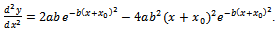
The expression in relation (2) represents the function for an exponential model with an inflection point, the graph of which is represented in Figure 1: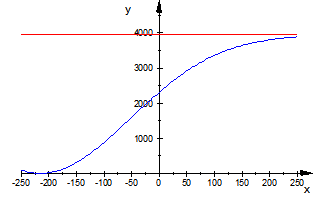 | Figure 1. Graph of the function in (2) (x = dose of N kg ha-1; y = yield) |
The curve represented above is tangent to axis  exactly in point
 and the inflection point may be in the positive domain or in the negative domain, depending on the constant of nutritive element
  in the soil. This inflection point is of practical interest as well, and so for determining its coordinates we will write successively:
 ,
, .By solving equation:
 we get:
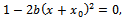 which means:
 which represents the abscissa of the inflection point. For calculating the ordinate of the inflection point, we have:
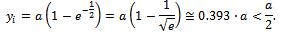 Note that the ordinate of the inflection point is smaller than half of the maximum yield
 .
.
2.2. Determining the Constants
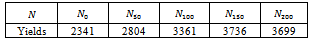
The three constants that are involved in the formula in relation (2) are determined with the least squares method, by comparison with the experimental data.We consider the wheat yields obtained from 2007 to 2008, in relation to nitrogen fertilization. The data in Table 1 were corrected with the values for standard errors for each variant.Table 1. Yields in relation to nitrogen for wheat crops, Alex variety, Timișoara Didactic Station, Romania
 |
| |
|
In the exponential model with an inflection point, we consider the asymptotic constant known  kg (approximated from the experimental data by graphic extrapolation), and we still have to determine constants
  and
and  from function (2). We form the sum of squares function of the differences:
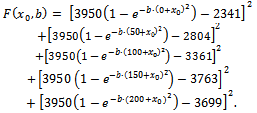 | (3) |
Function  is minimum if the partial derivatives are null, meaning:
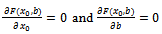 | (4) |
By solving system (4), we obtain the solutions: By graphic representation of function (2), as well as the experimental data in Table 1, we obtain Figure 2.
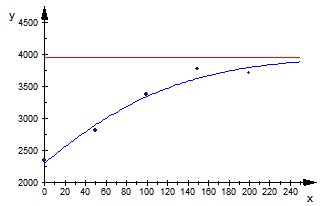 | Figure 2. Graphic representation of the theoretical curve in (2) and of experimental data (x = dose of N kg ha-1; y = yield) |
Figure 2 shows good concordance between the theoretical curve and the experimental data.
3. Economic Considerations
Starting from the hypothesis of insufficient quantity of nitrogen-based fertilizers for the optimal fertilization of a given area S, we studied the following economic indicators: total yield, benefit, productivity and cost price.
3.1. Total Yield
We consider an area  on which we need to cultivate wheat. We admit we have a fixed quantity
  of nitrogen-based fertilizers. The question is whether this quantity
  must be distributed over the entire area
 , or only over a part
  out of the entire area
 , in order to obtain the maximum total yield. An optimal
  may exist, because, if the fertilized area is small, the fertilizer dose x per hectare:
 | (5) |
is big and the yield increases together with the dose, even if there is an area  which is not fertilized, but cultivated.For this, we calculate the total yield for the two areas
  and
and :– on area
  yield
yield , according to relations (2) and (5) it is:
 | (6) |
– on area , unfertilized
  , it is:
 | (7) |
For the entire area, the yield is: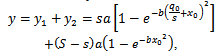 or, after making the calculations:
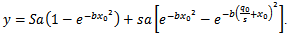 | (8) |
If we use the coefficients determined above, the function in the previous relation is monotonically increasing in relation to , thus the total yield is maximum if
 , which means the fertilizers must be distributed over the entire surface
 . The fact that it is monotonically increasing is demonstrated by using the information that, for continuous functions, between two zeros of the derivative, derivative keeps its sign, so the function retains its monotony. As in the case of our example the derivative is positive in the interval
 , the derivative is positive, resulting in the fact that the function is monotonically increasing.In sum, if we take total yield as the economic indicator, it will not have an optimal
  different from
 . For this reason, we will consider other economic indicators, such as benefit, productivity and cost price.
3.2. Benefit
We define benefit  as the difference between the value of the yield
  and costs
 . The notations in the relations above are defined as follows:
  is the yield price per unit;y represents the yield;
 is the fertilization cost for every hectare;
 is the fertilized area, and
  represents other fixed costs.We will consider the following example for
  hectares (total available area) and
  kilograms of active substance fertilizer (total quantity of fertilizers available). Thus:– for the price values of wheat and of the nitrogen-based fertilizer, we will consider
  (the price of wheat in November 2012 on the London Stock Exchange) and
 fertilization costs, and
  other fixed costs;– we also take into account the values of the constants determined above:
  kg ha-1 maximum yield value,
  kg ha-1 nitrogen as nutritive elements found in the soil and
 .Thus:
 ,so:
,so: | (9) |
By solving equation meaning:
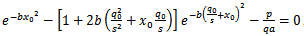 | (10) |
we get the optimal solution for this exponential model with an inflection point. By replacing, in the formula above, the values of all constants considered in our example, we get the solution . It is this area that has to be fertilized out of the 100 hectares, in order to get the maximum benefit.The same optimal solution for
  can be obtained graphically, as in Figure 3:
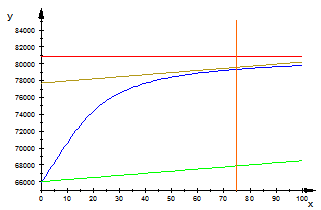 | Figure 3. Determining the optimal solution for the benefit through the graphical method (x = dose of N kg ha-1; y = benefit in euro) |
where we represent graphically the yield value  and the costs
 , respectively. We did not take into consideration other fixed costs, as, from a mathematical point of view (the derivative of the constant is zero), they do not matter. We drew a line parallel with line
  until it became a tangent to the curve representing
 . The abscissa of the tangent point represents the optimal solution for the dose applied in such a way as to obtain the maximum benefit. The graphic representation shows that the optimal value is still
 .
.
3.3. Productivity
We define productivity as the ratio between yield , with
  initial fertilizer-free yield, and the costs of the fertilizers:
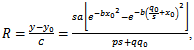 | (11) |
or: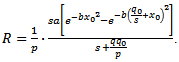 | (12) |
But the maximum of  is obtained by annulling the derivative, so:
 | (13) |
The solution of equation (13) is . Of course, the solution must be included in domain
 . As in the case of the previous economic indicator, here too we can obtain the same solution, but this time through the graphical method (Figure 4):
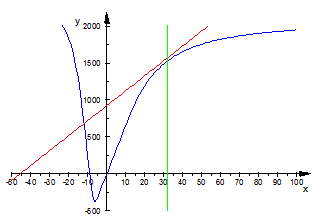 | Figure 4. Determining the optimal solution of productivity through the graphical method (x = N, y = productivity) |
We represented graphically function  in the following way. From the point
  we drew a tangent to curve
 . The abscissa of the tangent point is the optimal solution for s.
3.4. Cost Price
We define cost price  as the ratio between costs and yield. This means that there is an inverse relationship between cost price and yield, or
 . Thus, the minimum of the cost price equals the maximum of the productivity. Therefore, the optimal solution for the maximum of the productivity equals the optimal solution for the minimum of the cost price.
4. Conclusions
The models related to chemical fertilizers are generally unifactorial, also because a  complex, in fixed proportions, can safely be considered a single fertilizer.The best-suited models are the exponential models, starting with the Mitscherlich model.The function in relation (2), the one that has an inflection point, is the closest to reality.By using the production function, we can optimize the fertilizer doses in order to maximize the benefit, to minimize the cost price or to optimize the fertilized area if the total quantity of available fertilizers does not cover what is optimally needed for the entire area. These optimizations can be made through calculations as well as through graphical methods,. Optimization in this way is not recommended for the indicator agricultural yield, as its maximum is where s = S. The minimum of the cost price is the indicator that best capitalizes each euro invested in fertilizers.
ACKNOWLEDGEMENTS
The research was supported through the research project financed by CNCSIS Bucureşti, code CNCSIS 308, contract number 96 GR /11.06.2008.
References
| [1] | Mitscherlich, E.A., 1909. The law of the minimum and the law of diminishing soil productivity (In German). Landwirtschafliche Jahrbuecher 38: 537-552. |
| [2] | Mitscherlich, E.A., 1913. Soil science for agriculture and forestry (In German). 2nd edition, 317 pp. Verlag Paul Parey, Berlin. |
| [3] | Baule, B., 1917. Mitscherlich's law of physiological relations (In German). Landwirtschafliche Jahrbuecher 51 (1916-17): 363-385. |
| [4] | Mitscherlich, E.A., 1956. Yield laws (In German). Akademie-Verlag, Berlin. 75 pp. |
| [5] | Harmsen, K. 2000. A modified Mitscherlich equation for rainfed crop production in semi-arid areas: 1. Theory. Netherlands Journal of Agricultural Science 48 23 7-250. |
| [6] | Harmsen, K. 2000. A modified Mitscherlich equation for rainfed crop production in semi-arid areas: 2. Case study of cereals in Syria. Netherlands Journal of Agricultural Science 48 251-272. |
| [7] | Harmsen, K, A.E. Matar, M.C. Saxenn and S.N. Silim., 2001. Yield response to phosphorus fertilizer in a wheat-lentil rotation in a Mediterranean environment, Netherlands Journal ofAgricultural Science 49 385-404. |
| [8] | Nijlandl., G.O., J. Schouls and J. Goudriaan, 2008. Integrating the production functions of Liebig, Michaelis-Menten, Mitscherlich and Liebscher into one system dynamics model, NJAS 55-2. |
| [9] | Anghel, C., M. Boldea Mathematical Models Regarding Agricultural Yield and Chemical Fertilizers, Proceedings of International Workshop on Applied Mathematics, Academia Română – Filiala Timişoara, Universitatea de Ştiinţe Agricole şi Medicină Veterinară a Banatului – Timişoara (1 – 6), Ed. Mirton, Timişoara, 2005, ISBN 973-661-670-3. |
| [10] | Anghel, C, M. Boldea, A method for determining the production function, International Journal of Mathematics Game theory and Algebra, Vol. 16, nr. 6, pp. 535-540, Nova Science Publishers, SUA, 2007. |
| [11] | Sala, F. Agrochimie, p. 345-353, Ed. EUROBIT, Timișoara 2008, ISBN: 978-973-620-298-8. |
| [12] | Boldea, M., F. Sala, Isidora Radulov, F. Crista. A Mathematical Mo-del on the Dependence between the Agricultural Production and Chemical Fertilizer, ICNAAM 2010 — International Conference on Numerical Analysis and Applied Mathematics 2010, ISBN: 978-0-7354-0831-9, p. 1363-1366, published by the American Institute of Physics (AIP). |
| [13] | Boldea, M., F. Sala, Lia Micula, Adina Berbecea, Determinating the optimal Proportions of Chemical Ferti-lizers for the Agriculture Productions in the case of a Hyperbolic Model, ICNAAM 2010 – International Conference on Numerical Analysis and Applied Mathematics 2010, ISBN: 978-0-7354-0831-9, p. 1375 – 1378, published by the American Institute of Physics (AIP). |
| [14] | Boldea, M., F. Sala, Optimizing Economic Indicators in the Case of Using two Type of State - Subsidized Chemical Fertilizer for Agricultural Production, ICNAAM 2010 - AIP Conference Proceedings / Mathematical and Statistical Ph 1281: ICNAAM 2010 - International Conference on Numerical Analysis and Applied Mathematics 2010, ISBN: 978-0-7354-0831-9, p. 1390-1393, published by the American Institute of Physics (AIP). |
| [15] | Sala F., Boldea M. On the Optimization of the Doses of Chemical Fertilizers for Crop, AIP Conf. Proc. 1389, pp. 1297-1300 Numerical Analysis and Applied Mathematics ICNAAM 2011. |
| [16] | Sala, F., Marius Boldea, Isidora Radulov, Florin Crista, Adina Berbecea, Prognosticating the Agricultural Production as the Effect of a Mono-factorial Determination Generated by Single-nutrient Fertilizers, Bulletin of University of Agricultural Sciences and Veterinary Medicine Cluj-Napoca, Agriculture Editura AcademicPres 2010, Vol. 67 (1), pag. 247 - 252, ISSN: 1843-5246. |
 Abstract
 Reference
 Full-Text PDF
 Full-text HTML