Natalya Naumova , Larisa Danovich
Applied Mathematics Department, Kuban State Technological University, Krasnodar, 350072, Russia
Correspondence to: Natalya Naumova , Applied Mathematics Department, Kuban State Technological University, Krasnodar, 350072, Russia.
| Email: |  |
Copyright © 2012 Scientific & Academic Publishing. All Rights Reserved.
Abstract
The problem of developing a model of network operation allowing us to objectively estimate the parameters of the network flows distribution is very relevant nowadays. A mathematical model of a multichannel communications network operation is developed based on the Erlang time distribution for each flow. Using the methods of relativity theory and random processes theory, a mathematical tool is worked out to calculate the quality parameters of the network operation organisation for the nodes such as mean value of delay-in-queue, mean number of requests on queue. Different variants are considered in order to satisfy specific types of node operation. The criterion of network operation optimisation is suggested.
Keywords:
Mathematical Model, Network Flows, Transportation Network, Mean Delay, Optimisation
Cite this paper:
Natalya Naumova , Larisa Danovich , "Modelling and Optimisation of Flows Distribution in the Network", Applied Mathematics, Vol. 2 No. 5, 2012, pp. 171-175. doi: 10.5923/j.am.20120205.04.
1. Introduction
Mathematical modelling is nowadays a universal and cogent aid in theory and practice of various fields. This is a major method of investigation in economic, industrial and technological systems. Besides, mathematical modelling is a critical instrument of estimation and control. The optimisation of transport networks operation would not be efficient without mathematical modelling, since conducting natural experiments for defining various structures of relationships within the network is either very expensive or simply not feasible in practice.Traffic flow modelling developed into a branch of mathematical science in the middle of the 20th century (e.g.[2],[3]) when the first macroscopic (hydrodynamic) models appeared to describe traffic flows in terms of the flux (M. Lighthill, G. Whitham, P. Richards), alongside with the first microscopic models (‘follow-the-leader’ theory) which explicitly derived an equation of motion for each individual vehicle (А. Reshel, L. Pipes, D. Gazis and others). In the subsequent years, the class of models was extended (e.g.[4-7],[13-14]). At present, the macroscopic approach in most cases describes the traffic flow using a non-linear system of hyperbolic equations (for flow density and speed) with diffusion. In its turn, the microscopic approach mainly uses the models like the ‘conscious driver’ model which describe the vehicle acceleration as a function of its speed, the distance after the leading vehicle (the leader) and the difference in the speeds of the leading and going after vehicles (М. Treiber). Though more than half-a-century have passed since the first fundamental works on traffic flow modelling were written, many authors agree that the problems of congestion and pre-congestion formation have not been completely solved (К. Nagel, H. Mahmassani, М. Schreckenberg and others). Therefore, developing a microscopic model of transportation dynamics in the nodes and estimation of their influence on the network flows distribution seems to be relevant.
2. Model of the network nodes operation
While developing our own mathematical model of the network operation we will present it in a traditional form of oriented graph. A network is a graph each arc of which is assigned to a certain number. A flow is a set of homogeneous objects (requests) sent from one node to another. A flow is, thus, a certain function prescribed for the graph arcs. In the case studied, the flow in the graph is given as a function of density of arrival distribution (arrival times of service requests).We will refer to the network flows as ‘non-conflict’ if they are not crossed in the given sector of the network, and as ‘conflict’ otherwise. We will consider the node-points – the points of sources or consumption of information and those of conflict flows crossing – to be the vertices of a graph. The node-points are connected by multichannel lines. We will hold that time intervals distribution in each customer flow obeys the Erlang distribution which makes it possible to describe high density flows.Let: = set of graph arcs,
 = set of nodes. Then, an arc is part of a multichannel line between two nodes. Assign the identification numbers
  ,
,  to the lines. Then
 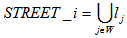 . And the graph could be given as the following matrix:
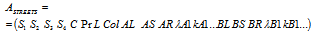 where1. S1 и S2 = intersected lines forming Node 1;2. S3 и S4 = intersected lines forming Node 2;3. C = node type;4. Pr = priority (main or secondary line);5. L = length of arc;6. Col = number of flows on the arc;7. AL = admissibility of turning to the left from Direction A at Node 1;8. AS = admissibility of direct motion from Direction A at Node 2;9. AR = admissibility of turning to the right from Direction A at Node 2;10. λА1, λА2, etc. = parameter λ in Direction А;11. kA1, kA2, etc. = parameter k in Direction А;12. BL = admissibility of turning to the left from Direction B at Node 1;13. BS = admissibility of direct motion from Direction B at Node 1;14. BR = admissibility of turning to the left from Direction B at Node 1;15. λ1, λВ2 etc. = parameter λ in Direction B;16. kB1, kB2 etc. = parameter k in Direction В.The number of lines of the matrix equals the number of arcs. in the graph.
2.1. Model of the type 1 node operation
Let us consider a node-point (NP) in which the conflict flows are crossed. A number of flows (the main ones) are freely passing the NP. The customers of the rest of flows (the secondary ones) are expecting sufficient time intervals between arrivals of main flows in order to cross the NP. We will call such a node-point a ‘type 1 node’.The operation of a type 1 node is a mass service system. The service time is the waiting time for a customer of a secondary flow to cross the necessary main flows; the queue size is a number of customers waiting for the possibility to continue to move; the discipline (priority) is according to the order of arrival at the NP.Let the service time be distributed by the exponential law with the  parameter. The customer flow is distributed by the generalised Erlang law with the (k+l)-folded
  parameters.Let us take n service channels with an unlimited queue. With the help of the pseudostates method, as in[9], we made a differential equation system to determine the
  probabilities of i arrivals and
  probabilities of m busy service channels:
 | (1) |
 | (2) |
 | (3) |
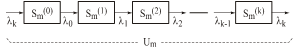 | Figure 1. Pseudostates of the Erlang (k+l)-folded distribution |
In order to determine the  possibilities of the system dwelling in transitive states of the Un+i subset (Fig. 1) we will make the following differential equation system:
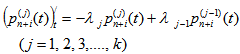 | (4) |
The initial conditions are as follows: | (5) |
(In our notations pm(0)pm for all m).The rm(t) possibility of dwelling in the Um state equals: | (6) |
On solving the system for a stationary process going on for a long time, we obtained the following parameters of the type 1 node operation:1) the possibility of no more than s customers in the queue: | (7) |
where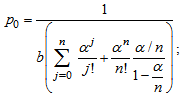 | (8) |
2) the mathematical expectation of arrivals: | (9) |
3) the mathematical expectation of the number of busy channels: | (10) |
4) the mean number of customers serviced or expecting: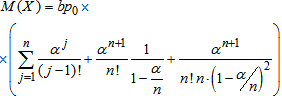 | (11) |
2.2. Calculation of the mean service time value in the type 1 node
Let a secondary flow customer need to cross L main flows in the type 1 node to go on moving. We assume that time intervals in the crossed flows are distributed by the Erlang law with the (k1, …, kL)-folded  parameters correspondingly. We take into account that a customer arrives at the NP at a random moment, irrespective of other flows customers.By the rules of calculations of numerical parameters of random variables functions, as in[8], we obtained the formula for calculation of the mean waiting time for a secondary flow customer to cross the main flows:
 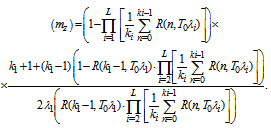 | (12) |
The mean delay of one secondary flow customer at the NP in the flow with λ и k distribution parameters (in seconds) is: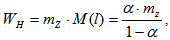 | (13) |
where 
 ,Т0 = an acceptable interval before further movement (sec.).
2.3. Model of the Type 2 Node Operation
Now let us consider a node-point (NP) with cruciform intersection of conflict flows. The channel is alternately blocked for one of the non conflict flow group for a fixed time to enable the crossing of the NP which we call a ‘type 2 node’.The Erlang distribution density is as follows: | (14) |
The k-th order Erlang distribution function is given by: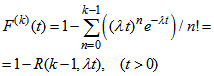 | (15) |
which is the possibility of time interval between two neighbouring events being below t. Let us find out the mean value of Nt – a number of customers arriving at the given route point for a period of time (0; t).We will consider the restoration function  – the mathematical expectation of arrivals for the t time, as in[1]. The Laplace transform for this function is:
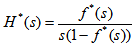 | (16) |
Here  – an image of time distribution function. For the Erlang distribution:
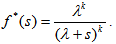 | (17) |
Then: | (18) |
For a general case of the k-folded Erlang distribution it is necessary to consider other than zero (k-1) roots: | (19) |
These roots are: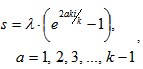 | (20) |
(where i – an imaginary unit). For each root in the Laplace function image expansion there is a certain term: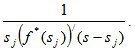 | (21) |
Therefore, the restoration function image is: | (22) |
Hereof, with the help of charts, we can find the original, i.e. the  restoration function – the number of customers arriving at the given route point for a period of time (0; t).For the case when the Erlang distribution order is k=2:
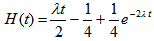 | (23) |
For the Erlang distribution with k=3: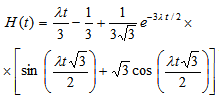 | (24) |
If k=4: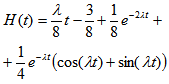 | (25) |
The delay in the NP is the waiting time in the queue in case when the motion in the given direction is blocked.For a type 2 node we suggest the following calculation of the expected total delays-in queue in the given flow for the time Тi during which the motion in the given direction is not allowed: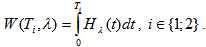 | (26) |
Inter alia, if the value of the k parameter of the Erlang distribution equals two, then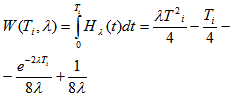 | (27) |
If  :
: | (28) |
If  :
: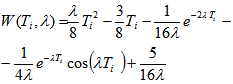 | (29) |
(where λ = parameter of the Erlang distribution for the given flow,  ).The mean delay-in-queue for one cycle of distribution of one customer in the given flow is:
 | (30) |
where T=T1+T2..To determine the total delays for one hour we will consider the following cases:1) If the number of customers arriving at the NP for one distribution cycle is less than the number of customers leaving the NP for the period of time during which the motion in the given direction is allowed, the queue to this direction will not grow and the customers will pass for one cycle.Let nА1 be the number of non-conflict flows in Direction A of Line 1, h = the mean interval between arrivals crossing the NP in one flow (in seconds), λАi = parameter of the Erlang distribution for flow i of Direction A1.If  , then the queue to the given direction will disappear for one cycle and the total delays per hour will be:
 | (31) |
Т1 = time (sec.) during which the motion in Direction A of Line 1 is not allowed;Т2 = time (sec.) during which the motion of flows of Line 2 is not allowed;The similar chaining for the flows of other directions is:2) If  , then for the period of time during which the motion in Direction A is allowed the queue will not disappear. In this case the mean total delays-in-queue to the given direction for the time Т1 (sec.) can be calculated by the formula:
 | (32) |
And the total delays per hour for the given direction can be calculated as follows: | (33) |
For the rest of directions the chaining is similar.
3. Efficiency of the Network Operation Organisation
The time of motion by the given route of network is made up of the time of motion between the two neighbouring nodes and that of spent on passing the node. The mean time of motion between the two neighbouring nodes is calculated by the formula: | (34) |
where S = distance between the two neighbouring nodes; = mean speed of motion of customers in the flow.Due to the fact that we demanded the same initial data for developing the mathematical model for each sector of the network, it is possible to perform the optimisation of the network flows distribution.The route of motion in the network is designed by successive enumeration of nodes of the graph. In order to choose the optimum route, the following integrated route efficiency parameter can be introduced:where К1 = the length of route; К2 = the mathematical expectation of the congestions in the given route; К3 = the mathematical expectation of the time spent in ‘traffic jams’, К4 = the time of motion along the given route,  = the significance values of the corresponding parameters.The significance values are defined in such a way that the following condition is observed:It is necessary to take into account the significance of each criterion for assessment of the route quality.The optimum route is chosen according to the following principle:
  .
.
4. Conclusions
The authors’ mathematical model of network operation suggested in the paper is based on the Erlang arrival time distribution. This two-parameter law allows us to describe flows of rather high density. The fact that the model takes into account the intensity of requests in non-conflict flows for each direction separately extends its range of application and enables modelling the network with reorganised (changed) structure without collecting additional empirical data. More detailed argued deduction of the above equations could be seen in the works referred[10-12].The relevance of the developed model of network operation has been empirically proved in an urban transportation network. There are a great variety of mathematical models to calculate different quality parameters of traffic organisation by particular data of an urban transportation network. But each of them needs different initial data and a change in some parameter of one part of network requires additional investigation into ways of calculation of traffic schemes in other parts, which complicates optimisation processes of traffic flows in the network and results in increase of data collection costs. The suggested model is devoid of this drawback.
References
| [1] | Cox, D.R., Smith, W.L., Queues, Methuen, London, 1961. |
| [2] | Gasis D.C. et al. “Car following theory of steady state flow”, Operations Research, vol. 7. pp. 499-505, 1959. |
| [3] | Drew D.R. Traffic Flow Theory and Control, McGraw-Hill Book Company, New York, 1968. |
| [4] | Inose, H., Hamada, T., Road Traffic Control, University of Tokyo Press, Tokyo, Japan, 1975. |
| [5] | Nagel K., Wagner R., Woesler R. “Still flowing”, Approaches to traffic flow and traffic jam modeling, January 2, 2003. |
| [6] | Ligthill M.J., Whitham F.R.S. “On kinetic waves II. A theory of Traffic flow on crowded roads”, in Proceedings of the 1995 Royal Society Ser., vol. 229, no. 1178, pp. 317-345, 1995. |
| [7] | Proceedings of 2003 3rd Swiss Transport Research Conference, 2003. |
| [8] | Вентцель, Е.С. Теория вероятностей (Probability theory): Учеб. для вузов, Высшая школа, Москва, Russia, 1998. |
| [9] | Вентцель, Е.С., Овчаров, Л.А. Теория случайных процессов и ее инженерные приложения (Theory of random processes and their application in engineering): Учеб. пособие для втузов, Высшая школа, Москва, Russia, 2000. |
| [10] | Домбровский, А. Н., Наумова Н. А., Транспортные потоки на улично-дорожной сети городов: моделирование и управление: монография (Traffic Flows in Urban Transportation Networks: Modelling and Control), Издательский Дом – Юг, Краснодар, Russia, 2012. |
| [11] | Наумова, Н. А.,Данович, Л. М., Моделирование и программная реализация движения авто-транспортных средств по улично-дорожной сети: монография (Modelling and Simulation of Traffic in Transportation Networks), Издательский Дом – Юг, Краснодар, Russia, 2011. |
| [12] | Наумова, Н. А., Данович, Л. М., Моделирование и оптимизация распределения потоков по сети: монография (Modelling and Optimisation of Flows Distribution in the Network), Изд. КубГТУ, Краснодар, Russia, 2011. |
| [13] | Семенов В.В. Математическое моделирование динамики транспортных потоков мегаполиса (Mathematical modelling of traffic flows dynamics in the megapolis): Обзорный реферат, Москва, Russia, 2003. |
| [14] | Швецов В.И. “Математическое моделирование транспортных потоков” (“Mathematical modelling of traffic flows”), Автоматика и телемеханика, no 11, 2003. |
 Abstract
 Reference
 Full-Text PDF
 Full-Text HTML