-
Paper Information
- Paper Submission
-
Journal Information
- About This Journal
- Editorial Board
- Current Issue
- Archive
- Author Guidelines
- Contact Us
Advances in Life Sciences
p-ISSN: 2163-1387 e-ISSN: 2163-1395
2015; 5(1): 1-11
doi:10.5923/j.als.20150501.01
An Assessment of Indoor Air Quality in Selected Households in Squatter Settlements Warri, Nigeria
 Abstract
 Reference
 Full-Text PDF
 Full-text HTML
Akpofure Rim-Rukeh
Federal University of Petroleum Resources, Department of Environmenta Science, Effurun, Nigeria
Correspondence to: Akpofure Rim-Rukeh, Federal University of Petroleum Resources, Department of Environmenta Science, Effurun, Nigeria.
| Email: |  |
Copyright © 2015 Scientific & Academic Publishing. All Rights Reserved.
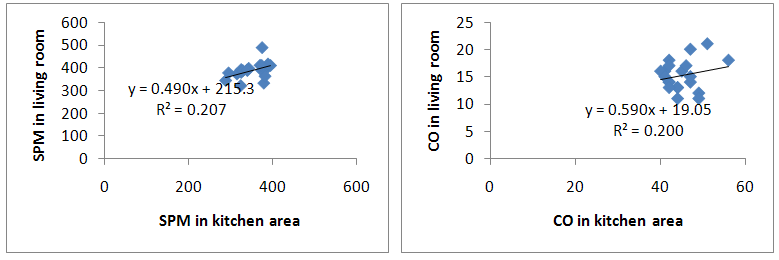
An assessment of indoor air quality in selected households living in squatter settlements at Warri, Nigeria was analyzed experimentally. A total of 60 households were randomly selected for the study. In each household (living room and kitchen areas), six (6) air quality monitoring parameters; suspended particulate matter (SPM2.5 and SPM10), nitrogen dioxide (NO2), carbon monoxide (CO), sulphur dioxide (SO2), and ozone, (O3) were monitored. Obtanied data were statitically analysed. Results indicate that measured levels of NO2, CO and SPM in all sampled households were above regulatory limits of 0.06ppm, 10ppm and 250µg/m3 respectively as a result of the form of domestic fuels (firewood, wood charcoal and sawdust) use for cooking. The distribution of the measured air quality parameters (PM10 and CO) in the living (parlour) room and in the kitchen area, was computed using the Pearson Moment correlation. A correlation (r) of 0.571 and 0.756 were obtained for SPM and CO respectively for households in Marako slum. In Igbudu slum a correlation (r) of 0.455 and 0.447 were obtained for SPM and CO respectively, while in Makaver slum a correlation (r) of 0.510 and 0.784 were obtained for SPM and CO respectively. Structurally similarity in the houses promoted the diffusion of pollutants from the kitchen into the living spaces. The air quality index (AQI) shows that the air is unhealthy for human habitation. At the policy level, the study has identified several sources of indoor air pollution exposure risk that can be mitigated by the dwellers of squatter settlements.
Keywords: Slums, Air quality index, Households, Firewoods, Particulate matter, Kitchen, Living room
Cite this paper: Akpofure Rim-Rukeh, An Assessment of Indoor Air Quality in Selected Households in Squatter Settlements Warri, Nigeria, Advances in Life Sciences, Vol. 5 No. 1, 2015, pp. 1-11. doi: 10.5923/j.als.20150501.01.
Article Outline
1. Introduction
- Besides just looking at the clean and decorative facades of the buildings in a city, a closer look reveals a darker aspect of the urban scenario – the presence of squatter settlements or slums. Although the concept of slums or squatter settlements and its definition vary from country to country depending upon the socio-economic conditions of the society, slums are generally regarded as neglected parts of cities where housing and living conditions are appallingly poor. Slum household as a group of individuals living under the same roof that lack one or more of the following conditions; access to safe water; access to sanitation; secure tenure; durability of housing; and sufficient living area [1]. Slumshave also been viewed as areas where building are in any respect unfit for human habitation by reason of dilapidation, overcrowding, faulty arrangement and design of such buildings, narrowness or faulty arrangement of streets, lack of ventilation, light, sanitation facilities or any combination of these factors which are detrimental to safety, health and morals [2].Economically slums are areas inhabited by the poor in the urban system [3]. The poor are the unemployed, the unskilled, and illiterate and often the alcoholics, the vagabond and the delinquent [3].The basic characteristics of slums are visually unpleasant buildings, lack of basic amenities (water supply, sanitary, electricity etc), acute overcrowding, services used illegally, high birth rate, high mortality rate, high infant mortality, unhealthy environment, low socio-economic conditions, environmental (land, air, water and noise) pollution, frustration among people, lack of civic sense and knowledge, grossly congested area and unsecured life. The living conditions in slums are usually unhygienic and contrary to all norms of planned urban growth [4]. The origin of slum settlements can be traced to the great industrial revolution in Britain [5]. The development of the wheel machine in London created opportunities for job and thus lured people who then settled themselves near to the factory. The limited residences built around the factory could not provide shelter for all the workers. Some people adjusted themselves in congested spaces although basic amenities were not available, thus a ‘slumdon’ was created. Today, slums are fast becoming major characteristics of an industrial growing city. There is no likelihood that the present trend of increasing urban population growth in Nigeria can be changed for some time to come. This is because for many Nigerians there is the belief that the only hope of improving their standard of living is to live in an urban environment.Living conditions have a direct impact on public health. Slum dwellers usually experience a high rate of disease [6]. Diseases that have been reported in slums include cholera [7], HIV/AIDS, [8], measles [9], malaria, [10] dengue [11], typhoid [12], drug resistant tuberculosis [13], and other epidemics [14]. Slum dwellers have also been reported to be affected by indoor air pollution. Examples of short-term effects of indoor air pollutants include irritation to the eyes, nose and throat, and upper respiratory infections such as bronchitis, and pneumonia [15-18]. Long-term effects of poor indoor air quality include chronic respiratory disease, lung cancer, heart disease and even damage to the brain, nerves, liver or kidneys [19], [20]. Researchers have found that radon gas is responsible for over 1,800 deaths annually in United Kingdom [21]. Relative small-scale studies of indoor PM10 exposure from woodfuel combustion have been conducted in Kenya [22], Guatemala [23], Mexico [24] and Gambia [25]. Recently, a larger sample of houses has been studied in rural India [26], [27]. In Nigeria there is little or no empirical database. This fact has being collaborated [28]. In Nigeria, interdisciplinary studies of slum areas are very limited. An early attempt in indoor air pollution studies in Nigeria, paid attention on the physical aspects of slums [29]. This paper provides empirical evidence on the levels of indoor air quality insome households in squatter settlements within Warri metropolis. The general aim of the current study was to create a database of the indoor airconcentrations for suspended particulate matter, carbon monoxide ozone, sulphur dioxide and nitrogen dioxide insquatter settlement in Warri, Nigeria. This study was designed to answer several questions about air quality exposure in poor households. First, is the assessment of indoor air quality monitoring. Second, how different is indoor pollution in kitchen area and living room area? Are these concentrations significantly affected by typical variations in cooking practices, cooking locations, structural characteristics and ventilation practice (opening doors and windows)? If such effects are large, then simple alterations in household arrangements may provide a cost-effective alternative to fuel switching or investment in clean stoves. Thirdly, what is the health implication for the households. Finally, what are the prospects for increased use of improved stoves and clean fuels in Nigeria?
2. Materials and Methods
2.1. Study Area
- The study area is Warri, which is located in the Southern part of Delta State, Nigeria (Figure 1). It is a major urban city in the Niger Delta area, where a number of industries such as Delta Steel Company, Shell Petroleum and Development Company (SPDC), Chervron Nig. Ltd., Warri refinery and Petrochemical companies, Nigeria Gas Company are located.
 | Figure 1. Google map of Delta State showing Warri |
2.2. Methodology
- Three (3) slums (Maroko, Igbudu and Marcaver) were selected for the study. The choice of the selected slums is based on their large sizes and high population. At each of the selected slum, twenty (20) households were randomly selected, bringing the total households investigated in the study to sixty (60). In each of the randomly selected household air quality was monitored in the living room and kitchen areas. In each household, six (6) air quality monitoring parameters; suspended particulate matter (SPM2.5), suspended particulate matter (SPM10), nitrogen dioxide (NO2), carbon monoxide (CO), sulphur dioxide (SO2), and ozone, (O3) were determined using a series of hand held air quality monitoring equipment. These monitors include: An industrial scientificcorporation ITX Multi gas monitor for NO2,SO2, and CO. O3 concentration was measured with Ebara Jitsugyo EG-2001 high-accuracy O3 monitor, which provided O3 mixingratio referenced to 1 atm and 295 K conditions with a1-ppb resolution. The GT-331 VI.04 A Met One Instrument, Inc. Aerosol Mass Monitor Model GT-331 was used in determination of suspended particulate matter (SPM). The monitor uses light scatter to measure individual particles instead of clouds like other monitors. The particle information is then grouped into size ranges and converted to mass concentration over 4 minutes at a flow rate of 2.83L/min into measuring ranges of: SPM2.5 and SPM10 mass concentration. Measurements were done by holding the sensor to a height of about two meters in the direction of the prevailing wind and readings recorded at stability. The eight-hour monitoring period was carried out from early morning to evening during the monitoring period. The study was carried during thedry season of January, 2014.
2.3. Statistical Analysis
- Obtained data were statistically analysed using the following statistical tools: Correlation Coefficient (r): It is a measure of the strength and direction of the linear relationship between two variables that is defined as the (sample) covariance of the variables divided by the product of their (sample) standard deviations. Correlation values are bound between a value of -1 and +1. A correlation of +1 can be interpreted to suggest that both variables move perfectly positively with each other, and a -1 implies they are perfectly negatively correlated. Specifically, a correlation of 0.7 – 1.0 is describe as a strongly positive; 0.5 – 0.69 is described as moderately positive and 0.0 – 0.49 is described as weakly positive [31]. The coefficient of determination (R2) is a measure of how well the regression line represents the data. If the regression line passes exactly through every point on the scatter plot, it would be able to explain all of the variation. The further the line is away from the points, the less it is able to explain.Mean and Standard Deviations: The sample mean is the average and is computed as the sum of all the observed outcomes from the sample divided by the total number of events. We use x as the symbol for the sample mean. In mathematical terms,
 where n is the sample size and the x correspond to the observed valued.The Standard Deviation is a measure of how spread out numbers are. The symbol for Standard Deviation is σ (the Greek letter sigma).This is the formula for Standard Deviation:
3. Results and Discussion
3.1. Results
- Results of air quality monitored in the randomly selected households in the three squatter settlements (slums) are as presented in Tables 1-3. Results of the air quality for the houses in which kitchens and living rooms were concurrently monitored are included.
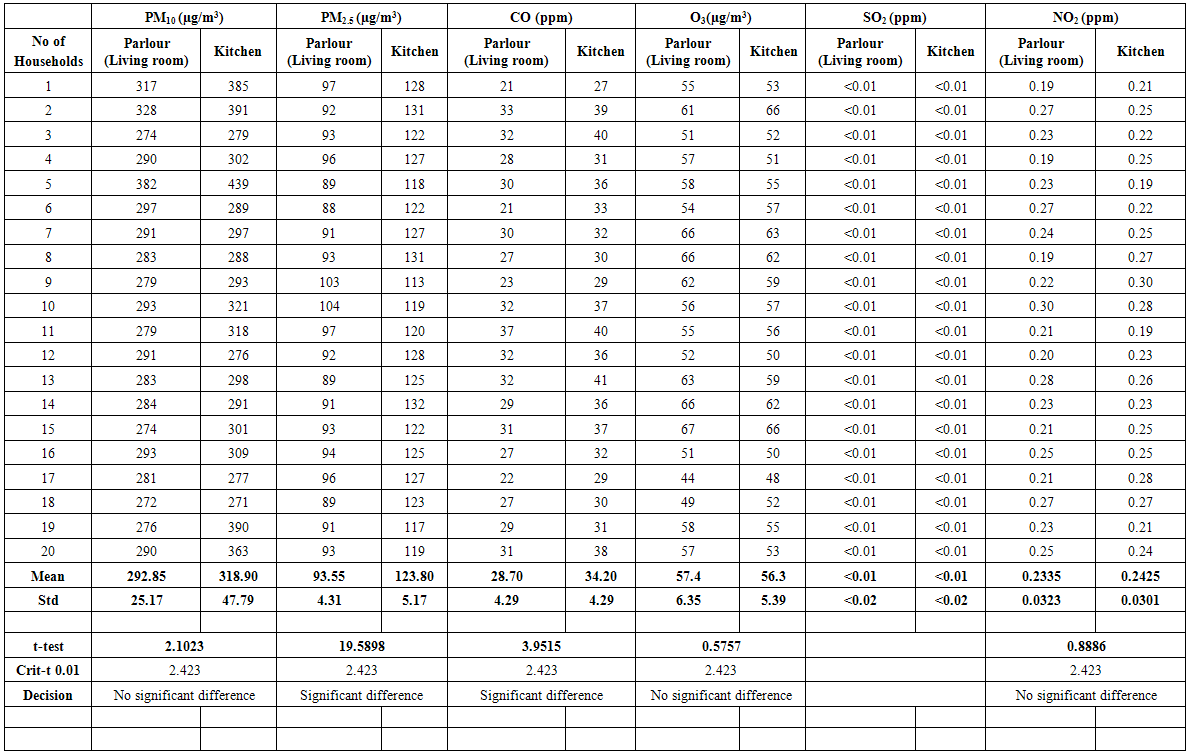 | Table 1. Air Quality in the Kitchen and Living Rooms in the Maroko Slum |
 | Table 2. Air Quality in the Kitchen and Living Rooms in the Makaver Slum |
 | Table 3. Air Quality in the Kitchen and Living Rooms in the Igbudu Slum |
3.2. Discussion
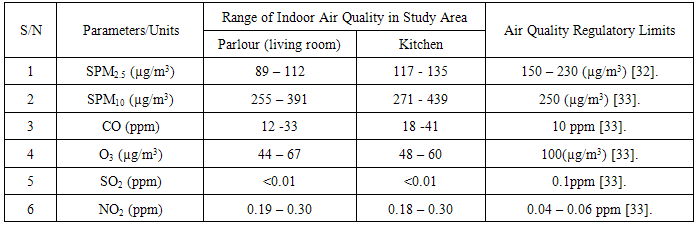
- Range of values of indoor air quality in the selected households in the squatter settlements and regulatory limits is presented in Table 4.
|
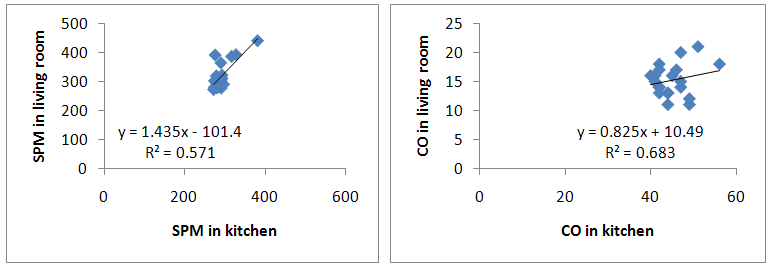 | Figure 2. Correlation of SPM and CO values in the kitchen and living room in Marako Slum |
 | Figure 3. Correlation of SPM and CO in the kitchen and living room in Igbudu Slum |
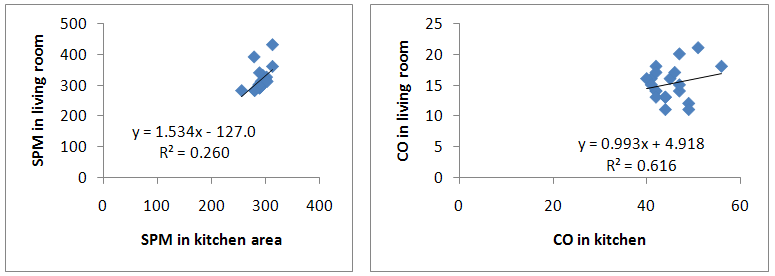 | Figure 4. Correlation of SPMand CO values in the kitchen and living room in Makaver Slum |
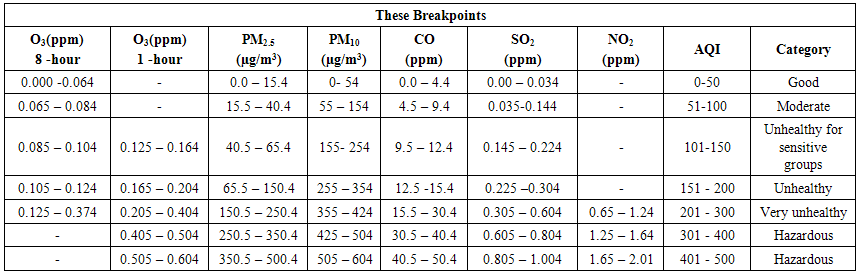 | Table 5. Air Quality Index descriptor |
 | Figure 5. Air Quality Index Descriptor |
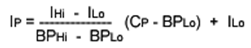 | (1) |
 CP = the rounded concentration of pollutant P
 BPHi = the breakpoint that is greater than or equal to CP
 BPLo = the breakpoint that is less than or equal to CP
 IHi = the AQI value corresponding to BPHi
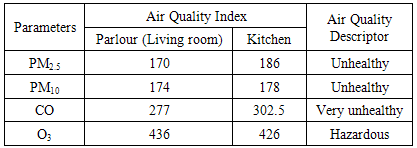
 ILo = the AQI value corresponding to BPLoThe air quality index (AQI) calculated for the squatter settlements in Warri metropolis for Particulate matter (PM2.5 and PM10), Ozone (O3), and Carbon monoxide (CO) is presented in Table 6.
|
4. Policy Implications
- At the policy level, the study has identified several sources of indoor air pollution exposure risk that can be mitigated bythe dwellers of squatter settlements in Nigeriaat feasible cost. I strongly believe that self-interest will motivate the slum dwellers to act, once they become convinced that the problem is serious, and that their actions will be cost-effective. The following should form the policy thrust:Ø Restructuring of the buildings using porous construction material and providing proper ventilation in cooking areas. This will yield a better indoor health environment. The use of chimneys or vent-holes may improve indoor air in individual households. Ø The use of wood, dung and other biomass fuels should be discouraged. Ø Results imply that measures that could significantly reduce indoor air pollution exposure would be; use of cleaner fuels; purchase of more fuel-efficient stoves; peripheral location of cooking facilities; and ventilation of cooking smoke through astack tall enough to reduce the particulate concentration, by dispersing smoke over a relatively broad area.
5. Conclusions
- Findings of the study show that measured levels of NO2, CO and SPM in all sampled households were above regulatory limits which may have resulted from the form of domestic fuels (firewood, wood charcoal and sawdust) use for cooking. Air quality index (AQI) indicates that the indoor air can be described as unhealthy for active children, women and adults, and people with respiratory disease such as asthma. At the policy level, the study has identified several sources of indoor air pollution exposure risk that can be mitigated by the dwellers of squatter settlements. Alternatively, cooking smoke could be ventilated through a stack tall enough to disperse smoke over a broad area, thereby reducing particulate concentration in slum households. In addition, the solution is to switch to cleaner-burning stoves and modern fuels andto increase their affordability. This work would be an important supply to the indoor air pollution studies, and would be helpful in policy making.