-
Paper Information
- Previous Paper
- Paper Submission
-
Journal Information
- About This Journal
- Editorial Board
- Current Issue
- Archive
- Author Guidelines
- Contact Us
Advances in Life Sciences
p-ISSN: 2163-1387 e-ISSN: 2163-1395
2014; 4(5): 235-244
doi:10.5923/j.als.20140405.04
Effect of Olive Oil Adulteration on Peroxide Value, Delta-K and on the Acidity Nabali-Baladi Olive Oil Quality
 Abstract
 Reference
 Full-Text PDF
 Full-text HTML
Orwa Jaber Houshia1, Oday Zaid2, Hazem Shqair2, Motasem Zaid2, Nashida Fashafsheh1, Reeman Bzoor1
1Arab American University, P.O. Box 240, Jenin, Palestine
2National Agricultural Research Center (NARC), Jenin, Palestine
Correspondence to: Orwa Jaber Houshia, Arab American University, P.O. Box 240, Jenin, Palestine.
| Email: |  |
Copyright © 2014 Scientific & Academic Publishing. All Rights Reserved.
The purpose of the study was to evaluate the effects of olive oil adulteration on the peroxide value and oil acidity, and also to evaluate the effects of the olive oil adulteration on the delta K value, which classifies the purity (grade) of olive oil. The study was begun by collecting several samples of olive oil from northern governorates of Palestine. Also, sunflower, corn, and soybean oil samples were purchased at the local market. Olive oil simples were analyzed for delta K value, peroxide value and acidity. Olive oil samples were analyzed at 232, 268, 270 and 274 nm using UV-VIS instrument. Then, the samples were mixed with other oils at certain ratios and evaluated at the same wavelength. All samples were analyzed using quartz cuvetts. Cyclohexane was used as solvent for the oil. The same samples were evaluated in the same manner by titrating the samples with thiosulfate to get the peroxide value, and also with potassium hydroxide to get the acidity of oils. The IOC standard is ﹤b20 mEq O2 / kg oil. The acidity test (the IOC standard for free fatty acids in extra virgin olive oil is a maximum of 0.8%.) can differentiate between authentic versus adulterated oil. Reliable technique was used for measuring the authenticity of olive oil.
Keywords: Nabali Baladi, Olive Oil Adulteration, Peroxide Value, Acidity, Delta K
Cite this paper: Orwa Jaber Houshia, Oday Zaid, Hazem Shqair, Motasem Zaid, Nashida Fashafsheh, Reeman Bzoor, Effect of Olive Oil Adulteration on Peroxide Value, Delta-K and on the Acidity Nabali-Baladi Olive Oil Quality, Advances in Life Sciences, Vol. 4 No. 5, 2014, pp. 235-244. doi: 10.5923/j.als.20140405.04.
Article Outline
1. Introduction
- Olive oil is one of the oldest known vegetable oils mainly produced in the countries surrounding the Mediterranean Sea. It is a natural fruit juice, obtained from the fruit of the Olive tree, with a unique composition and quality. Olive oil is an integral part of the Palestinian economy. About 95% of the olives picked in the Palestinian territories is converted to olive oil, most of which is exported internationally. Olive oil plays an essential part of the Palestinian and the Mediterranean diet. This oil has several complex chemical components. The composition of olive oil can give valuable information in understanding their functional, quality and nutritional properties. The main type of fat found in all kinds of olive oil is monounsaturated fatty acids (MUFAs). MUFAs are actually considered a healthy dietary fat. If your diet emphasizes unsaturated fats, such as MUFAs and polyunsaturated fats (PUFAs), instead of saturated fats and Trans fats, you may gain certain health benefits. Olive oil is one of the very few oils that can be consumed in its natural form, thus preserving all its natural constituents [1, 2].Olive oil is well established in the food industry. Demand continues to grow not only because of its distinct flavor, but also because of an increased awareness of its health benefits. The increase in the world price of olive oil compared to other vegetable oils make it Susceptible to fraud commonly adulteration with cheap vegetable oils [3]. For this, the International Olive oil Council (IOC) placed strict criteria for olive oil classifications by chemical, sensory and organoleptic properties [4-6]. Thus, Olive oil types [7] can be also classified as: • Extra virgin olive oil: virgin olive oil with a free acidity, expressed as oleic acid, of not more than 0.8 grams per 100 grams. • Virgin olive oil: virgin olive oil with a free acidity, expressed as oleic acid, of not more than 2.0 grams per 100 grams. • Ordinary virgin olive oil: virgin olive oil with a free acidity, expressed as oleic acid, of not more than 3.3 grams per 100 grams. • Refined olive oil: olive oil obtained from virgin olive oils by refining methods which do not lead to alterations in the initial glyceridic structure. It has a free acidity, expressed as oleic acid, of not more than 0.3 grams per 100 grams.There are several methods of analysis that have been proposed and are used to evaluate the unique olive oil composition and quality. The detection of olive oil adulteration is often complicated with no single test that can accomplish the task. A series of tests are employed to determine Olive oil authenticity, quality and identity of the adulterant. Included in this testing method is the determination of free acidity, peroxide value, UV extinction, fatty acid composition, and the Bellier test. Test results are measured against the International Olive Council trade standard to identify abnormalities. Each test provides key information which allows a decision to be made with respect to the grade of Olive oil and the identity of any adulterants [8].Previous researchers were able distinguish adulterated olive oil from extra virgin olive by using 31P NMR [9], however Spectrophotometric examination in the ultraviolet can provide information on the quality of a fat. The absorption at the wavelengths specified in the method is due to the presence of conjugated diene and triene systems. These absorptions are expressed as specific extinctions E1% (the extinction of 1% solution of the fat in the specified solvent, in a thickness of 1 cm) conventionally indicated by K (also referred to as "extinction coefficient". A low absorption in this region is indicative of a high quality extra virgin olive oil, whereas adulterated/refined oils show a greater level of absorption in this region. Hence arose the idea of our research based on the study of changes in the values of absorption for pure virgin olive oil with a certain mixed percentage of vegetable oils at 232 nm spectrophometrically. And in the ultraviolet domain nm, 270 nm (270nm rate of change in the values of absorption a) and to determine ΔK value by measuring the absorbance at 266nm, and the 274 nm in order to determine the lowest rates of cheating vegetable oil until it is exposed.
2. Methodology
- Three samples were purchased for each of the extra virgin olive oil, sunflower oil, corn oil, Soybean oil and cottonseed oil randomly from the local markets and different sources, taking into account the availability of brands and the shelf life on the package. Pure olive oil were from Jalboon and Kefret areas from the westbank.Adulterated samples of pure olive oil mixed with corn, soy, sunflower oil, were made at these percentages: 5%, 10%, 20%, 30%, and 40%. And a sample of pure olive oil 0% adulteration to serve as a reference. Samples well-kept in a dark place and in airtight containers until the end of the analysis.Delta (Δ) k is evaluated using the following formula:
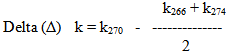 Where:
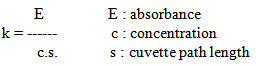 R-value was calculated = k232nm/k270nm
2.1. Spectrophotometric Measurements
- Perkin-Elmer spectrophotometer with ability measuring extinction in the ultraviolet between 220 and 360nm. Rectangular quartz cuvetts, with covers, having an optical length of 1 cm were used. The method is most often used in a quantitative way to determine concentrations of an absorbing species in solution, using the Beer-Lambert lawOlive oil samples (50 in total) were diluted in cyclohexane. All samples were measured in matched, synthetic fused silica cuvettes (10 mm is the recommended path length). Weigh accurately 0.25 g of the sample so prepared into a 25 ml graduated flask, make up to the mark with the solvent specified and homogenize. The resulting solution must be perfectly clear. If opalescence or turbidity is present, filter quickly through paper. Fill a cuvette with the solution obtained and measure the extinctions at an appropriate wavelength a 232, 266, 270 and 274 nm, using the solvent used as a reference.
2.2. Peroxide Value
- Quantity of those substances in the sample, expressed in terms of active oxygen, which oxidize potassium iodide under the conditions specified in this International Standard, divided by the mass of the test portion. Add 50 ml of acetic acid/isooctane solution to 10g of oil in conical flask and replace the stopper. Swirl the flask until the sample has dissolved. Using a suitable volumetric pipette, add 0.5 ml of saturated potassium iodide solution and replace the stopper. Allow the solution to react for 1 min, thoroughly shaking it at least three times during this period, then immediately add 30 ml of distilled water. Titrate the solution with sodium thiosulfate solution, adding it gradually and with constant, vigorous agitation, until the yellow iodine color has almost disappeared. Add about 0.5 ml of starch solution and continue the titration with constant agitation, especially near the endpoint, to liberate all of the iodine from the solvent layer, adding the sodium thiosulfate solution drop by drop until the blue color just disappears.
2.3. Acidity Value
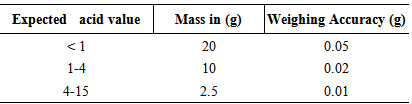
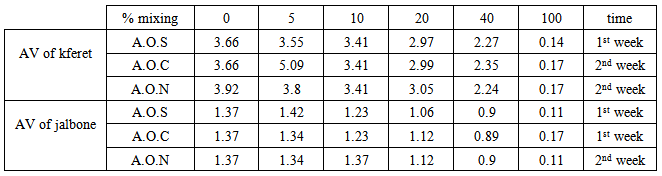
- Weigh into a flask a sufficient mass of the test sample as shown in Table 1, according to the color and expected acid value. NOTE: The mass of the test portion and the concentration of the titrate should be such that the titrate does not exceed 10 ml.
|
3. Results and Discussion
- The quality of the olive oil is studied by measuring the characteristics of the absorption bands between 200 and 300 nm. These are frequencies related to conjugated diene and triene systems. A low absorption in this region is indicative of a high quality extra virgin olive oil, whereas adulterated/refined oils show a greater level of absorption in this region. The absorbency at 232 nm is caused by hydroperoxides (primary stage of oxidation) and conjugated dienes (intermediate stage of oxidation). The absorbency at 270 nm is caused by carbonylic compounds (secondary stage of oxidation) and conjugated trienes (technological treatments). The index “(Δ) k” is a criterion of discrimination between a bad quality virgin olive oil and a virgin olive oil adulterated with refined olive oil. The degree of oxidation of olive oil is reflected by its specific extinction at 232 nm and 270 nm. In fact, virgin olive oils, of good quality and correctly stored, contain very few products of oxidation; these mainly peroxidic in nature, have a maximum absorption at approximately 232 nm. The values of “(Δ) k”, at 232 and 270 nm in such olive oils are below the maximum provided for in the standard. On the other hand, when the oil is treated with a decolorizing agent (i.e. an absorbent earth) during the refining process, conjugated trienoic compounds are formed. These compounds have a maximum absorption situated at approximately 270 nm; this means that refined oils have higher values of “k” at 270 nm. The absorption in the U.V. is related to the presence of conjugate double bonds. In the oils, due to oxygen fixation in linolenic and linoleic acids’ double bond position, hydroperoxides arise. The double bond nature that we can obtain provoke the formation of conjugate diene systems between carbon atoms.
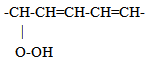 This kind of conjugate systems presents a maximum absorption at 232 nm wavelength. Instead, during more advanced oxidation states, products are generated with conjugate diene systems carbon-oxygen like:
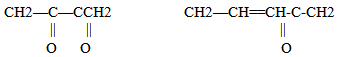 The maximum absorption in this case ranges between wavelength of 260/280 nm. A conjugate triene system presents a triple band with a maximum absorption at 268 nm and another at 232 nm. The absorption curve in the U.V. of oil is very much influenced by the "oxidation" products, some of which provoke an increase of the absorption at 232 nm and others at 270 nm. This curve is called Delta (Δ) k and is part of the fundamental analysis that we conducted to establish the purity and degree of degradation of an oil Delta (Δ) k correlates with the state of oxidation by detecting specific oxidized compounds, some generated from secondary oxidation, and also detect possible adulteration with refined oils. Oxidation produces peroxides from some fatty acids. Autoxidation (when the oil gets in contact with oxygen in the air, first during the milling process, and later on during storage in tanks and bottles) is the most common process leading to oxidative deterioration and is defined as the spontaneous reaction of atmospheric oxygen with lipids. [10]Peroxides are unstable compounds which are further oxidized to yield volatile and non-volatile components that give rise to off-flavors and undesirable aromas in the oil. This is referred to as secondary stage oxidation. Oxidation is accelerated at higher temperatures, which is called thermal oxidation, with increases in free fatty acid and polar matter contents, foaming, color, and viscosity [11]. The autoxidation and thermal oxidation of unsaturated fatty acids occurs via a free radical chain reaction that proceeds through three steps of initiation, propagation, and termination. A simplified scheme explaining the mechanism of autoxidation is shown in Figure 1.
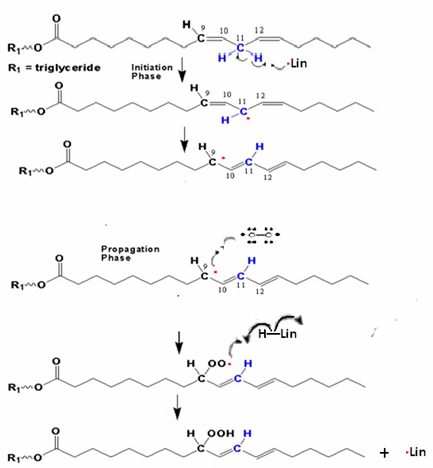 | Figure 1. Proposed mechanism of autoxidation |
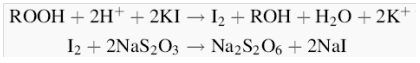 | Figure 2. Chemical reactions involved in iodometric titration of olive oil |
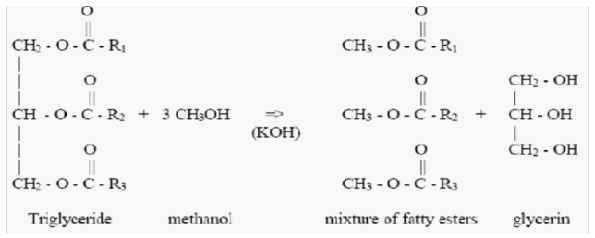 | Figure 3. Oil hydrolysis with KOH |
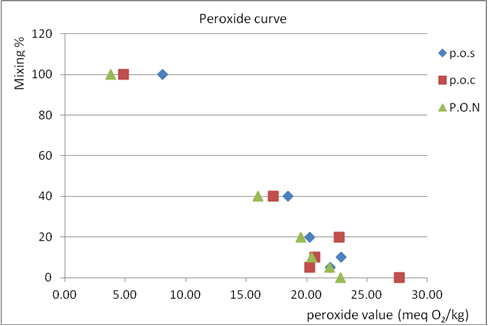 | Figure 4. Peroxide value of % mixing of olive oil with three type vegetable oil: PON = soy oil, POC = corn oil, POS = sunflower oil. Kferet samples |
|
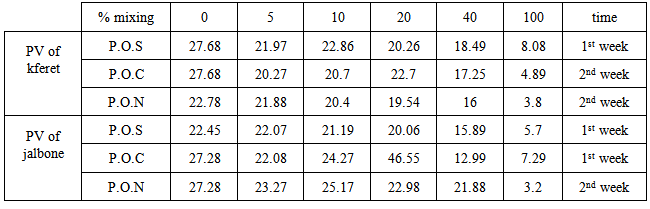
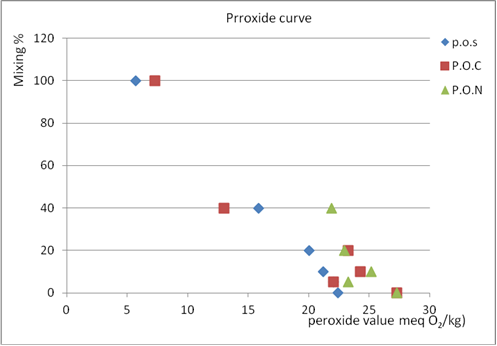 | Figure 5. Peroxide value of % mixing Jalboon olive oil with three type mixing oil |
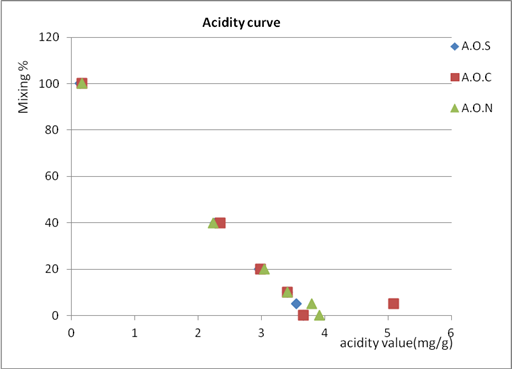 | Figure 6. Acidity value of % mixing olive oil from Kferet village for three mixing oil |
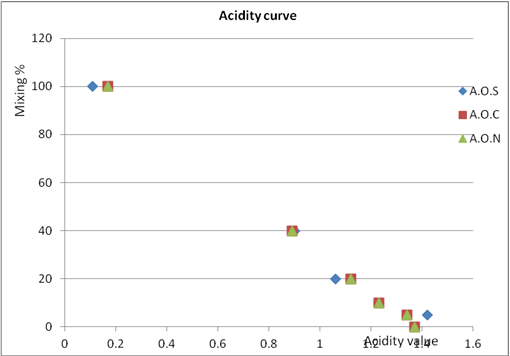 | Figure 7. Acidity value of % mixing Jalbone olive oil with three type mixing oil |
|
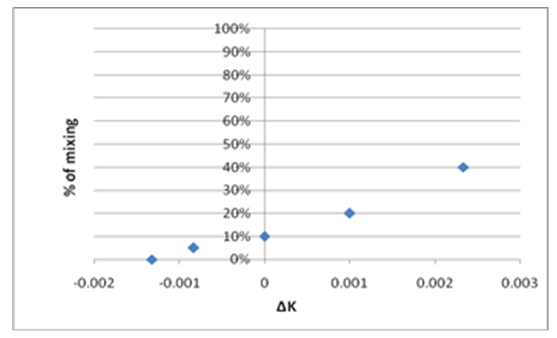 | Figure 8. Percent adulteration verses Delta-K |
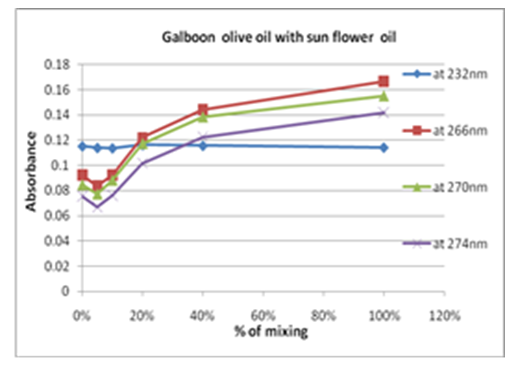 | Figure 9. Percent olive oil mixing with sun-flower oil verses change in absorbance |
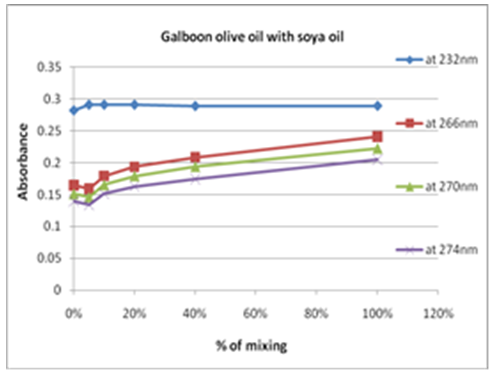 | Figure 10. Percent olive oil mixing with soy-bean oil verses change in absorbance |
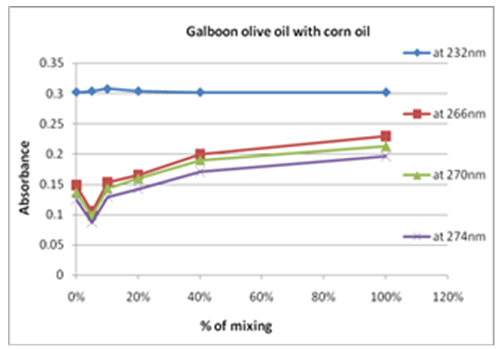 | Figure 11. Percent olive oil mixing with corn oil verses change in absorbance |
4. Conclusions
- The index ∆k is very important to distinguish between bad quality origin olive oil and origin olive oil adulterated with refined olive oil.From the results, when the percent of mixing olive oil with other oils increase, delta k increase, and the absorbance at 232 nm at all percent of mixing is nearly the same with slightly difference so it can't used to know if the oil is adult or not, but at the other percents the absorbance increase as the percent increase except at 5% it decrease so these wavelength can used them to know if the oil is adult or not but above 5%.It appear that mixing olive oil with other oil had no significant effect to improve these tests to detect the adulteration, because at small % mixing the value of peroxide and acidity value did not give a clear result about the adulteration or quality of olive oil because it near from the 0% result, and at higher % mixing it didn’t give the real quality of oil because as mixing % increase peroxide and acidity value decrease, and that what told by curves, which show that mixing olive oils actually improves peroxide and acidity, so we can’t depend on these test by 100% to judged the quality of olive oil.
ACKNOWLEDGEMENTS
- The authors would like to thank the AAUJ chemistry undergraduate students and NARC scientists for their collaboration and team work.