-
Paper Information
- Paper Submission
-
Journal Information
- About This Journal
- Editorial Board
- Current Issue
- Archive
- Author Guidelines
- Contact Us
Advances in Life Sciences
p-ISSN: 2163-1387 e-ISSN: 2163-1395
2014; 4(5): 227-234
doi:10.5923/j.als.20140405.03
Modeling of ASFRs and Study the Reproductivity of Women of Urban Area in Bangladesh
 Abstract
 Reference
 Full-Text PDF
 Full-text HTML
Md. Rafiqul Islam
Professor and Ex-Chairman, Dept. of Population Science and Human Resource Development, Rajshahi University, Bangladesh
Correspondence to: Md. Rafiqul Islam , Professor and Ex-Chairman, Dept. of Population Science and Human Resource Development, Rajshahi University, Bangladesh.
| Email: |  |
Copyright © 2014 Scientific & Academic Publishing. All Rights Reserved.
Reproductivity of women in population studies, especially in demography, is actually interrelated to the coverage to which a group of married women is substituting its own quantity by natural process. The purpose of this study is to observe the trends and patterns of reproductivity of women of urban area in Bangladesh during the period 1985-1998 and to fit some mathematical models to ASFRs, forward and backward cumulative ASFRs for the year 1985 only. For this study, the secondary data of age specific fertility rates (ASFRs) at different points of time are used. In this study, total fertility rate (TFR), gross reproduction rate (GRR), net reproduction rate (NRR), reproduction survival ratio (RSR) and mean age of childbearing (MAC) of urban area in Bangladesh have been estimated to see the trend of reproductivity of women. In this study, model validation technique, cross validity prediction power (CVPP) and F-test, have been applied to these models to check the validity and significance of the models respectively. It is observed that these parameters exhibit declining trend. But, RSR has been showing increasing trend over time. It is found that ASFRs and its backward cumulative distribution follow cubic polynomial model but its forward cumulative distribution follows quadratic polynomial model explaining large proportion of variation in three cases. The statistics of F-test show that all the fitted models are highly significant. Moreover, the shrinkage coefficients indicate that all the fitted models are fit well.
Keywords: Age specific fertility rates (ASFRs), Total fertility rate (TFR), Linear interpolation, Polynomial model, Coefficient of determination (R2), Cross validity prediction power (CVPP), Shrinkage coefficient, F-test
Cite this paper: Md. Rafiqul Islam , Modeling of ASFRs and Study the Reproductivity of Women of Urban Area in Bangladesh, Advances in Life Sciences, Vol. 4 No. 5, 2014, pp. 227-234. doi: 10.5923/j.als.20140405.03.
Article Outline
1. Introduction
- In this study, it is to be memorized that reproductivity of women in population studies, particularly in demography, is interconnected to the extent to which a group of married women is replacing its own number by natural process. Indeed, measures of reproductivity of women are the measures of natural increase expressed in terms of a generation rather than a calendar year or other short length of time. The group may be a synthetic or a true birth or marriage cohort of women in the study. Sometimes, some measures on an annual, instead of a generation basis, are treated simple measures of reproductivity of women (Shryock et al., 1975). The reproduction rates of women have only been enumerated from current vital statistics. For this, it is to be deemed that the fertility of women in, say, 30 or 35 successive years of age in the reproductive span of women in a single calendar year could be summed to approximate the fertility and reproductivity of an actual cohort of women passing through the reproductive span of life. Kabir and Uddin (1987) found that ASFRs of Bangladesh was increasing during 1953-1974 and then, started to decrease up to 1986. They also found that TFR of Bangladesh was also increasing up to 1974 and then, began to reduce up to 1986. Islam (1996) submitted a Ph. D. thesis in the department of Statistics at Rajshahi University in which it was seen that ASFRs and TFR were showing increasing trend in the interval between 1961 and 1974 and then, started to decrease up to 1991. Islam and Ali (2004) reported that all the parameters of reproductivity, that is, TFR, GRR, NRR were showing decreasing trend but RSR was showing monotonically increasing trend.The measures of reproductivity of women can be utilized to assess the fertility behaviour of women of an area or any sub-region or any country. The present piece of work has been mainly concentrated to investigate the reproductivity of women of urban community in Bangladesh. Furthermore, in this study, mathematical modeling is considered to study the pattern of ASFRs of urban region in Bangladesh. For this, to do so, polynomial model is chosen to fit the model for ASFTs. It is mentioned that polynomial model was used in several studies (Islam, 2004a; 2004b; 2005; 2007a and 2011; Islam et al., 2004 and 2014; Islam and Sabbir, 2014a and 2014b).Thus, the objectives of this study are addressed below:i) to study the trend and pattern of age specific fertility schedules,ii) to compute the various measures of reproductivity of women and observe their trends, andiii) to fit some mathematical models to ASFRs, forward and backward cumulative ASFRs for the year 1985. This paper is structured as follows. Data and data sources of this study are presented in section 2. Section 3 describes the methods and methodological issues in different estimating techniques of fertility and reproductivity of women, model fitting, model validation, F-test and velocity are discussed. Results and discussion are reported in section 4. Finally, section 5 concludes the conclusion of the manuscript.
2. Data and Data Source
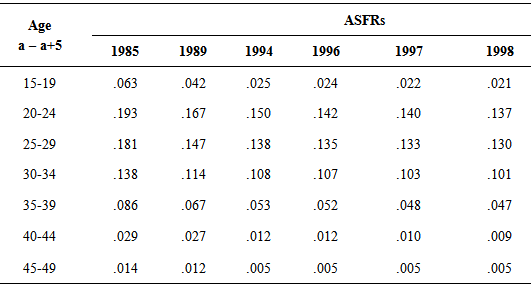
- A secondary data on ASFRs of women of urban area in Bangladesh at different points of time during 1985-1998 have been taken from Statistical Year Book of Bangladesh of 1986, 1998 and 1999 (BBS, 1986, 1999, 2001) which is shown in table 1.
|
3. Methods and Methodological Issues
3.1. Different Estimating Techniques of Fertility as well as Reproductivity of Women
- Total fertility rate has been estimated using the traditional formula of
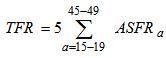 under usual assumptions from the above secondary data which can be approximated by
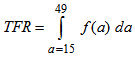 Gross reproduction rate (GRR) of women is estimated using the following formula:
 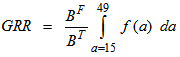 which can be approximated as
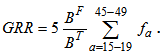 where
where  is the proportion of all births which are female and
  is the ASFRs at the age group ‘a to a +5’ in the reproductive ages of women. To estimate GRR, the sex ratio at birth is taken for the corresponding calendar years from the same sources.Net reproduction rate (NRR) of women is estimated using the formula
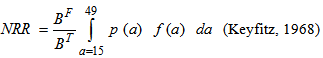 which can be approximately estimated as
  where
where  is the ASFRs at age ‘a’ or age group ‘a to a+5’ and p(a) is the probability of surviving from birth to age a. Note that to obtain life table female stationary population for the years 1985, 1989, 1994, 1996, 1997 and 1998, the
  values for the corresponding years have been taken from the Statistical Year Book of Bangladesh of 1986, 1998 and 1999. South Asian Model Life Tables have been selected from United Nations Model Life Tables for Developing Countries (UN, 1982). Here, linear interpolation technique (UN, 1983) has been employed to estimate female stationary population for the years 1985, 1989, 1994, 1996, 1997 and 1998 for the corresponding life expectancy at birth.The mean age of childbearing (MAC) of women can be expressed as
 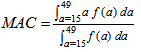 which can be approximately estimated by
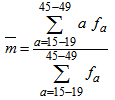 where ‘a’ represents the mid-point of each age group ‘a to a+5’ in the reproductive span and
  represents an ASFRs in the same age group. It should be noted that in the population of high fertility, the MAC is usually high. On the other hand, in low fertility population the MAC is lower (Misra, 1995) Reproduction survival ratio (RSR) has been approximately estimated using the formula
  where f(a) is the ASFRs in the age group ‘a to a+5’ and p(a) is the probability of surviving from birth to age a. RSR is the proportion of potential reproductivity that survives the effects of mortality. These are demonstrated in table 2.
 3.2. Model Fitting
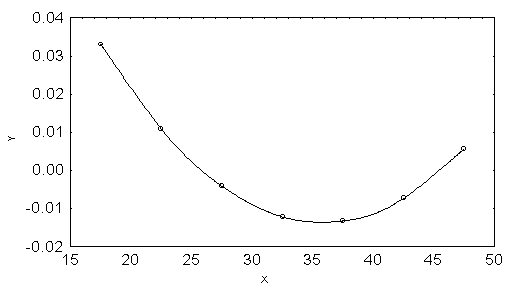
- A) Using the scattered plot of ASFRs by age group in years in urban area of Bangladesh in 1985 (Fig.1), it seems that ASFRs can be fitted by polynomial model with respect to different ages in year. Therefore, an nth degree polynomial model is considered and the form of the model is
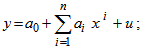 where, x is the mean value of the age group; y is ASFRs;
  is the constant;
  is the coefficient of
  and u is the disturbance term of the model. Here a suitable n is found out for which the error sum of square is minimum.
 | Figure 1. Observed and Fitted Model of ASFRs in Urban Area of Bangladesh in 1985. X: Age Group in Years and Y: ASFRs |
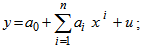 where, x is the average value of the age group; y is forward cumulative ASFRs;
  is the constant;
  is the coefficient of
  and u is the disturbance term of the model. A suitable n is selected such that the error sum of square is lowest.
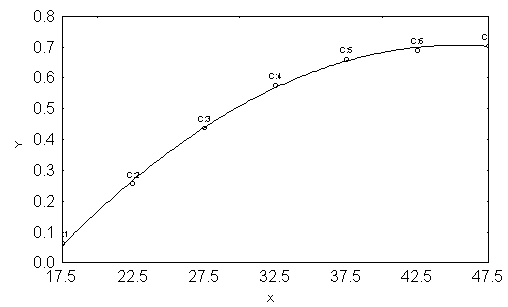 | Figure 2. Observed and Fitted Model of Forward Cumulative ASFRs in Urban Area of Bangladesh in 1985. X: Age Group in Years and Y: Forward Cumulative ASFRs |
 where, x is the mean value of the age group; y is backward cumulative ASFRs;
  is the constant;
  is the coefficient of
  and u is the disturbance term of the model. Here a suitable n is chosen so that the error sum of square is lowest.
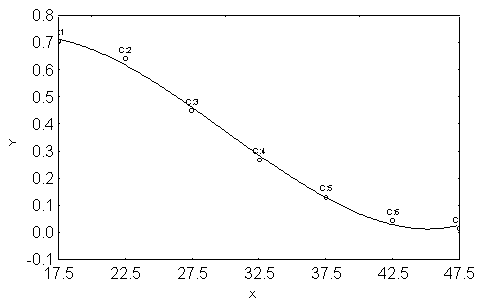 | Figure 3. Observed and Fitted Model of Backward Cumulative ASFRs in urban Area of Bangladesh in 1985. X: Age Group in Years and Y: Backward Cumulative ASFRs |
3.3. Model Validation Technique
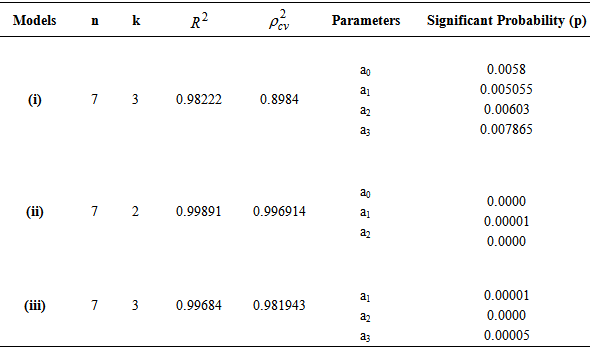
- To check how much these models are stable over the population, the cross validity prediction power (CVPP),
 , is applied. Here,
  where, n is the number of cases, k is the number of predictors in the model and the cross validated R is the correlation between observed and predicted values of the dependent variable (Stevens, 1996). The shrinkage coefficient of the model is the positive value of
  ; where
 is CVPP and R2 is the coefficient of determination of the model. 1-shrinkage is the stability of R2 of the model. The information on model fitting and estimated CVPP has been demonstrated in table 3. This technique is also used as model validation technique (Islam, 2007b; 2008; 2012a; 2012b; 2013; Islam & Hossain, 2013a; 2013b; Hossain & Islam, 2013; Islam et al., 2013).
3.4. F-test
- To verify the measure of the overall significance of the model as well as the significance of R2, the F-test is employed here. The formula for F-test is given below:
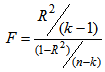 where k = the number of parameters is to be estimated, n = the number of cases and R2 is the coefficient of determination in the model (Gujarati, 1998).
3.5. Velocity
- Let y = f(x) be a function of x. Then, the velocity curve of y with respect to x is denoted by
 and is defined by
 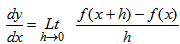 That is, velocity is the rate of change of y with respect to x (Loney, 1990)
4. Results and Discussion
- Table 1 represents the ASFRs in urban area of Bangladesh at various points of time from 1985 to 1998. To see the trend and pattern of fertility schedules, the data have been presented in graph paper shown in Fig. 4. It is found from the figure that all the fertility schedules are showing the traditional (reciprocal of V-shape) pattern. It is observed that with passing of time the peaks of the curves are showing a declining trend of fertility. It is also seen that the highest ASFRs in the age group 20-24 years are 193, 167, 150, 142, 140 and 137 per thousand for the years 1985, 1989, 1994, 1996, 1997 and 1998, respectively where as the corresponding lowest ASFRs are 14, 12, 5, 5, 5 and 5 per thousand in the age group 45-49 years. From the above observation, it is found that the age interval 20-24 years is the most fertile period and the age interval 45-49 years is the least fertile period in the reproductive ages of women in urban area of Bangladesh.
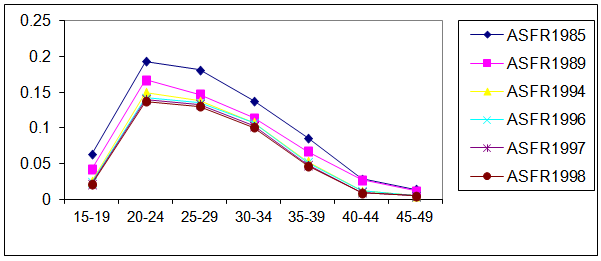 | Figure 4. The ASFRs in Urban Area of Bangladesh at Different Points of Time During 1985-1998 |
|

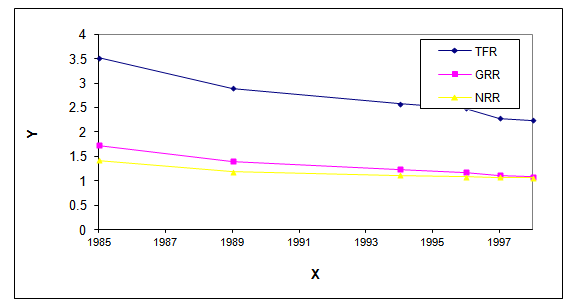 | Figure 5. The TFR, GRR, NRR in Urban Area of Bangladesh at Different Points of Time During 1985-1998. X: Years and Y: Rates |
 | (1) |
 = 0.8984.Again, another polynomial model is assumed for forward cumulative ASFRs of urban area of Bangladesh in 1985 and the fitted equation is as
  | (2) |
 is 0.996914Again, another polynomial model is assumed for backward cumulative ASFRs of urban area of Bangladesh in 1985 and the fitted equation is
 | (3) |
 =0.981943. It is to be mentioned here that the constant term is kept out in this model because of the insignificance of the parameter.It should be noted here that the usual models, i. e. Gompertz, Makeham and logistic models were also applied but seem to be worse fitted with respect to their shrinkages. Therefore, the results of those models were not displayed here.From this table 3 we see that all the fitted models (i), (ii) and (iii) are highly cross validated and their shrinkages are 0.08382, 0.002546 and 0.014897, respectively. These imply that the fitted models (i), (ii) and (iii) will be stable more than 89% 99% and 98%, respectively. Moreover, table 3 reveals that all the parameters of the fitted model (i) are significant with more than 98% of variance explained. But, all the parameters of the fitted models (ii) and (iii) are highly significant with more than 99% of variance explained.
|
 | Figure 6. The Velocity Curve for ASFRs in Urban Area of Bangladesh in 1985. X: Age Group in Years and Y: Velocity |
5. Conclusions
- In this study, ASFRs of women at different points of time in urban area of Bangladesh show the declining trend and follows the traditional pattern, that is, reciprocal of V-shape form. The parameters TFR, GRR, NRR of reproductivity of women have been gradually decreasing up to 1998. MAC is more or less constant during 1985-1998. Moreover, RSR has been strictly increasing during the study period. The ASFRs and its backward cumulative distribution follow cubic polynomial models but the constant term in the model of backward cumulative distribution of ASFRs is kept out because of the insignificant of the parameter. On the other hand, forward cumulative distribution of ASFRs follows quadratic polynomial model.