-
Paper Information
- Next Paper
- Paper Submission
-
Journal Information
- About This Journal
- Editorial Board
- Current Issue
- Archive
- Author Guidelines
- Contact Us
Advances in Life Sciences
p-ISSN: 2163-1387 e-ISSN: 2163-1395
2014; 4(5): 213-219
doi:10.5923/j.als.20140405.01
Pattern of Multiple Antibiotics Resistance among Surface Water Escherichia coli
 Abstract
 Reference
 Full-Text PDF
 Full-text HTML
Ogochukwu A. Agwu, Theresa O. Oluwagunke
Department Department of Biological Oceanography, Nigerian Institute for Oceanography and Marine Research, P.M.B. 12729, Victoria Island, Lagos, Nigeria
Correspondence to: Ogochukwu A. Agwu, Department Department of Biological Oceanography, Nigerian Institute for Oceanography and Marine Research, P.M.B. 12729, Victoria Island, Lagos, Nigeria.
| Email: |  |
Copyright © 2014 Scientific & Academic Publishing. All Rights Reserved.
In this study, all (100%) the E. coli isolated were susceptible to gentamicin and a few (1%) resisted nitrofurantion. However, a good percentage (96and 88) of the isolates resisted amoxicillin and augumentin respectively. Nevertheless, multiple antibiotics resistance (MAR) was observed among these E. coli isolates. Apart from the negligible number (0.63%) of the isolate which were susceptible to all the tested antibiotics, along with 0.63 and 3.1% which resisted only cotrimoxazole and amoxicillin respectively, all the other isolates resisted two to six of the antibiotics tested. These corresponded to MAR values of between 0 and 0.75. The pattern of antibiotic resistance varied considerably with a total of six R-types of resistance patterns being encountered during this study. Each sampling period had multiple resistance patterns which ranged from 4 to 10. The R4-type resistance pattern was the most common, with approximately 25 and 14% of the isolates exhibiting the Cot-Amx-Tet-Aug and Cot-Amx-Aug-Nal patterns respectively. A few of the antibiotic resistance pattern were peculiar to sampling periods while some were present majority of the time. These findings further confirm the occurrence of multiple antibiotic resistances among the surface water E. coli. Also, the observed differences in the antibiotic resistance pattern during the sampling period suggests variation in the sources of contamination and these are most probably from ‘high risk’ sources. The strategic position of this sampling point warrants subsequent transfer of these antibiotic resistant isolates into the open Ocean, the influx of these bacteria which serve as reservoirs of antibiotic resistance genes into the Ocean is of great environmental and public health importance.
Keywords: Fecal pollution, Antibiotic resistance, Enteric bacteria, Lagos Lagoon
Cite this paper: Ogochukwu A. Agwu, Theresa O. Oluwagunke, Pattern of Multiple Antibiotics Resistance among Surface Water Escherichia coli, Advances in Life Sciences, Vol. 4 No. 5, 2014, pp. 213-219. doi: 10.5923/j.als.20140405.01.
Article Outline
1. Introduction
- The increasing human development in coastal areas continues to elevate contamination of surface waters with treated and untreated sewage from both point sources such as industrial and municipal effluents and nonpoint sources such as land runoff and septic tank seepage. The contaminations from agricultural and human sources introduce fecal matter which is of significant public health risk, as a result of the probable presence of pathogenic bacteria, protozoa and viruses [1-4].The detection of Escherichia coli is widely used as a microbiological indication of fecal contamination in food and water. This bacterium is an important member of bacterial family, Enterobacteriaceae, the enteric bacteria. It is a normal flora of human and other warm-blooded animals; it is therefore, abundant in their feces. Consequently, its presence in food or water commonly indicates direct or indirect fecal contamination and probable presence of enteric pathogens. This organism is capable of surviving for months outside the colon and so is ubiquitous in the environment. E. coli has also been shown to be a significant reservoir of genes coding for antimicrobial drug resistance and therefore is a useful indicator for resistance in bacterial communities [5-9]. Antibiotic resistant E. coli has been isolated from numerous environments including rivers, lakes, seawater, coastal areas, domestic sewage, surface water and sediments, drinking water and hospital environments [1]. According to Krumperman [5], the presence or absence of a multiple antibiotic resistant (MAR) E. coli, in the environment will rightly provide more significant information for the environmental assessment and identification of contamination from high-risk sources. In other words, the use of MAR intends to supplement the arbitrary numeric assessment of environmental pollution risk assessment.The antibiotic resistance of the Enteric organisms and heterotrophic bacteria of some parts of Lagos lagoon had earlier been reported [10, 11]. However, for a better understanding of the public health risk posed by the fecal pollution of this water body, this work intends to specifically determine the presence of multiple antibiotic resistant E. coli and further establish the temporal variation of the existent antibiotics resistance pattern at the Commodore Channel (part of Lagos Lagoon complex).
2. Materials and Methods
2.1. Sampling
- The Jetty of Nigerian Institute for Oceanography and Marine research from where the water samples were collected is located along the Commodore Channel (Figure 1). This is a highly strategic part of Lagos Lagoon; it connects the Lagoon to the Atlantic Ocean. The Commodore Channel also serves as the entrance to Nigeria’s largest harbors of Apapa and Tincan. It borders the westernmost extremity of this coastal complex and is dredged annually for safe navigation of vessels into the country [12].
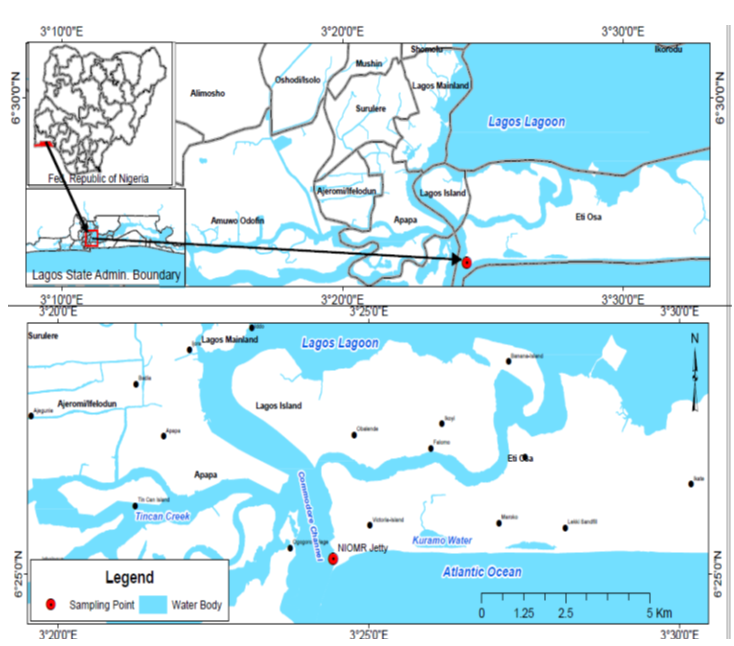 | Figure 1. Map of study area showing the sampling station |
2.2. Isolation and Identification of E. coli
- After appropriate serial dilutions in buffered peptone, aliquots (0.1ml) of the water samples were inoculated into Lauryl sulphate broth and incubated at 37℃ for 18 to 24 h. Subsequently, tubes which indicate sugar fermentation by gas production are selected, and then streaked out on eosin methylene blue agar plates. These culture plates were also incubated at 37℃ for 24 h. Metallic green colonies on eosin methylene blue agar plates were randomly picked, purified and stored on nutrient agar slants for further analysis. Each of the isolates was identified by Gram reaction and also on the basis of indole production, methyl red, Voges-Proskauer and citrate utilization (IMViC) test.
2.3. Antibiotic Susceptibility Testing
- A total of one hundred and sixty eight E. coli isolates were tested for their susceptibility to eight antibiotics using the disk diffusion method. Pure cultures of the isolates were initially grown on tryptone soy broth and antibiotic susceptibility testing was done on Muller Hilton agar as earlier described by Agwu [11]. The antibiotics used with the specific concentrations include: augumentin (30µg); oflaxacin (5µg); gentamicin (10µg); nalidixic acid (30µg); nitrofurantoin (200µg); cotrimoxazole (25µg); amoxycillin (25µg) and tetracycline (25µg).
3. Results
3.1. Physico-chemical Parameters of Water Samples
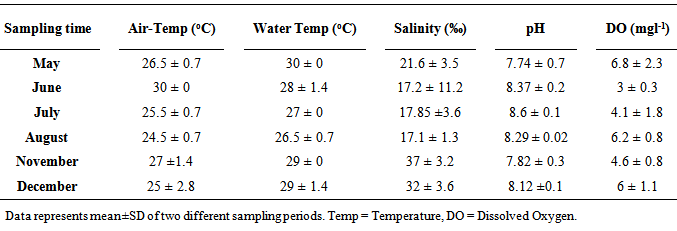
- The average air temperature at the sampling point was between 24 and 30℃, while the surface water temperature ranged from 27 to 30℃ (Table 1). There was no marked difference in the salinity values (17.2, 17.85 and 17.1‰) observed in June, July and August. The highest salinity (37‰) during this study was noted in November, meanwhile, the values recorded in May (21.6‰) and December (32‰), were also high. The pH of the surface water ranged between 7.74 and 8.6. On the other hand, the concentration of dissolved oxygen was between 3 and 6.8 mgl-1.
|
3.2. Antibiotic Resistance of E. coli Isolates
- An outstanding number (96 and 88%) of the E. coli isolates resisted amoxicillin and augumentin (Figure 2). Also, approximately 65, 50 and 33% of the organisms were resistant to cotrimoxazole, tetratcycline and nalidixic acid respectively. On the contrary, all isolates were susceptible to gentamycin, while only 1 and 9% resisted nitrofurantion and oflaxacin respectively.
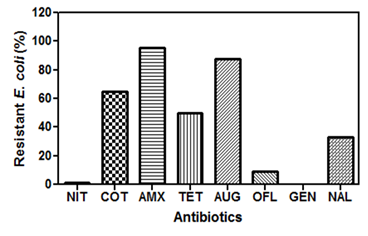 | Figure 2. Percentage of the E. coli isolates resistant to specific antibiotic during the study. NIT = nitrofurantion, COT = cotrimoxazole, AMX = Amoxycillin, TET = Tetracycline, AUG = Augumentine, OFL = Oflaxacin, GEN = gentamicin and NAL = nalidixic acid |
3.3. Temporal Variations of the Surface Water E. coli Multiple Antibiotic Resistance (MAR)
- The E. coli isolates in this study exhibited multiple antibiotic resistances and the MAR index observed varied during the six sampling periods (Figure 3). In May (Figure 3A), 56% of the isolates resisted four of the eight antibiotics tested, this corresponded to a MAR index of 0.5. The other four MAR index values (0.13, 0.25, 0.38 and 0.63) had approximately 6, 17, 17 and 7% of the organisms respectively. During the June sampling event (Figure 3B), only four (0.13, 0.25, 0.38 and 0.5) MAR index values were noted and majority (53%) of the isolates had MAR index of 0.5. A very high MAR index value of 0.75 was recorded during the last four sampling events (Figure 3 C, D, E, and F). The E. coli isolates from the month of August (Figure 3D), exhibited exceptional antibiotic resistance, a total of seven MAR index values was noted, nevertheless, about 2% of the isolates were susceptible to all the antibiotics tested. Meanwhile, some (20 and 4%) resisted most of the antibiotics and so had MAR index of 0.75 and 0.63. Also, the maximum percentage (26%) of isolates had MAR index value of 0.38, whereas 22, 13 and 4% of organisms had MAR index of 0.5, 0.25 and 0.13 respectively. The same MAR index values were noted for the isolates from July (Figure 3C) and November (Figure 3E) although the percentage of organisms for each MAR index varied. The highest percentage (39%) of the organisms from July sampling had MAR index of 0.5, while only 3% of the isolates had MAR index of 0.75. On the other hand, in November, about 33, 30 and 30% of the isolates, had 0.25, 0.38 and 0.5 MAR index values, while 0.63 and 0.75 MAR index values had 3% of the isolates each. The E. coli isolates encountered at the last sampling event (December), showed MAR index values of 0.13, 0.25, 0.50 and 0.75 (Figure 3F). Majority (57%) of the organisms showed 0.5 MAR index while 30, 9 and 4% displayed MAR index values of 0.25, 0.75 and 0.13 respectively. There was a significant variation (p < 0.0001) among the MAR index values recorded for the six different sampling periods according to the Two-way analysis of variance.
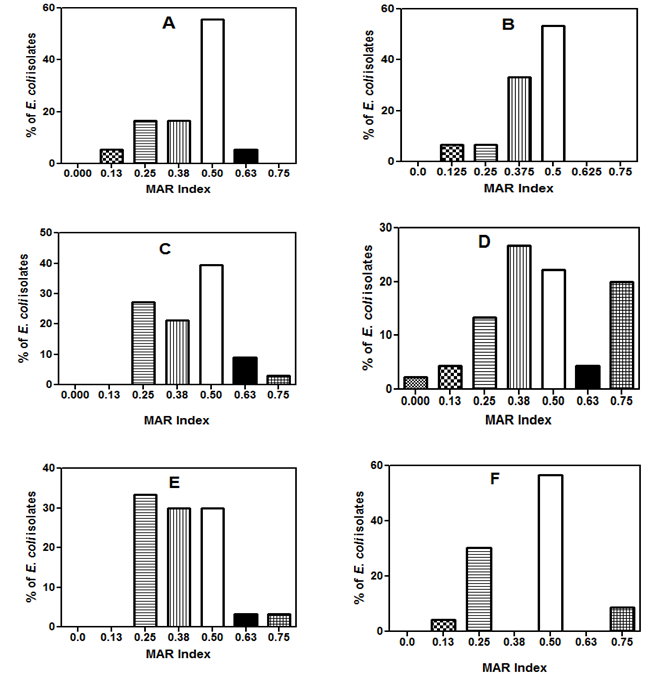 | Figure 3. The multiple antibiotic resistance (MAR) index of the E. coli isolates during the six sampling periods |
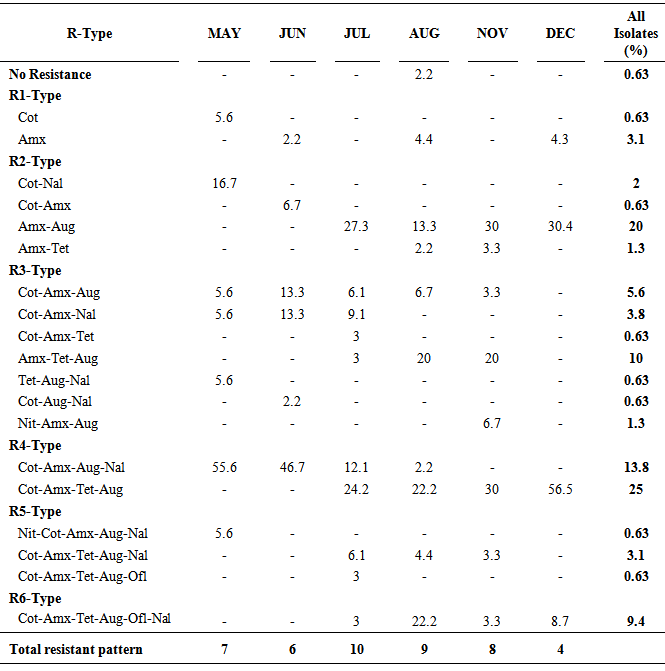
3.4. Antibiotic Resistance Patterns
- The antibiotics susceptibility of the surface water E. coli in this study revealed six major antibiotics resistant types with a total of nineteen different drugs patterns (Table 2). No pattern of antibiotic resistance occurred all through the sampling period, although a total of four patterns (Amx-Aug; Cot-Amx-Aug; Cot-Amx-Aug-Nal; Cot-Amx-Tet-Aug) were encountered majority of the time. Susceptibility to all the tested drugs was observed on only 2.2% of the organisms isolated in August; this corresponded to 0.63% of all the isolates studied. A good number of the resistant patterns were also noted to be peculiar at some sampling times, for instance, the resistance patterns Cot, Cot-Nal, Tet-Aug-Nal, Nit-Cot-Amx-Aug-Nal, occurred only during the first sampling. Cot-Amx, Cot-Aug-Nal was noted only in June, two patterns (Cot-Amx-Tet and Cot-Amx-Tet-Aug-Ofl) occurred only in (July); while Nit-Amx-Aug was encountered only among the isolates from November sampling. The R3-type which comprised of resistance to three different drugs had as many as seven different patterns, while R2-type had four patterns. Two resistant patterns, R4-type (Cot-Amx-Tet-Aug) and R2-type (Amx-Aug) were the most frequently encountered with 25 and 20% of all the isolates exhibiting the patterns respectively. Approximately 14% of the isolates also exhibited R4-type (Cot-Amx-Aug- Nal). The isolates from December sampling had the least (4) number of antibiotics resistance pattern, while the highest (10) number was observed in July, nevertheless, multiple (9, 8, 7 and 6) resistant patterns were also encountered during the other periods. It is noteworthy that about six antibiotic patterns (Amx-Aug; Cot-Amx-Aug; Amx-Tet-Aug; Cot-Amx-Aug-Nal; Cot-Amx-Tet-Aug; Cot-Amx-Tet-Aug-Nal) repeatedly occurred in July, August and November.
|
4. Discussion
- The range of the temperature and pH recorded throughout the study was within the optimal range for growth and metabolism of environmental microbes. Although the salinity was relatively high (Table 1) at some sampling times, Pommepuy et al., [14] had noted that Enterobacteriaceae (E. coli, Salmonella and Klebsiella) have the ability to induce salt tolerance mechanisms which enhance their survival in high saline water columns. Generally, enteric bacteria usually survive in coastal water environments.The resistance to the beta-lactam antibiotics amoxicillin and augmentine observed among the surface water E. coli isolates in this study was extremely high (96 and 88%), signifying the high level of misuse of these drugs. Abo-state et al., [15] and Sivri et al., [16] had also reported a high resistance of some beta-lactam drugs among aquatic enteric bacteria. This is however expected owing to the fact that these drugs are relatively cheap and are among the most commonly prescribed drugs in human and veterinary medicine. In addition, the frequency of antibiotic resistance in a population is known to be highly determined by the selective pressure on the commensal microflora due to antibiotic treatment [6, 17]. Interestingly, all the E. coli isolates tested in this study were sensitive to gentamycin, while a few (1.2 and 9%) resisted nitrofurantoin and oflaxacin respectively. Meanwhile, Heuer et al., [18], had reported the presence of gentamycin resistance genes in environmental bacteria including members of Enterobacteriaceae. The low resistance (1.2%) noted for nitrofurantoin in this study, was in accordance to the low frequency of resistance earlier reported among enterococci and Escherichia coli by Nikaido [19]. On the contrary, in a similar study by Chitanand et al., [9], E. coli isolates showed high resistance to ampicillin and nitrofurantoin but still had the lowest resistance for gentamycin. Nitrofurantoin is known to have activity against several Gram-negative and some Gram-positive organisms, including many strains of E. coli, Klebsiella, Enterobacter, Enterococci, Staphylococcus aureus, Staphylococcus epidermidis, Citrobacter, Salmonella, Shigella, and Corynebacterium. This drug is usually prescribed only for urinary-tract infection and it is not used in high volume for other human diseases [20], inferring that the concentration of this drug in the environment may be negligible to trigger resistance among these E. coli isolates. Resistance to multiple antibiotics is a major characteristic of enterococci and fecal coliform isolates from animals and humans. This is because livestock and humans receive antibiotic treatment although wild animals do not, and the antibiotic resistance pattern of these gastrointestinal micro floras reveals to some extent, the antibiotics they have been exposed to. Hence, multiple antibiotic resistance analysis has regularly been used to differentiate sources of E. coli. In other words, antibiotic resistance patterns of E. coli and fecal streptococci can be used as phenotypic “fingerprints” to determine the source of fecal pollution in natural waters or food [1, 6, 4]. Consequently, the occurrence of multiple antibiotics resistant E. coli in this study suggests that they are from high risk (humans and livestock) sources and so is of great concern to human health. According to Barbosa and Levy [21], resistant animal Salmonella, Campylobacter and E. coli isolates can be transferred to human through the food chain with subsequent colonization and proliferation, and development of difficult-to-treat or even untreatable disease.The MAR index has also been used in differentiating E. coli sources. It has been previously reported that isolates from point-sources usually exhibit MAR of about 0.25 while those from nonpoint- sources have about 0.13 [8]. In the present study however, the range of MAR values (0 to 0.75) encountered for these surface water E. coli throughout the sampling events, were apparently higher than the values for both the point-sources and non-point sources. This further emphasizes the public health risk the users of this water might be exposed to. This MAR range was also higher than the range of 0 to 0.57, reported by Agwu [11], for the heterotrophic bacteria from some other part of this water body. This was contrary to observations of Boon and Cattanach [22], in which antibiotic resistance in native heterotrophic bacteria was significantly greater than in E. coli of river samples from southeast Australia.The multiple R-type patterns observed within each sampling period and throughout the study suggest that the isolates are of different origins. This obviously might be due to the several sources of domestic and industrial sewage that drain into this lagoon, in addition to the several rivers that empty into it at various points especially during the raining season. The lowest number (4) of resistance pattern was noted during the dry season (December), at this time usually, run-off into the lagoon is reduced. The variation in the antibiotics resistance pattern noted in this study could also be attributed to the differences in the type and amount of antibiotics being used at every specific time. Since Harwood et al., [6] had noted that the pattern of antibiotic resistance usually changes as pattern of antibiotic use changes. It is also known that occurrence of diseases usually follows a seasonal pattern, and expectedly, antibiotics prescription and use will also follow the same pattern. However, ecological, genetic and social factors also have a direct relationship between antibiotics use and frequency of resistance [17, 21].
5. Conclusions
- The surface water E. coli isolates encountered in this study exhibited multiple antibiotics resistance. These organisms will most likely harbor drug resistant genes which they can easily transfer to other bacteria. The contamination of water and fishes can expose humans and other animals to these drug resistant bacteria, thus increasing drug resistant infections. In view of the population of the isolates resistant to multiple drugs and the MAR index (≥0.4), it is possible that the contamination of Lagos Lagoon is from ‘high risk’ contamination site. Moreover, the source of pollution is highly variable considering the differences in the antibiotics resistance patterns encountered. Therefore, the presence of these multiple antibiotic resistant E. coli is of environmental and public health risk and the strategic position of this study area suggest subsequent transfer of these organisms into the open Ocean.