Md. Rafiqul Islam 1, Md. Sabbir Hossain 2
1Professor and Ex-Chairman, Department of Population Science and Human Resource Development, University of Rajshahi, Bangladesh
2Senior Lecturer, Department of Business Administration, Bangladesh Islami University, Dhaka, Bangladesh
Correspondence to: Md. Rafiqul Islam , Professor and Ex-Chairman, Department of Population Science and Human Resource Development, University of Rajshahi, Bangladesh.
| Email: |  |
Copyright © 2014 Scientific & Academic Publishing. All Rights Reserved.
Abstract
The purpose of this study is to estimate age specific adult literacy rates (ASALRs) for male, female and both sexes population in Bangladesh as well as to fit some mathematical models to these estimated ASALRs and their forward cumulative distribution. For this study, the data is taken from Population Census 2001. Quasi Newton Method is employed to fit these models. Moreover, t-test, F-test and cross validity prediction power (CVPP) are used to check the accuracy as well as validation of the model. In this study, it is found that ASALRs for male, female, both sexes population and forward cumulative distribution for female population follow third degree polynomial model. But, forward cumulative distribution of ASALRs for male and both sexes population follow quadratic polynomial model. These models are well fitted in accordance with t-test, F-test and CVPP. The proportion of variance of these models are more than 94%, 99%, 98%, 99%, 99% and 99% respectively.
Keywords:
Age specific adult literacy rates (ASALRs), Polynomial model, Cross validity prediction power (CVPP), t-test and F-test
Cite this paper: Md. Rafiqul Islam , Md. Sabbir Hossain , Mathematical Modeling of Age Specific Adult Literacy Rates in Bangladesh, Advances in Life Sciences, Vol. 4 No. 3, 2014, pp. 106-113. doi: 10.5923/j.als.20140403.02.
1. Introduction
Bangladesh is a populated country of an area of 147,570 square kilometer. It has a population of about 142,319 thousands with a density of 964 per square kilometer (BBS, 2011). Literacy is defined as the ability of a person to both read and write, with understanding, a short simple statement on his everyday life. Adult literacy rate is the percentage of people ages 15 and above who can, with understanding, read and write a short, simple statement on their everyday life. It is observed that poverty and adult literacy are related inversely. If, adult literacy becomes high, then poverty will be low. Higher adult literacy rates indicate the higher level of development of any country. So, data of adult literacy rate and its level are very important for policy makers, researchers and planners for socio-economic and educational planning of a country. Adult literacy rates of Bangladesh in 1974, 1981, 1991 and 2001 are 25.8, 29.2, 35.3 and 60.5 percent respectively which show a gradually upward trend. Policymakers of Bangladesh feel to change our population into valuable manpower through proper education for overall development. The literacy rate among male population age fifteen and over is 54.0 percent where as for female is 41.4 percent (BBS, 2012). The numbers of female literacy rates are quite low in comparison with male literacy rates. The main reasons of slower rate of progress of female development in Bangladesh are misunderstanding about religious concept, socio-economic structure, lack of parental education and less expectation of education for female. It is observed that female drop outs after age 15 are high. To take various steps to increase the level of adult literacy rates, there is no alternative way to estimate literacy rates by age and sex wise specially age 15 and over. ASALRs of Bangladesh are available from some reliable sources. But, there is a gap that the data which are collected from different sources are not unique. The main cause of variation is the variation of definition of literacy. Moreover, Islam and Hossain (2013a) reported that ASALRs for male, female and both sexes population of rural area follow third degree polynomial model. And their forward cumulative distribution follow second degree polynomial model. Islam and Hossain (2014) investigated that ASALRs for male, female and both sexes of urban area in Bangladesh follow cubic polynomial model. Therefore, the main objectives of this study are addressed below:i) to estimate ASALRs for male, female and both sexes population in Bangladesh in 2001,ii) to study the level and pattern of ASALRs for male, female and both sexes population in Bangladesh in 2001, andiii) to fit some mathematical models to ASALRs and forward cumulative distribution of ASALRs for male, female and both sexes population in Bangladesh in 2001.
2. Data and Data Source
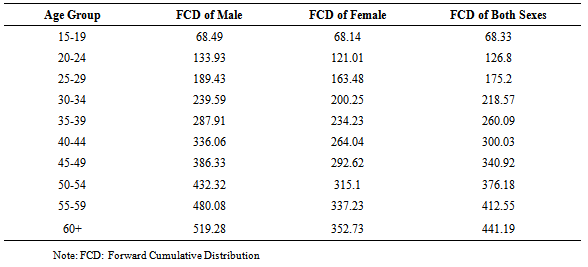
A secondary data on age specific adult literacy rates (ASALRs) for male, female and both sexes population in Bangladesh have been taken from Population Census 2001 (BBS, 2003) which is shown in Table 1 and their forward cumulative distribution are demonstrated in Table 2.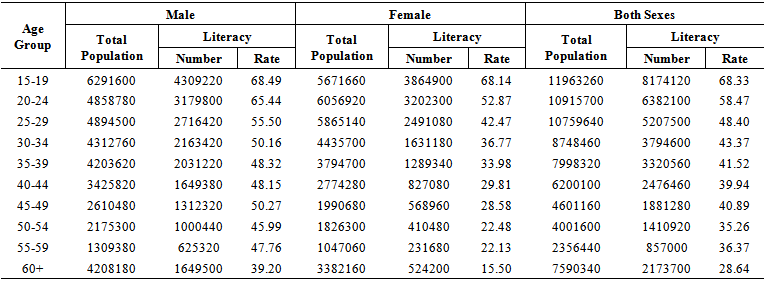 | Table 1. Age Specific Adult Literacy Rates by Sex, 2001 |
Table 2. Forward Cumulative Distribution of Age Specific Adult Literacy Rates by Sex, 2001
 |
| |
|
3. Methods and Methodological Issues
3.1. Estimation of ASALRs
To estimate ASALRs for male, female and both sexes population, the following formula is used (Shryock et al., 1976)where
  is the number of literates in age group 15 and over and
  is the population in age group 15 and over.
3.2. Model Fitting
a) Using the scattered plot (Fig. 1-Fig.3) of ASALRs by age group in years for male, female and both sexes population in Bangladesh, it seems that ASALRs for male, female and both sexes in Bangladesh can be fitted by polynomial model with respect to different ages in year. Therefore, an nth degree polynomial model is considered and the form of the model is where, x is the mean value of the age group; y is ASALRs;
  is the constant;
  is the coefficient of
  (i =1, 2, 3, ..., n) and u is the disturbance term of the model. Here, a suitable n is found out for which the error sum of square is minimum.
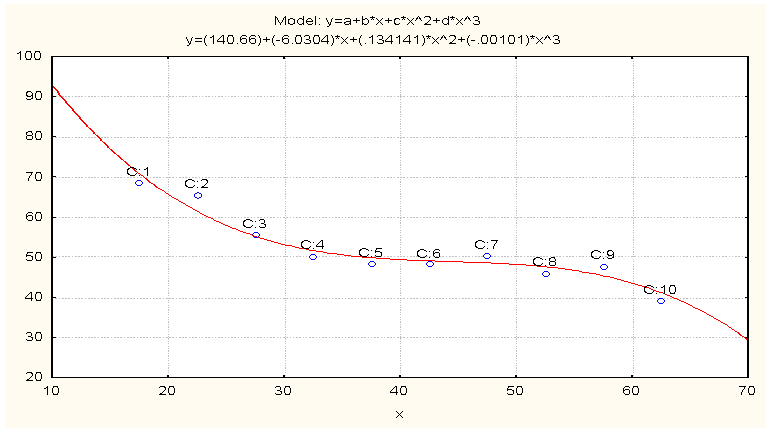 | Figure 1. Observed and Fitted ASALRs for Male in 2001. X: Age in Years and Y: ASALRs for Male |
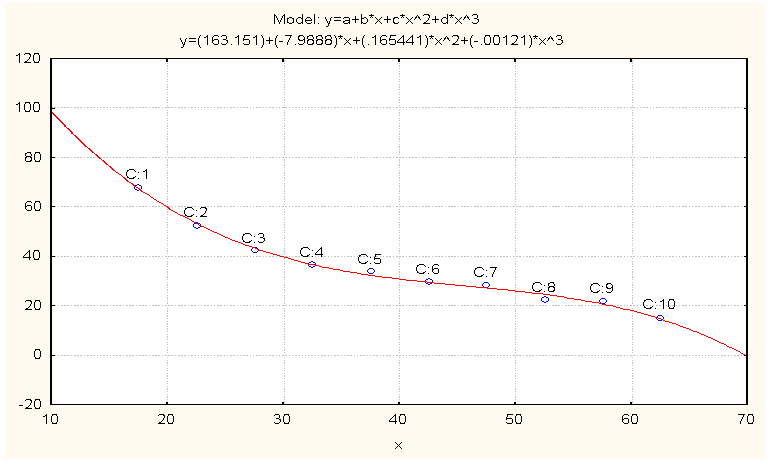 | Figure 2. Observed and Fitted ASALRs for Female in 2001. X: Age in Years and Y: ASALRs for Female |
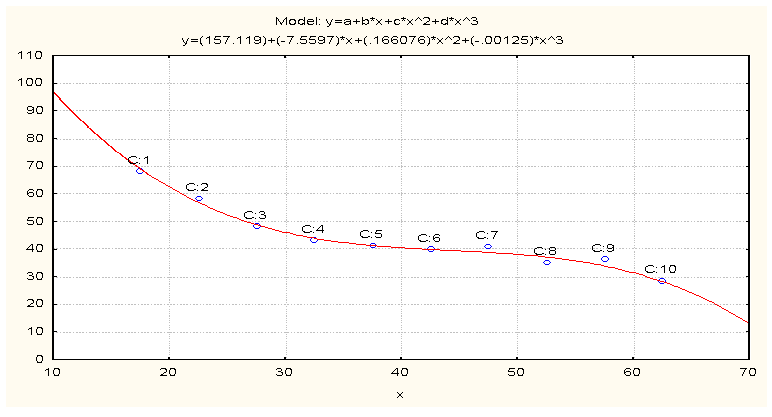 | Figure 3. Observed and Fitted ASALRs for Both Sexes in 2001. X: Age in Years and Y: ASALRs for Both Sexes |
b) Using the dotted plot (Fig. 4-Fig.6) of forward cumulative ASALRs for male, female and both sexes population in Bangladesh by age groups, it is observed that it follows an nth degree polynomial model with respect to ages. Therefore, the structure of the model is where, x is the average value of the age group; y is forward cumulative ASALRs;
  is the constant;
  is the coefficient of
  (i =1, 2, 3, ..., n) and u is the disturbance term of the model. A suitable n is selected such that the error sum of square is lowest.
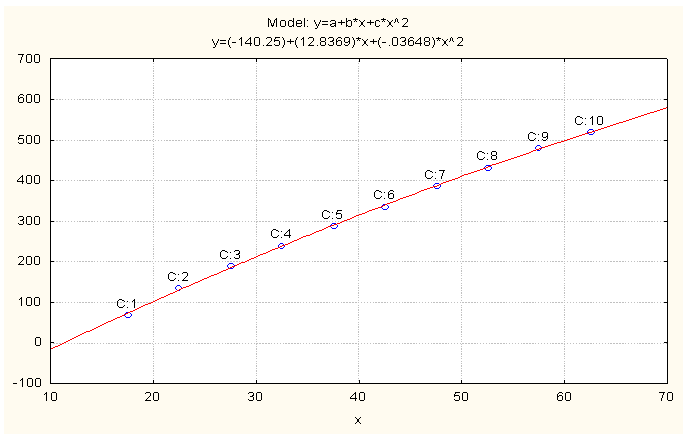 | Figure 4. Observed and Fitted FCD of ASALRs for Male in 2001. X: Age in Years and Y: FCD of ASALRs for Male |
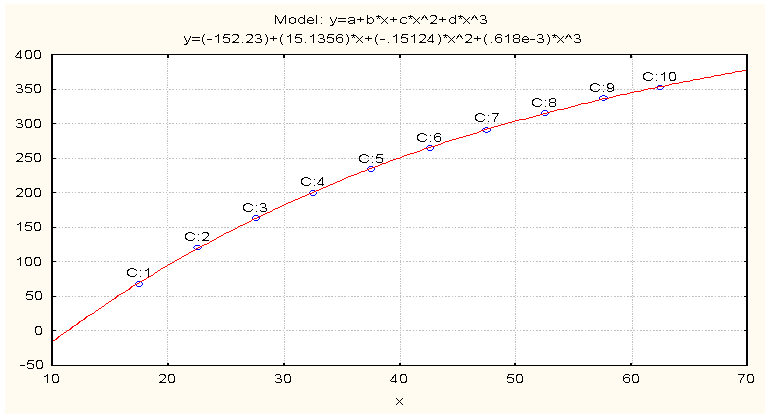 | Figure 5. Observed and Fitted FCD of ASALRs for Female in 2001. X: Age in Years and Y: FCD of ASALRs for Female |
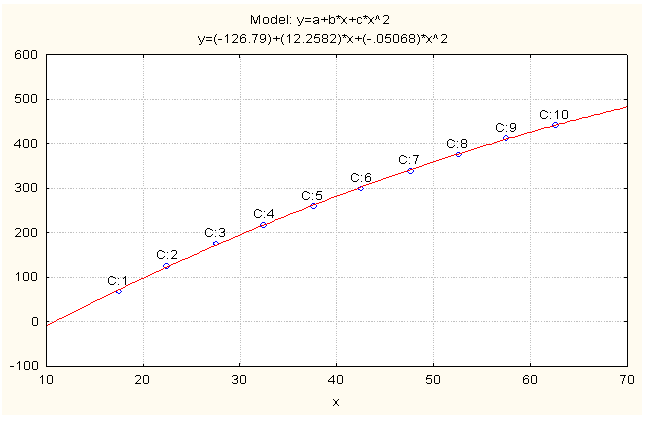 | Figure 6. Observed and Fitted FCD of ASALRs for Both Sexes in 2001. X: Age in Years and Y: FCD of ASALRs for Both Sexes |
The software STATISTICA was used to fit these mathematical models.
3.3. Model Validation Technique
To check how much these models are stable over the population, the cross validity prediction power (CVPP),  , is applied. Here
  where, n is the number of cases, k is the number of predictors in the model and the cross validated R is the correlation between observed and predicted values of the dependent variable (Stevens, 1996). The shrinkage coefficient of the model is the positive value of (
 - R2); where
 is CVPP and R2 is the coefficient of determination of the model. Here, 1-shrinkage is the stability of R2 of the model. The information on model fittings and estimated CVPP has been demonstrated in Table 3. It is noted that CVPP was also employed as model validation by Islam et al. (2004a and 2013), and Islam (2004b, 2004c, 2005a, 2007a, 2011, 2012a and 2013).
3.4. F-test
To verify the measure of the overall significance of the model as well as the significance of R2 , the F-test is employed here. The formula for F-test is given below: where k = the number of parameters is to be estimated, n = the number of cases and R2 is the coefficient of determination in the model (Gujarati, 1998). It is noted that Islam (2005b, 2007b, 2008 and 2012b), Hossain and Islam (2013), Islam and Hossain (2013b) used F-test as overall significance of a model.
4. Results and Discussion
The ASALRs for male, female and both sexes population of Bangladesh in 2001 have been estimated and presented in the Table 1. To see the level and pattern of ASALRs for male, female and both sexes population of Bangladesh, the data have been plotted in graph paper in Fig. 7. It is found that ASALRs for male, female and both sexes population are showing gradually decreasing curve. From the figure, it is also observed that the correlation between age and ASALRs for female is inversely related. Adult literacy rates at the age group15-19 for both male and female is 68 percent. But, at the age group 55-59 and 60+ for male are 47 and 39 percent respectively where as for female are 22 and 15 percent respectively. From the above observation and Fig. 7, it is found that adult literacy rates of female is very low in all age group compared to male population in Bangladesh. Table 2 is prepared for forward cumulative distribution of ASALRs male, female and both sexes population of Bangladesh and which shows the total ASALRs in every age group for clear understanding.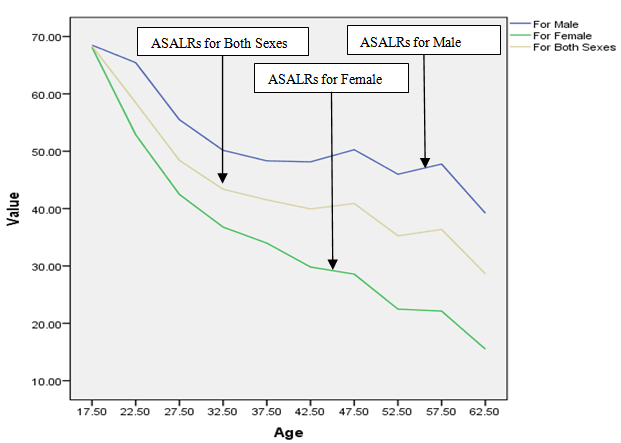 | Figure 7. ASALRs for male, female and both sexes population of Bangladesh in 2001 |
The polynomial model is constructed for ASALRs for male population of Bangladesh in 2001 and the fitted equation is as follows: | (1) |
Again, another polynomial model is fitted to ASALRs for female population of Bangladesh in 2001 and the fitted equation is  | (2) |
Again another polynomial model is constructed for ASALRs for both sex population of Bangladesh in 2001 and the fitted equation is as follows: | (3) |
Moreover, polynomial model is fitted to forward cumulative distribution of ASALRs for male population of Bangladesh in 2001 and the fitted equation is given by | (4) |
Again, another polynomial model is constructed for forward cumulative distribution of ASALRs for female population of Bangladesh in 2001 and the fitted equation is as follows: | (5) |
Finally, another polynomial model is constructed for forward cumulative distribution of ASALRs for both sexes population of Bangladesh in 2001 and the fitted equation is given below: | (6) |
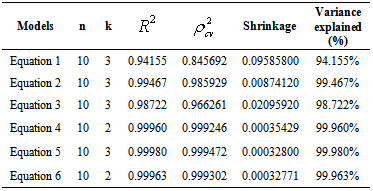
The estimated CVPP,  corresponding to their
  are shown in Table 3. The observed and fitted values are depicted in Fig. 1 to Fig. 6. In this table, all fitted models from equation (1) to equation (6) are highly cross validated and their shrinkage’s are very small. Moreover, it is observed that all the parameters of the fitted models are statistically significant with large proportion of variation explained. The stability of these models are more than 84%, 98%, 96%, 99%, 99% and 99% respectively and their corresponding shrinkage coefficients are in the 6th column of Table 3.Moreover, the stability of
  of these models are more than 90%, 99%, 97%, 99%, 99% and 99% respectively.
Table 3. Information on Model Fittings and Estimated CVPP of the Equations of ASALRs and its Forward Cumulative Distribution of Bangladesh in 2001
 |
| |
|
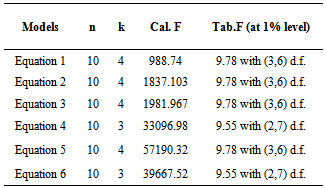
The calculated values of F-statistic of the models (1) - (6) are 988.74 with (3, 6) degrees of freedom (d.f.), 1837.103 with (3, 6) degrees of freedom (d.f.), 1981.967 with (3, 6) degrees of freedom (d.f.), 33096.98 with (2, 7) degrees of freedom (d.f.), 57190.32 with (3, 6) degrees of freedom (d.f.), 39667.52 with (2, 7) degrees of freedom (d.f.) respectively where as the corresponding tabulated values are only 9.78, 9.78, 9.78, 9.55, 9.78 and 9.55 at 1% level of significance, respectively. Therefore, from these statistics it is also seen that all these constructed models are highly statistically significant. Hence, the fits of all these models are well.Table 4. Information of F-statistics of the Equations of ASALRs and its Forward Cumulative Distribution of Bangladesh in 2001
 |
| |
|
5. Conclusions
In this study, ASALRs for male and female population of Bangladesh are showing more or less same pattern. The ASALRs for female is less than that of male at each age. Moreover, ASALRs for female is downward pattern with increasing of ages but ASALRs for male is downward pattern due to ages excepting the ages 45-49 and 55-59. The ASALRs and its forward cumulative distribution of ASALRs for female follow cubic polynomial models but forward cumulative distribution of ASALRs for male and both sexes population follow quadratic polynomial model.
References
| [1] | BBS. 2003. Population Census 2001, National Report, Government of the People’s Republic of Bangladesh, Dhaka. |
| [2] | BBS. 2011. Population and Housing Census 2011, Preliminary Results, Government of the People’s Republic of Bangladesh, Dhaka. |
| [3] | BBS. 2012. Statistical Year Book of Bangladesh 2011, Government of the People’s Republic of Bangladesh, Dhaka. |
| [4] | Gujarati, Damodar N. 1998. Basic Econometrics, Third Edition, McGraw Hill, Inc., New York. |
| [5] | Hossain, M. S. and Islam, M. R. 2013. Age Specific Participation Rates of Curacao in 2011: Modeling Approach, American Open Computational and Applied Mathematics Journal, Vol. 1, No. 2, PP: 08 - 21. |
| [6] | Islam, Md. Rafiqul, Md. Nurul Islam and M. Mujibur Rahman. 2004a. Trends and Patterns of Reproductivity Decline in Bangladesh: 1956-1998, Man in India, Vol. 84, No. 1 & 2, pp. 85-97. |
| [7] | Islam, M. R. 2004b. Mathematical Modeling of Age Specific Fertility Rates in the Rural Area of Bangladesh, J. of Science, Rajshahi University Studies, Part- B, Vol. 32, pp. 211-227. |
| [8] | Islam, M. R. 2004c. Mathematical Modeling of Age Specific Fertility Rates in Urban Area of Bangladesh, J. of Science, Rajshahi University Studies, Part-B, Vol. 32, pp. 229-240. |
| [9] | Islam, Md. Rafiqul. 2005a. Mathematical Modeling of Age Specific Marital Fertility Rates in Urban Area of Bangladesh, Pakistan J. of Statistics, Vol. 21, No. 3, pp. 289-295. |
| [10] | Islam, M. R. 2005b. Construction of Abridged Life Tables and Indirect Estimation of Some Mortality Measures of Bangladesh in 2005, Journal of Population, Indonesia, Vol. 11 (2): 117-130. |
| [11] | Islam, Rafiqul. 2007a. Predicting Population for Male of Rural Area in Bangladesh, J. of Statistical Research of Iran, Vol. 4(2): 227-238. |
| [12] | Islam, Md. Rafiqul. 2007b. Construction of Abridged Life Tables and Indirect Estimation of some mortality measures of Bangladesh in 2005, Journal of Population, Indonesia, V. 11, No. 2, pp. 117-130. |
| [13] | Islam, Rafiqul. 2008. Modeling Age Structure for Female Population in Rural Area of Bangladesh. J. of Interdisciplinary Mathematics, Vol. 11(1): 29-37. |
| [14] | Islam, Md. Rafiqul. 2011. Modeling of Diabetic Patients Associated with Age: Polynomial Model Approach, International Journal of Statistics and Applications, V. 1(1), pp. 1-5. |
| [15] | Islam, Md. Rafiqul. 2012a. Modeling and Projecting Population for Muslim of Urban Area in Bangladesh, International Journal of Probability and Statistics, Vol. 1(1): 4-10. |
| [16] | Islam, Md. Rafiqul. 2012b. Mathematical Modeling of Age and of Income Distribution Associated with Female Marriage Migration in Rajshahi, Bangladesh, Research Journal of Applied Sciences, Engineering and Technology, Vol. 4(17): 3125-3129. |
| [17] | Islam, Md. Rafiqul, M. Korban Ali and Md. Nurul Islam. 2013. Construction of Life Table and Some Mathematical Models for Male Population of Bangladesh, American Journal of Computational and Applied Mathematics, Vol. 3(6): 269-276. |
| [18] | Islam, Md. Rafiqul.2013. Modeling Age Structure and ASDRs for Human Population of Both Sexes in Bangladesh, International Journal of Anthropology, Vol. 28 (1): 47-53. |
| [19] | Islam, M. R. and Hossain, M. S. 2013a. Mathematical Modeling of Age Specific Adult Literacy Rates of Rural Area in Bangladesh, American Open Demography Journal, Vol. 1(1): PP: 01 - 12. |
| [20] | Islam, M. R. and Hossain, M. S. 2013b. Mathematical Modeling of Age Specific Participation Rates in Bangladesh, International Journal of Scientific and Innovative Mathematical Research (IJSIMR), Vol. 1(2): 150-159. |
| [21] | Islam, M. R. and Hossain, M. S. 2014. Some Models Associated with Age Specific Adult Literacy Rates of Urban Area in Bangladesh, International Journal of Ecosystem, Vol. 4(2), pp. 66-74. |
| [22] | Stevens, J. 1996. Applied Multivariate Statistics for the Social Sciences, Third Edition, Lawrence Erlbaum Associates, Inc., Publishers, New Jersey. |


 (Shryock et al., 1976)where
  is the number of literates in age group 15 and over and
  is the population in age group 15 and over.
 where, x is the mean value of the age group; y is ASALRs;
  is the constant;
  is the coefficient of
  (i =1, 2, 3, ..., n) and u is the disturbance term of the model. Here, a suitable n is found out for which the error sum of square is minimum.


 where, x is the average value of the age group; y is forward cumulative ASALRs;
  is the constant;
  is the coefficient of
  (i =1, 2, 3, ..., n) and u is the disturbance term of the model. A suitable n is selected such that the error sum of square is lowest.


 , is applied. Here
  where, n is the number of cases, k is the number of predictors in the model and the cross validated R is the correlation between observed and predicted values of the dependent variable (Stevens, 1996). The shrinkage coefficient of the model is the positive value of (
 - R2); where
 is CVPP and R2 is the coefficient of determination of the model. Here, 1-shrinkage is the stability of R2 of the model. The information on model fittings and estimated CVPP has been demonstrated in Table 3. It is noted that CVPP was also employed as model validation by Islam et al. (2004a and 2013), and Islam (2004b, 2004c, 2005a, 2007a, 2011, 2012a and 2013).
 where k = the number of parameters is to be estimated, n = the number of cases and R2 is the coefficient of determination in the model (Gujarati, 1998). It is noted that Islam (2005b, 2007b, 2008 and 2012b), Hossain and Islam (2013), Islam and Hossain (2013b) used F-test as overall significance of a model.


 corresponding to their
  are shown in Table 3. The observed and fitted values are depicted in Fig. 1 to Fig. 6. In this table, all fitted models from equation (1) to equation (6) are highly cross validated and their shrinkage’s are very small. Moreover, it is observed that all the parameters of the fitted models are statistically significant with large proportion of variation explained. The stability of these models are more than 84%, 98%, 96%, 99%, 99% and 99% respectively and their corresponding shrinkage coefficients are in the 6th column of Table 3.Moreover, the stability of
  of these models are more than 90%, 99%, 97%, 99%, 99% and 99% respectively.
 Abstract
 Reference
 Full-Text PDF
 Full-text HTML

