-
Paper Information
- Paper Submission
-
Journal Information
- About This Journal
- Editorial Board
- Current Issue
- Archive
- Author Guidelines
- Contact Us
American Journal of Signal Processing
p-ISSN: 2165-9354 e-ISSN: 2165-9362
2023; 12(1): 1-10
doi:10.5923/j.ajsp.20231201.01
Received: Oct. 19, 2023; Accepted: Oct. 26, 2023; Published: Oct. 28, 2023

Black Box Modelling of Dual Axis Fast Steering Mirror Assembly
 Abstract
 Reference
 Full-Text PDF
 Full-text HTML
Mahua Pal1, Kumardeb Banerjee2, Bivas Dam2
1Department of Electronics and Communication Engineering, Techno Main Salt Lake, EM4/1 Sector V, Salt Lake, Kolkata
2Department of Instrumentation and Electronics Engineering, Jadavpur University, Salt Lake 2nd Campus, Kolkata
Correspondence to: Mahua Pal, Department of Electronics and Communication Engineering, Techno Main Salt Lake, EM4/1 Sector V, Salt Lake, Kolkata.
| Email: |  |
Copyright © 2023 The Author(s). Published by Scientific & Academic Publishing.
This work is licensed under the Creative Commons Attribution International License (CC BY).
http://creativecommons.org/licenses/by/4.0/

In challenging environments, precise laser beam control is essential both for military and industrial purposes. Fast Steering Mirror Systems are integral in achieving this precision, utilizing advanced controllers based on accurate mathematical models. This study proposes a systematic black-box method for modelling a dual-axis tip-tilt fast steering mirror assembly, incorporating integrated piezo actuators and pick-off sensors. Employing a two-pronged modelling approach utilizing time response (TR) and frequency response (FR) data, contingent on the system's damping characteristics, the method also estimates the cross-coupling coefficient between the mirror's axes. Operating independently of controller details and applicable to all damping scenarios, the algorithm is validated using variance accounted-for (VAF) metrics, showcasing superior performance compared to traditional methods.
Keywords: Cross-coupling, Damping coefficient, Fast steering mirror, Frequency response, Parameter estimation
Cite this paper: Mahua Pal, Kumardeb Banerjee, Bivas Dam, Black Box Modelling of Dual Axis Fast Steering Mirror Assembly, American Journal of Signal Processing, Vol. 12 No. 1, 2023, pp. 1-10. doi: 10.5923/j.ajsp.20231201.01.
Article Outline
1. Introduction
- Two-axis FSM assemblies driven by piezo-actuators are used widely in laser beam steering applications, such as free space optical communication [1], a small tip-tilt for nano-pointing [2], a large tip-tilt for fast micro-positioning [2] and precise pointing of the laser beam [3] in the presence of atmospheric jitter. The FSM module [5] with built-in piezo-actuators and integrated position pick-off sensors reported in this work comes with a piezo-actuator driver from M/S piezosystemjena [4]. The piezo actuators of the FSM assembly [5] are driven by a low-frequency square wave and then angular displacement of the mirror is acquired from the pick-off sensors. From the time response (TR) data of the FSM assembly, parameter estimation of the FSM is carried out. The reaction curve method [6] may be used for system identification by utilizing three points of a closed-loop reaction curve and by controller setting. The method of [6] is limited to testing conducted exclusively under a Proportional (P) controller, without the capability to accommodate other types of controllers. This limitation is overcome in [7] and [8]. The work in [7] uses a closed-loop test under the PI controller (widely recognized and commonly used controller in various industrial applications) for parameter estimation. Least square estimation which involves recursive and advanced search algorithm in the LS cost function is used for the parameter estimation in [8]. The use of recursive and advanced search algorithms in the least square estimation (LS) cost function can lead to increased computational complexity and associated time constraints. These sophisticated algorithms require substantial computational resources and may not be suitable for real-time applications. The work reported in [9] uses the experimentally obtained frequency response of the FSM module to obtain a MIMO linear time-invariant model of the same using a subspace-based multivariable system identification algorithm [10] However, the method is computationally intensive and not suitable for any fast-modelling process.In [11] FSM model was built using physical principles and then identified by the subspace identification toolbox. The consistency between the actual and model FSM of [11] was evaluated by estimating the variance-accounted-for (VAF) which was found to be order-dependent, and the optimal model was chosen to be second-order. The construction of an FSM model based on physical principles and subsequent identification through the subspace identification toolbox can be limited by the accuracy of the initial physical model. If the physical principles used for constructing the model do not precisely capture the complex dynamics and interactions within the FSM, the identified model might deviate significantly from the actual system behavior.The LS method [12] based on a closed-loop transfer function is simple enough to compete with the reaction curve method. However, this method requires prior knowledge of the controller and closed-loop transfer function. The frequency response method that we have proposed in our work is an extension of this method [12] but it uses only open loop frequency response data, thus, omitting the restriction of the prior knowledge of the controller and closed loop transfer function.Experimentally determined mathematical models of one-axis and two-axis FSM assemblies documented in [13] and [14] respectively are taken as second order and the transfer function coefficients are determined from the frequency response of the combined FSM-PSD modules. Here the fast-steering mirrors are the heart of a Laser Jitter Control (LJC) test bed. In this work, analysis of the TR data shows that the FSM response matches with those documented in [13]and [14], however, it encounters a dead time which reduces the stability and limits the speed of the response. Based on previous research related to the design of FSM systems, most of the researchers have designed FSM by white box modelling method [17]-[20] and have followed the traditional system design method, which follows a systematic order starting with structural design → controller design → performance testing. If the performance criteria are not met then the design plan needs to be repeatedly modified in the same order, structural improvement → controller improvement → performance testing until it meets the performance requirements as pointed out by [17]. It can thus be envisaged that the white box modelling method can indeed develop an FSM system with excellent performance, but requires a long design period; it is worse yet if some key indicators of the finished FSM have to be adjusted or improved, and the whole design process has to be repeated so that it reduces the development efficiency and increases the development costs. The way to circumvent these problems may be to incorporate data-driven or black-box modelling methods. Such data is available through measurements acquired through experimental procedures. Since black box modelling is more focused on external or end-user perspectives, and is less time-consuming, compared to the white and grey box [21]-[22] modelling, this work was motivated by black box modelling methodology. Further, this work is motivated by the necessity for adaptable modelling to accommodate varying damping in dual-axis tip-tilt fast steering mirror assemblies. By integrating time and frequency response strategies, it strives to comprehensively understand the system's behaviour independently of specific controllers. Departing from traditional methods, the research aims to drive innovation in the field, ultimately advancing FSM assembly control and performance.Cross-coupling interference in a dual-axis FSM degrades the scanning precision of FSM, and thus its estimation and incorporation in the identified model is essential for control action. This fact has motivated the estimation of cross-coupling in this work. Most of the work existing in the literature that has dealt with cross-coupling has focused on a control strategy to compensate for/reduce the cross-coupling effect [23]-[25], which relies on complex and highly sophisticated control algorithms. The cross-coupling methodology proposed here is simple and can be implemented in real-time. This paper introduces a pioneering black-box approach for modelling a dual-axis tip-tilt fast steering mirror assembly, adapting to varied damping using a combined time and frequency response strategy. It estimates cross-coupling coefficients via transformed time responses, ensuring model accuracy without controller insights, a departure from conventional techniques.The FSM model proposed in our work is a dual-axis tip-tilt arrangement and is approximated as a second-order plus dead time (SOPDT) system with a cross-coupling coefficient. Existing modelling methods for second-order systems with dead time from their time reaction curves [15]-[16] are later used to validate the model obtained by using the TR method proposed in this work. The FSM system of [14] is also modelled by the FR method to validate the efficacy of the FR method. To check the consistency between the actual FSM and the model FSM by both TR and FR techniques, the VAF is estimated and it is also compared with the subspace identification method [11].One potential issue that could be encountered with the described approach is the challenge of accurately estimating the cross-coupling coefficient between the two axes. This estimation process, which relies on transforming the time response signal into the frequency domain, may be prone to inaccuracies if the system exhibits complex or nonlinear cross-coupling effects. The paper is organized as follows:Section 2 gives the problem formulation and the choice of the model for parameter estimation of the dual-axis FSM system. Section 3 introduces the theoretical and mathematical basis for the estimation procedure of the TR and FR methods. Section 4 presents the experimental setup for the parameter estimation of the dual-axis FSM system. Section 5 presents the validation of the algorithm by comparison with three published methods [14], [15], and [16]. Finally, the concluding remarks are presented in Section 6.
2. Problem Statement
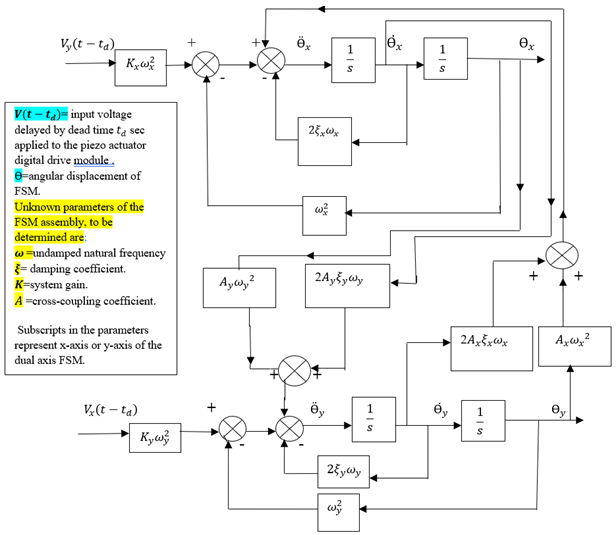
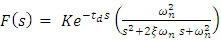
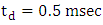
- For a dual-axis (x and y) FSM assembly, an actuator input voltage from the digital drive-in y-axis will rotate the FSM about the x-axis, and thus sensor output is obtained in the x-direction. To account for the time lag between the actuator input and the sensor output, a dead time
 is added to the model of the FSM assembly which is considered a second-order system in line with [13] and [14]. In the absence of cross-coupling between the axis, both the axis assumes an identical second order plus dead time (SOPDT) model characterized by (1)
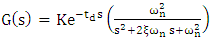 | (1) |
 is the dead time,
  is the undamped natural frequency and
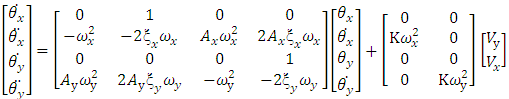
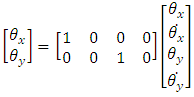
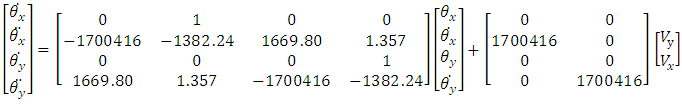
  is the damping coefficient. The first problem addressed in this paper deals with the estimation of these four parameters that characterize the model in (1) using the TR algorithm or FR algorithm. The second problem deals with the determination of the cross-coupling factor of the dual axis FSM system by capturing the time domain input-output signals of the x-channel and y-channel respectively and converting them to frequency domain using the FFT algorithm.For the dual input dual output FSM system used here, the transfer function T of the system can then be written as:
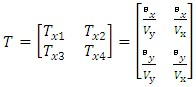 | (2) |
 | (3) |
 | (4) |
 and
and  , are cross-coupling coefficients about the x-axis and y-axis respectively, and
  and
and  are rotation of FSM about the x-axis and y-axis respectively,
  and
and  are undamped natural frequency about x-axis and y-axis respectively and
  and
and  are damping coefficient about x-axis and y-axis respectively.
3. Estimation Procedure
- Estimating the four parameters of the FSM system of (1) is done by FR or TR algorithm depending on whether the time response of the system has mild/no oscillations (heavy damping) or strong oscillations (mild damping) respectively. Making the proper choice of FR method or TR method with an emphasis on the degree of oscillation in the step response of the FSM system demands a deeper understanding of this concept and has been taken care of in the subsequent subheadings of this section.
3.1. Frequency Response (FR) Method
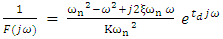
- In this method frequency response data of the FSM assembly is used to generate the FSM open loop model. Using self-tuning controllers like PID, the work of [12] obtained parameters of the SOPDT closed loop system in the frequency domain. Unlike [12], the FR method used here does parameter estimation of SOPDT system in open loop mode.The actual open loop frequency response is obtained by driving the FSM assembly by a sinusoid whose frequency is varied from 1 Hz to 1000 Hz. The SOPDT of FSM (1) may be re-written as in (5) and (6)
 | (5) |
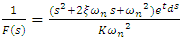 | (6) |
 and
and  denote the magnitude and phase respectively at frequency ω obtained from frequency response data and
  and
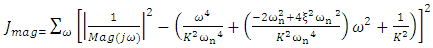
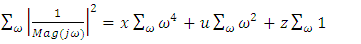
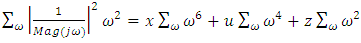
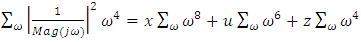
and  represent the magnitude and phase respectively of the model given in (5). Least square estimation is applied to the magnitude obtained from the model and actual open loop frequency response as shown below:
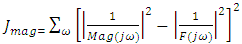 | (7) |
 | (8) |
 we get
 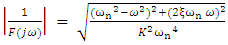 | (9) |
 | (10) |
 .Let
.Let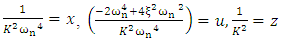 | (11) |
 | (12) |
 | (13) |
 | (14) |
 where
where  is the cut-off frequency, obtained from the open loop FR data, the values of u, x, z are obtained. Thus from (11) we get (15)
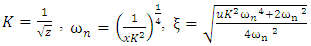 | (15) |
 and damping coefficient
  can be estimated from (15).Applying least square estimation to the phase obtained from the model
  and phase
  from actual open loop frequency response, we get (16) and hence (17)
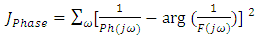 | (16) |
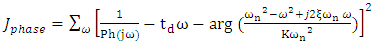 | (17) |
 we get (18)
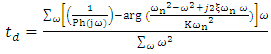 | (18) |
 (oscillatory) cases as the frequency response of the magnitude plot will have a peak in the vicinity of the natural frequency
  which may or may not be greater than
  (-3dB cut-off frequency). Thus, for frequencies in the interval (0, ωc], there will be one magnitude corresponding to two frequencies, making (12)-(14) non-unique, and hence will lead to a discrepancy in the parameter estimation.
3.2. Time Response (TR) Method
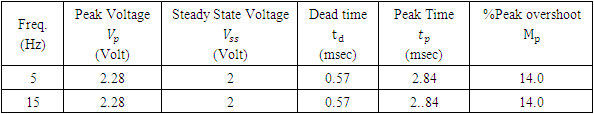
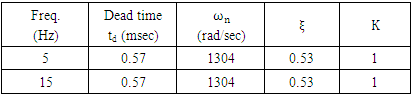
- The FSM assembly is operated in open loop mode and driven by a unipolar square wave (5Hz and 15Hz) to generate the step response data. The time response data is acquired in the DSO in comma-separated variable (.csv) format and transferred to PC and analysed using MATLAB, whence the values of dead time
 peak voltage
  peak time
  peak overshoot
  and steady-state output
  are obtained. From these values, the system parameters of (1) are estimated [5]. The TR method is applied to SOPDT system having strong oscillation so that
  and
and  can be estimated easily from the open loop time response. The dead time corresponds to the difference between the start time i.e., the time when the input starts its excitation and the first time where the step response is greater than zero. The dead time corresponds to the difference between the start time viz the time where the input starts its excitation and the first time where the step response becomes greater than zero. The peak overshoot
  and
and  is related by (19)
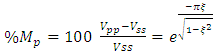 | (19) |
 can be evaluated. The peak time
  and natural frequency
  are related by (20)
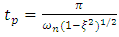 | (20) |
 can be evaluated. Also, steady state gain is given by (21)
 | (21) |
 are determined. The TR algorithm yields less accurate estimates if the time response of the FSM system has mild oscillations i.e.,
  as then peak voltage
  peak time
  cannot be accurately identified.
4. Experimental Set-Up
- The experimental test bench comprising of an FSM assembly, piezo-driver (d-drive), DSO and a signal generator are mounted on an optical bread board shown in Fig. 1.The test-bench components are:Fast Steering Mirror AssemblyA two-axis FSM of PSX x/2 series [4] is used in the experimental setup. It is characterized by a maximum angular displacement of ±4 mrad and a resonant frequency of 3500 Hz.
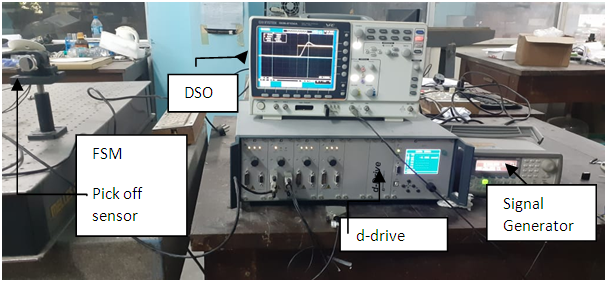 | Figure 1. Experimental Set-up |
4.1. Time Response (TR) Method
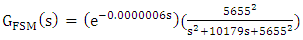
- The FSM assembly is first driven by a unipolar square wave of amplitude 2 V (peak to peak) at frequencies 5 Hz and 15 Hz respectively to generate and acquire the step response data from the DSO, transferred to MATLAB environment, and the system parameters are obtained using (19)-(21). The time response performance indices (PIs) for a square wave drive at two different frequencies are listed in Table 1 and Table 2, for an x-axis drive. The y-axis drive yields an almost identical result. The Open loop FSM output with an input of 0-2V square wave of freq. 15Hz as acquired in DSO is shown in Fig. 2.Hence, the overall system transfer function takes the form (23)
 | (22) |
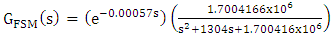 | (23) |
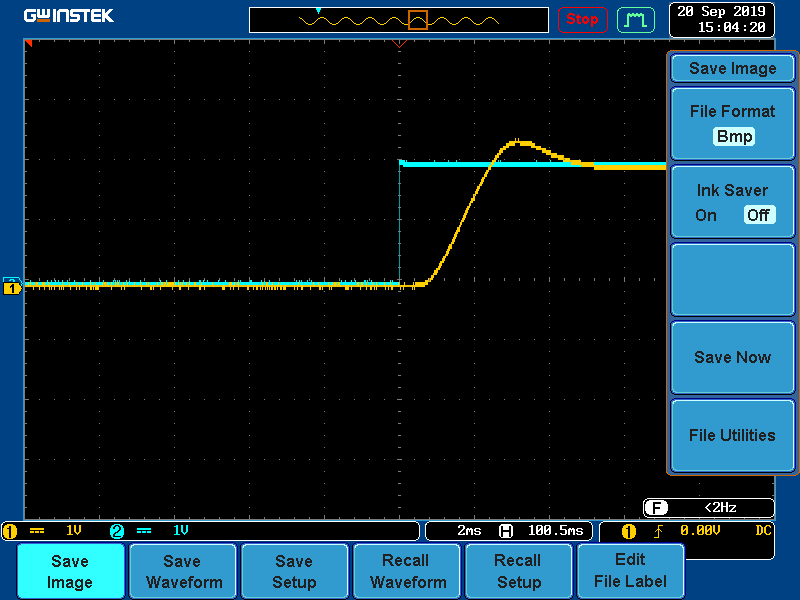 | Figure 2. Open loop FSM output with an input of 0-2V square wave of freq. 15Hz acquired in DSO |
|
|
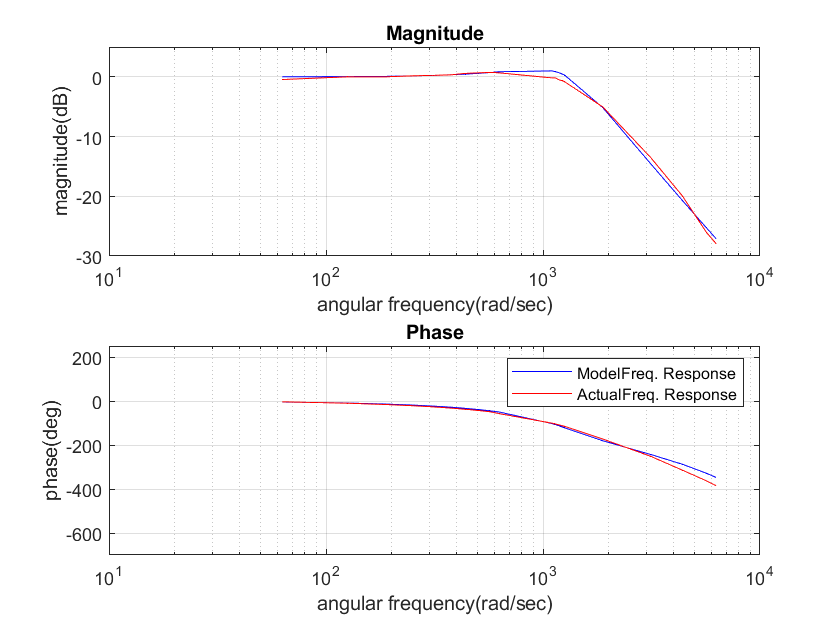 | Figure 3. Bode plots of FSM model and actual FSM |
|
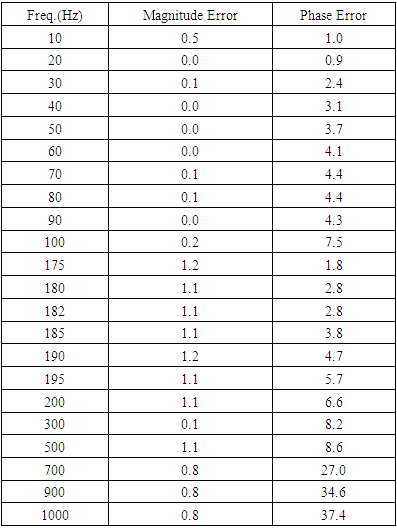
4.2. Frequency Response (FR) Method
- The FR of the FSM assembly is generated by driving the x-axis of the FSM by a sinusoid whose frequency is varied from 1Hz to 1000Hz and acquiring the angular tilt of the mirror position from the MON output of the d-drive, and then comparing it with drive input on the DSO for amplitude and phase measurement. The y-axis drive yields an almost identical result.The cut-off frequency of the FSM from the plant’s (FSM system) frequency response is found to be 1581 rad/sec (or 251 Hz).Solving (12)-(14), by selecting ten frequencies in the interval (0,1581], the values of u, x, z are obtained as given in (25)&(26).
 | (24) |
 | (25) |
 | (26) |
 | (27) |
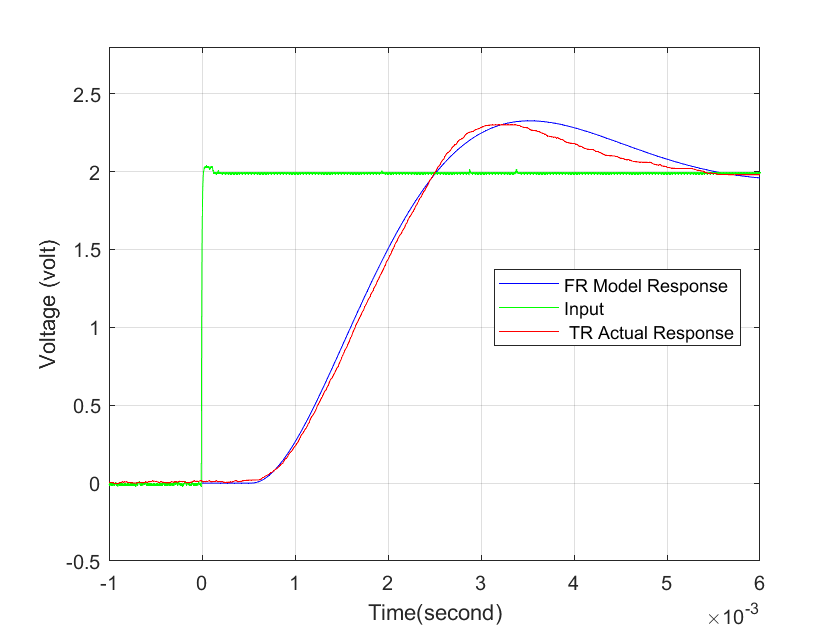 | Figure 4. FR Model Response and TR Actual Response for 15Hz |
 using the Frequency Response (FR) method. This discrepancy is due to the fact that while using the FR scheme for parameter estimation we have assumed the FSM system to be an SOPDT system with strong damping
  , although the FSM has mild damping
  .
.4.3. Cross-coupling
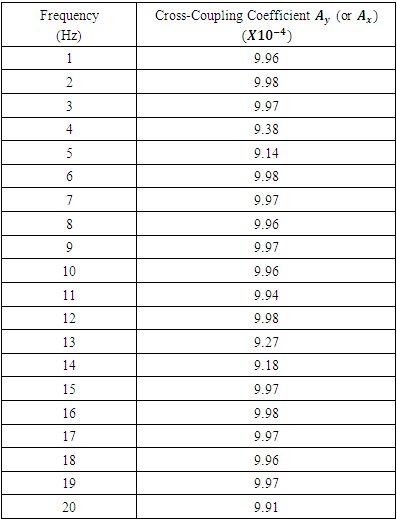
- The x-channel of the FSM assembly is driven by a sinusoid of frequencies 1Hz to 20 Hz, and their corresponding output is observed in the y-channel. The input and output signals are acquired in the DSO in .csv format and transferred to PC where it is read and analysed in MATLAB by generating their FFT.Cross-coupling at 15Hz, 10Hz, and 5Hz is shown in Fig. 5-7 respectively.The cross-coupling factor is then determined easily as the ratio of the amplitude of output FFT to the amplitude of input FFT at that frequency as depicted in Table 4.An identical set of readings was observed when input was given to the y-channel and output was taken from the x-channel. As the data obtained shows no definite dependency on the input drive frequency, the mean value of the cross-coupling coefficient
 or
or  evaluated in the frequency range 1 to 20 Hz, is used as the cross-coupling coefficient of the model. From the data set listed in Table 4, the mean value of cross-coupling coefficient is
  .
.
|
 | (28) |
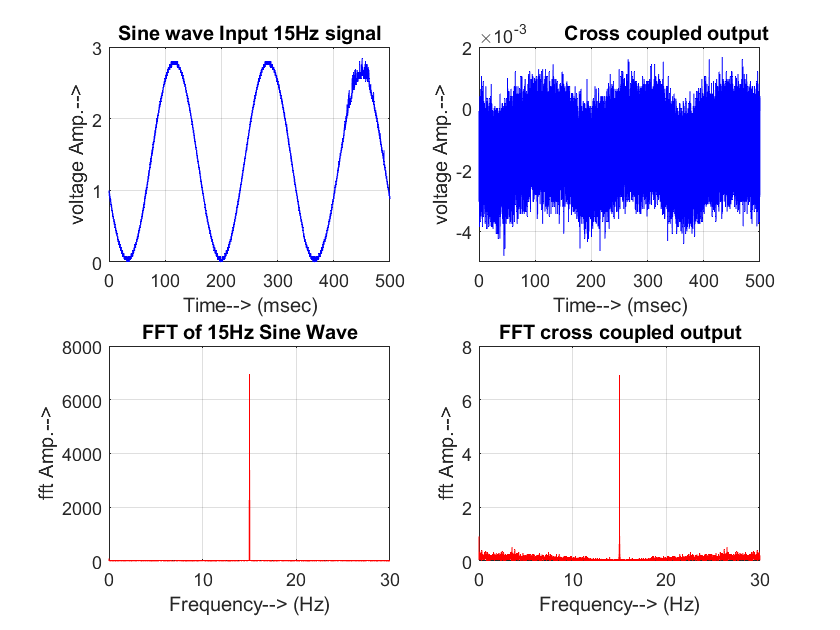 | Figure 5. Cross-Coupling at 15 Hz |
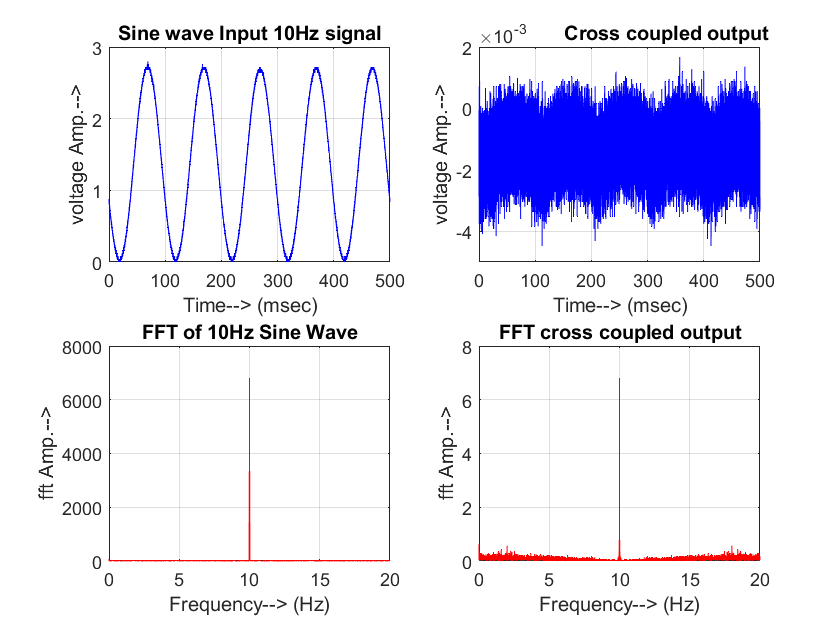 | Figure 6. Cross-Coupling at 10 Hz |
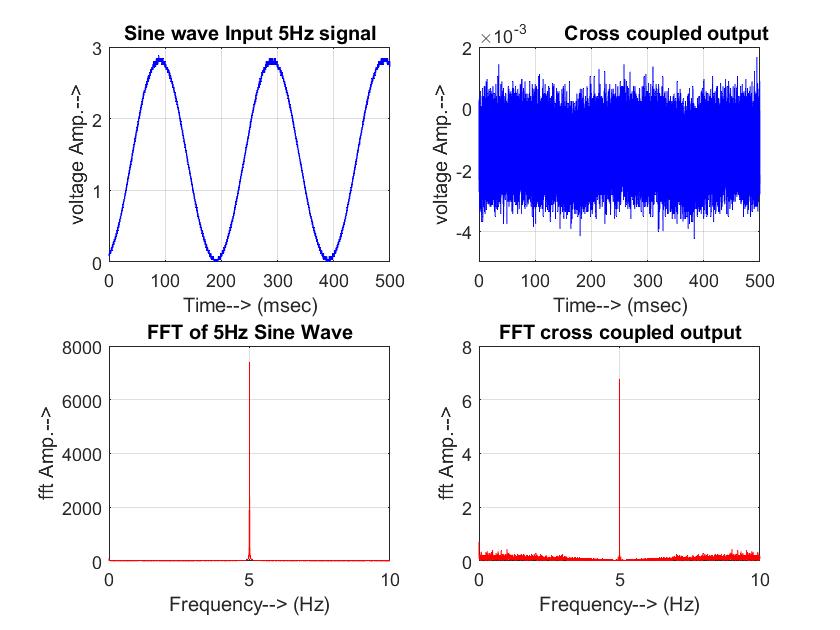 | Figure 7. Cross-Coupling at 5 Hz |
5. Model Comparison and Validation
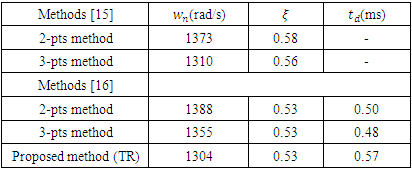
5.1. Parameter Estimation-Based TR Method for SOPDT System with Mild Damping
- Table 5 gives a comparative list of the parameter estimates in line with methods given in [15], [16] and the TR method proposed in this work. However, the proposed TR method has a limitation that it cannot be applied for modelling of FSM systems with strong damping or mild oscillation for which the proposed algorithm for the FR method is to be implemented.
|
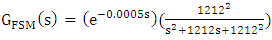
5.2. Parameter Estimation-Based FR Method for SOPDT System with Strong Damping
 [14]:To check the efficacy of FR method, the FR scheme was applied to an FSM system of [14]
 which has mild oscillations/strong damping. From the open loop frequency response data, the cut-off frequency
  of the FSM was found to be 4211 rad/sec (or 670 Hz). Solving the (12)-(14), by selecting ten frequencies in the interval (0,4211], the values of
  are obtained as:
 Using (15) we get the parameters as in (29)
 | (29) |
 | (30) |
 The parameter estimation by FR method closely matches with the system parameters of [14], and hence FR method is validated for strong damping systems.
5.3. Comparison of TR and FR Method with Subspace Identification Method [11]
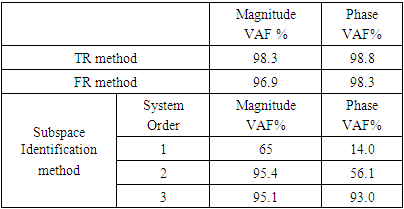
- In order to check the performance of TR and FR model, the performance index viz. variance- accounted-for (VAF) is calculated for proposed methods, and compared with the subspace identification method. The VAF signifies the consistency between the model and actual system as stated in [11]. So, a VAF of 100% ensures an exact match of the estimated system with the actual system. To check the accuracy of the model the VAF value of the recovered model is calculated as:
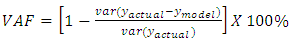 where
where = output from the actual system for a given input
 = output from the model for the same input.
  = varianceThe open loop frequency response data of the FSM for a sinusoidal input excitation from 1Hz to 1000Hz is taken as
  The
The  is the simulated frequency response output for both TR and FR models for the same input. Using the MATLAB subspace identification toolbox, the
  for the subspace identification method is evaluated. The VAF for the three methods tabulated in Table 6. clearly shows an improvement in the accuracy of the TR and FR methods over the conventional subspace method.
|
6. Conclusions
- This research introduces an algorithm for effectively modelling a two-axis FSM assembly in both the time and frequency domains. Both the TR and FR schemes demonstrate high efficacy, as evidenced by the VAF estimates exceeding 95% for both cases, ensuring the algorithm's accuracy and reliability. The accurate estimation of the cross-coupling coefficient highlights the method's success in capturing complex interactions between the assembly's axes. Additionally, the effective transformation of time response signals using the Fast Fourier Transform (FFT) showcases the method's proficiency in analysing system dynamics. Moreover, the successful application of the open-loop algorithm without specific controller insights underscores the method's versatility and potential for broader application in modelling similar complex systems. These findings collectively suggest the method's efficacy in enhancing the understanding and control of dual-axis tip-tilt fast steering mirror assemblies. The implications of this research pave the way for the future incorporation of the coupled black box model in the design of a controller, thereby enhancing the potential applicability of the algorithm in practical settings.
ACKNOWLEDGEMENTS
- All authors contributed to this research work. The first author worked under the supervision of the other two authors. No funding was received for this work from any source.