A. H. M. Zadidul Karim1, Muhammad Towhidur Rahman1, Md. Abdullah Al Mahmud1, Shikder Shafiul Bashar1, Md. Sazal Miah1, Maliha Marium2
1Department of Electrical and Electronic Engineering, University of Asia Pacific, Dhaka, Bangladesh
2Department of Computer Science and Engineering, University of Asia Pacific, Dhaka, Bangladesh
Correspondence to: Md. Sazal Miah, Department of Electrical and Electronic Engineering, University of Asia Pacific, Dhaka, Bangladesh.
| Email: |  |
Copyright © 2019 The Author(s). Published by Scientific & Academic Publishing.
This work is licensed under the Creative Commons Attribution International License (CC BY).
http://creativecommons.org/licenses/by/4.0/

Abstract
The main objective of this paper is to detect the heart rate from any wearable wrist device. The number of times one’s heart beats per minute is called heart rate. Theoretically, any body part can be used to measure heart rate through the sensor of the device, although wrist type things are commonly targeted. In this paper the heart rate monitoring is based on photoplethysmoghaphy (PPG). But during the physical exercise it is tough to get the heart rate (HR) because then the PPG signals are vulnerable to motion artifacts (MA). To find HR an algorithm is presented here, which combines ensemble empirical mode decomposition (EEMD) with spectrum subtraction (SS). Ensemble Empirical Mode Decomposition decomposes a PPG signal and acceleration signal into intrinsic mode function (IMF). That’s mean it jointly estimates the spectra of PPG signals and simultaneous acceleration signals, utilizing the multiple measurement vector model in sparse signal recovery. This method can easily identify and remove the spectral peaks of motion artifact (MA) from the PPG spectra. The method explained in this paper has better performance than other methods.
Keywords:
Heart Rate, Photoplethysmography, Signal processing
Cite this paper: A. H. M. Zadidul Karim, Muhammad Towhidur Rahman, Md. Abdullah Al Mahmud, Shikder Shafiul Bashar, Md. Sazal Miah, Maliha Marium, Analysis of Empirical Mode Decomposition Method of Heart Rate Extraction from Motion Artifact Corrupted PPG Signal, American Journal of Signal Processing, Vol. 9 No. 1, 2019, pp. 6-10. doi: 10.5923/j.ajsp.20190901.02.
1. Introduction
Heart rate is one of the most significant physical signs that are related to human health. Monitoring heart rate is not only important for the patient but also beneficial for common people. With the development of the sensor technology, some simple portable devices emerged on the market, enabling people to measure their own heart rate at home. Now-a-days for HR measurement photoplethysmography (PPG) is widely used. Wearable optical health monitoring sensors integrated into telemedicine or mobile systems used for collecting raw PPG signal. The main problem using PPG sensors on the wrist is that they are vulnerable to the motion. If the watch moves due to movement of the hand, the signals obtained by PPG sensors are distorted by motion artifacts (MA). There are many signal processing techniques to MA artifacts from PPG signals. There is a number of algorithms have been developed to reduce MA from the PPG signal. These are adaptive noise cancellation (ANC) [1], empirical mode decomposition (EMD) [2], spectral subtraction [3], wavelet denoising [4], independent component analysis (ICA) [5] and TROIKA [6] etc. Fig. 1 shows typical procedure to estimate HR from PPG signal. | Figure 1. A General Framework for Heart Rate Monitoring Using Wrist-Type PPG Signals |
The results of study for this proposed method demonstrated the efficacy.
2. Methodology
Initially, raw PPG and acceleration signal is recorded. Then the PPG signal is filtered by 2nd order bandpass filter (frequency range 0.4-5 Hz). The adaptive filter is used to reduce noise from raw PPG signals. The correlation coefficient (CC) between the spectra of filtered PPG data and acceleration data is calculated. The value of CC is considered as a threshold, which indicates the next step of our works. If the value of CC is less than 0.5 then we work with only filtered PPG signal. And if the CC is greater than 0.5 then we work with both preprocessing PPG and acceleration signals. Signal decomposition is the main basis of this work. Here Empirical Mode Decomposition (EMD) is used for the decomposition process. EMD is an iterative process which decomposes real signals (𝑡) into simpler signals (modes). Each “mono-component” signal y(𝔦) should be representable in the form,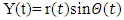 | (1) |
A. Data recording & preprocessing Pulse oximeter is used to obtain the PPG signal from different human body part. All the datasets used here were initially recorded and used in [6]. For the study, twelve subjects (male, with ages ranging from 18 to 35) were enrolled. Simultaneous PPG signals, acceleration signals, and a single-channel ECG signal were recorded for each subject during the physical activities. After data recording, an adaptive filter used to preprocess the PPG signal and acceleration signal. This preprocessing procedure used to remove noise and MA outside of the frequency band of interest. Then these signals were normalized to be zero mean and unit variance. B. Spectrum Computation (Periodogram) To calculate the Heart Rate from wrist type PPG we need to estimate the spectrum of both acceleration and PPG signals. To estimate the spectrum we need Spectrum Computation (periodogram) process just after the process of filtering the raw PPG signal. One method for estimating spectral densities is based on using a function called the periodogram. 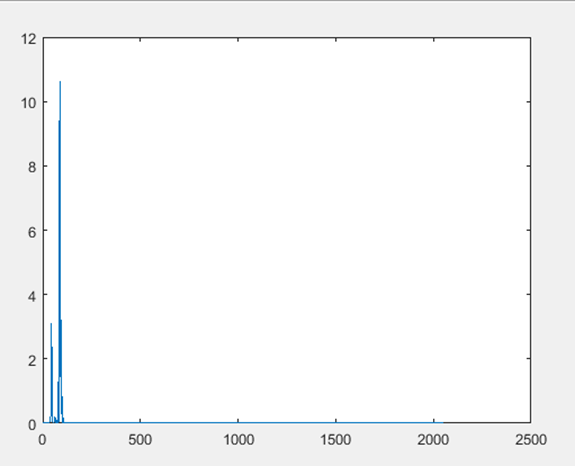 | Figure 2. Periodogram of PPG Signal |
C. Correlation CoefficientCorrelation coefficient is a number that quantifies a type of correlation and dependence, meaning statistic relationships between two or more values in a fundamental statistic. In this work, the correlation coefficient between the spectrum of acceleration and PPG signals are calculated. Correlation coefficient measured the degree of association, which is denoted by r. The correlation coefficient measurement scale varies from + 1 through 0 to - 1.In our Heart Rate (HR) monitoring process using wrist type PPG, before Heart Rate monitoring we have to fix the value of spectral CC and then we can estimate the HR in that possible range.1. CC between the spectrum of acceleration and PPG signals are calculated here to measure HR.2. The threshold attributed upon CC.3. The estimated value of the threshold is here 0.5 and this value is used for heart rate monitoring.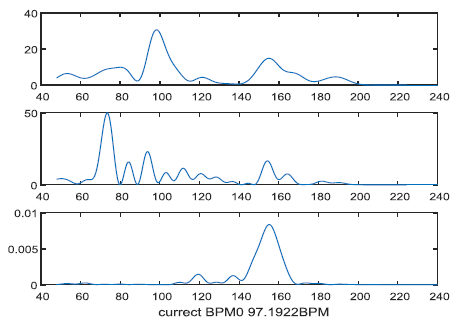 | Figure 3. After periodogram of a clean PPG Signal |
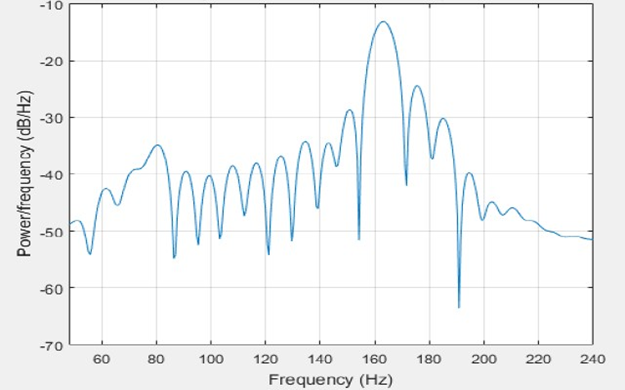
Here, the value of CC= 0.527 and the signal is not corrupted by motion artifact. Because for heart rate estimation, the maximum amplitude of the signal must be equal or less than 110. Here the value of the maximum peak (current BPM) is 97.19. So the signal is clean.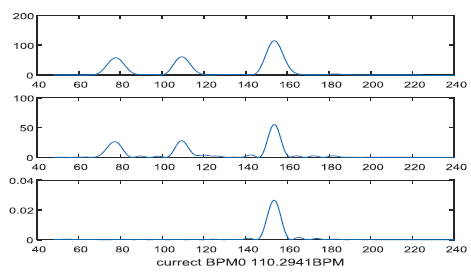 | Figure 4. After periodogram of a corrupted PPG Signal |
Here, the value of CC= 0.435 and the signal is fully corrupted by motion artifact, as the value of maximum peak (current BPM) is 110.294.Here, the value of CC= 0.435 and the signal is fully corrupted by motion artifact, as the value of the maximum peak (current BPM) is 110.294.There are two ways to estimate HR depends on the value of CC.1. If CC > 0.52. If CC < 0.5When CC is greater than the threshold1. When CC is greater than 0.5 the PPG and acceleration signal both are used to estimate the HR.2. Acceleration signals exist there.3. PPG signal is considered corrupted due to noise and motion artifact.4. PPG1, PPG2, Acceleration signals are used to determine the Heart Rate.And when CC is lower than threshold value 0.5 then only PPG signal used to estimate HR.D. PPG and Acceleration Signal DecompositionIn Heart Rate monitoring process using wrist type PPG Ensemble Empirical Mode Decomposition (EEMD) is used to decompose the signals.E. Intrinsic Mode Function (IMF)In 1998, IMF was introduced by Huang, which is the result of the Empirical Mode Decomposition (EMD). IMF used to compute instantaneous frequency through the Hilbert Transform or any other methods. EMD has been extensively used to analyze various non-linear signals by decomposing data into a series of IMFs and a trend function through sifting processes. | (2) |
Fig. 5 & 6 shows signal decomposition of PPG and acceleration signal.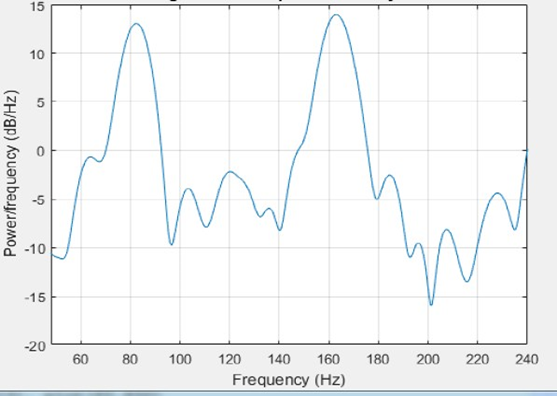 | Figure 5. Signal Decomposition of PPG signal |
 | Figure 6. Signal Decomposition of acceleration signal |
F. Reconstruction of PPG and acceleration signalAfter the decomposition process through CEEMD now the PPG and Acceleration both signals have to be reconstructed. So for the reconstruction following terms have to be followed.• First one and last three IMFs of PPG signals are removed as noise and motion artifact and after removing the PPG signal has been reconstructed.• Though acceleration signals are also used so the IMFs of the acceleration data is also calculated and has to remove the first and last three IMFs from here also.• The components of acceleration data that are correlated to the PPG signal has to be determined.• The each and every remaining IMFs of Acceleration Signals are individually correlated to reconstruct PPG signal.• Mid values have to find out and reconstruct the acceleration signals are reconstructed.• So both signals become reconstructed signals and both reconstructed PPG and Acceleration signals are obtained.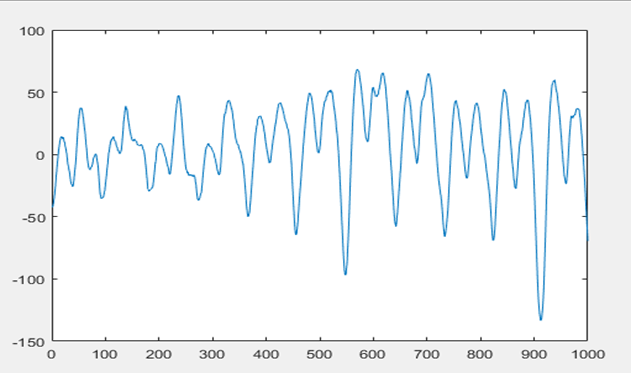 | Figure 7. Reconstruction of PPG signal |
G. Periodogram of PPG and Acceleration SignalNow after the process of reconstruction spectral peak has to be calculated again for this condition. The spectrum of reconstructed PPG and acceleration signal has been calculated by the periodogram. Following process need to be followed for periodogram.• Estimating spectral densities of any signal is known as Spectrum Computation (periodogram).• The spectrum of both PPG and Acceleration signals are estimated through Periodogram.• Periodogram estimates the Spectral Peak by using the Fast Fourier Transform (FFT).• The number of FFT points is fixed at 4096.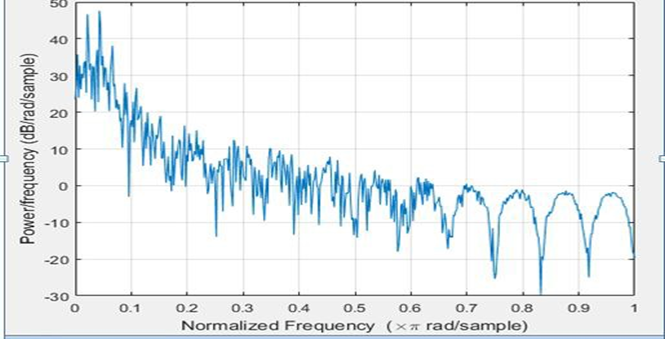 | Figure 8. Periodogram of PPG signal |
H. Spectrum SubtractionFor noise reduction form the signal, spectral subtraction method is used. In this method, an average signal spectrum and average noise spectrum are estimated and subtracted from each other. This is how signal-to-noise ratio (SNR) is improved. In Heart Rate estimation process spectrum subtraction is required.I. HR EstimationWhen CC<0.5, then only PPG signals are used to estimate the heart rate. But on the other hand if CC>0.5, then PPG and acceleration signals both have equal importance for heart rate estimation. In CC>0.5 after the process of periodogram reconstructed PPG and acceleration signals are needed to converted into signal scaling to measure the accurate peak. After scaling due to Spectral Subtraction, finally, exact Heart Rate can be measured.
3. Result & Calculation
In this research, several figures were described, where the modified estimated heart rate is also determined. The figures in this chapter are described in two ways. These ways are; with tracking & without tracking. There is 12 data set used for this research.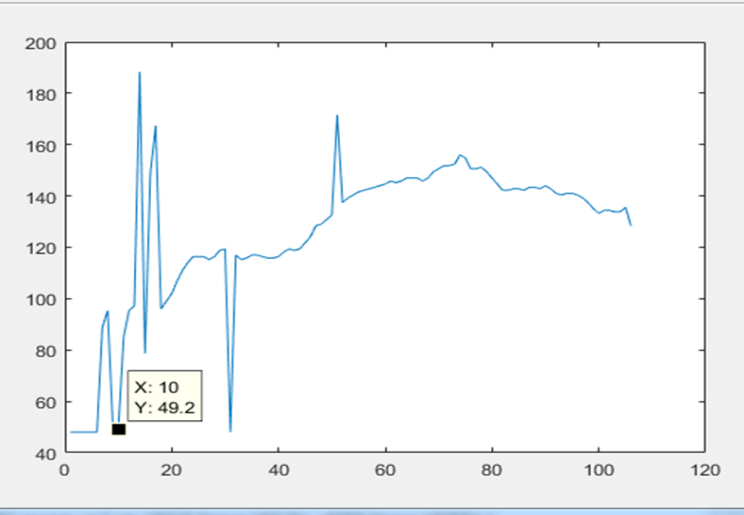 | Figure 9. Heart Rate Estimation for data set 4 without tracking |
In this figure, the estimated heart rate of data no. 10 is 49.2 BPM.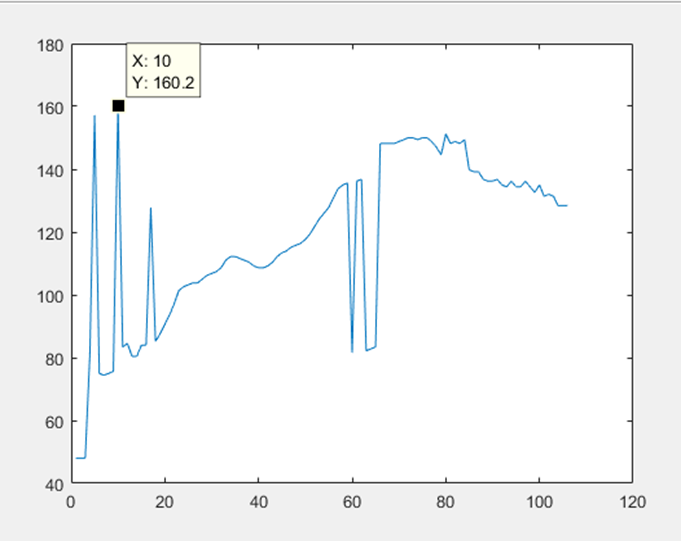 | Figure 10. Heart Rate Estimation for data set 8 without tracking |
In this figure, the estimated heart rate of data no. 10 is 160.2 BPM.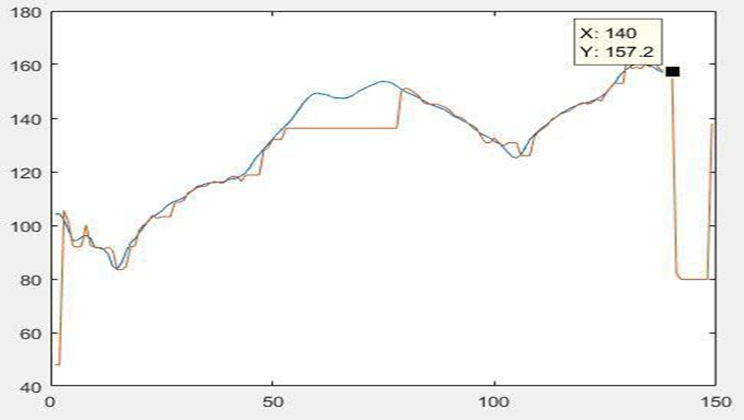 | Figure 11. Comparison Heart Rate Estimation for data set 12 with & without tracking |
In this figure, the estimated heart rate with tracking of data no. 140 is 157.2 BPM. 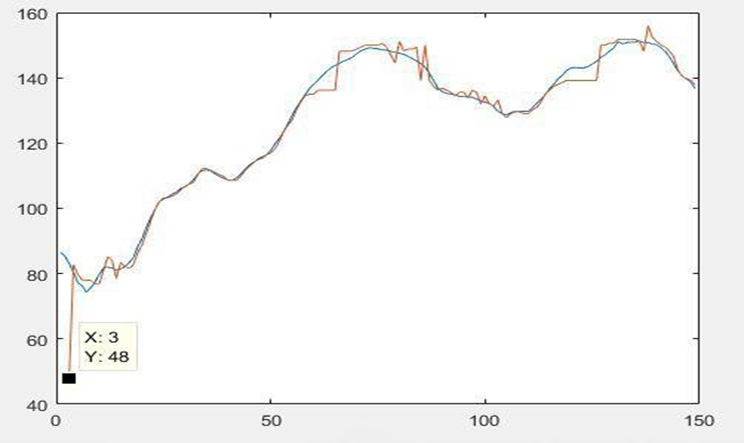 | Figure 12. Comparison Heart Rate Estimation for data set 9 with & without tracking |
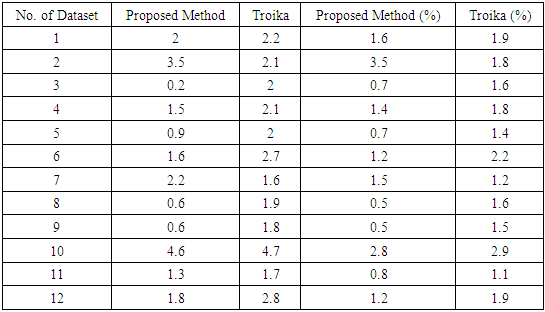
In this figure, the estimated heart rate with tracking of data no. 3 is 48 BPM. Here, Blue line represents HR with tracking and Orange line represents HR without tracking.Here Table 1 show the comparison of our proposed method with Troika Method in term of average absolute error.Table 1. Average absolute error (Aerror) and average error percentage (APerror) for all 12 datasets using the proposed method and TROIKA
 |
| |
|
4. Conclusions
In this paper a signal processing technique has been discussed, it removes motion artifacts from PPG signals. The framework discussed here mainly consists of signal decomposition, signal reconstruction. Removing motion artifacts by signal decomposition has been the main highlight of this work.
References
| [1] | M. Ram, K. V. Madhav, E. H. Krishna, N. R. Komalla, and K. A. Reddy, “A novel approach for motion artifact reduction in PPG signals based on AS-LMS adaptive filter,” IEEE Trans. on Instrumentation and Measurement, vol. 61, no. 5, pp. 1445-1457, 2012. |
| [2] | X. Sun, P. Yang, Y. Li, Z. Gao, and Y. T. Zhang, “Robust heart beat detection from photoplethysmography interlaced with motion artifacts based on empirical mode decomposition,” Proc. of IEEE-EMBS conf. on Biomedical and Health Informatics (BHI), pp. 775-778, 2012. |
| [3] | H. Fukushima, H. Kawanaka, M.S. Bhuiyan, and K. Oguri, “Estimating heart rate using wrist type photoplethysmography and acceleration sensor while running,” Proc. of IEEE conf. on Engineering in Medicine and Biology Society (EMBC), pp. 2901-04, 2012. |
| [4] | M. Raghuram, K. V. Madhav, E. H. Krishna, and K. A. Reddy, “Evaluation of wavelets for reduction of motion artifacts in photoplethysmographic signals,” Proceedings of IEEE conf. on Information Sciences Signal Processing and their Applications (ISSPA), pp. 460-463, 2010. |
| [5] | B.S. Kimand S. K. Yoo, “Motion artifact reduction in photoplethysmography using independent component analysis,” IEEE Trans. on Biomedical Engineering, vol. 53, no. 3, pp. 566-568, 2006. |
| [6] | Zhilin Zhang, Zhouyue Pi, and Benyuan Liu, “Troika: A general framework for heart rate monitoring using wrist-type photoplethysmographic signals during intensive physical exercise,” Biomedical Engineering, IEEE Transactions on, vol. 62, no. 2, pp. 522–531, 2015. |

 Abstract
 Reference
 Full-Text PDF
 Full-text HTML