Nabil Khatib, El Houssaine Ouacha, Bouazza Faiz, Mohamed Ezzaidi, Hicham Banouni
Laboratory of Metrology and Information Processing, Ibn Zohr University, Faculty of Science, Agadir, Morocco
Correspondence to: Nabil Khatib, Laboratory of Metrology and Information Processing, Ibn Zohr University, Faculty of Science, Agadir, Morocco.
| Email: |  |
Copyright © 2018 The Author(s). Published by Scientific & Academic Publishing.
This work is licensed under the Creative Commons Attribution International License (CC BY).
http://creativecommons.org/licenses/by/4.0/

Abstract
Concrete produced today is usually mixed with either chemical additions to the cement, chemical admixtures in the concrete, or both. Thus, the change of properties of cementitious concrete, mainly the rheology and the setting and the hardening, is strongly dependent on the admixtures used. Alkali-accelerating admixtures used in shotcrete, alter a number of properties of the cementitious system, including its resistivity and early hardening behaviour. The main focus of this research was to investigate the possible use of ultrasound pulse echo method, using P-waves, to evaluate the influence of an alkali-accelerating admixture for shotcrete on mortar behaviour at early age. The sensitivity to alkaline accelerator and its dosage were evaluated. The tested mortar mixes contained Portland composite cement CPJ 45. The presence of alkali-accelerating admixture in the mortar mixes and its dosage, influence the evolution of the modulus of the reflection coefficient and the peak-to-peak amplitude of reflected echoes, during the early time of the hardening period. Also, the alkaline accelerator caused a significant reduction in young modulus at early ages, and this for all dosage tested.
Keywords:
Ultrasound, Pulse echo method, Mortar, Alkaline accelerator, Dosage
Cite this paper: Nabil Khatib, El Houssaine Ouacha, Bouazza Faiz, Mohamed Ezzaidi, Hicham Banouni, Study of Early Age Behaviour of Mortar Pastes with Different Dosages of Alkaline Accelerator for Shotcrete: The Use of the Ultrasound Pulse Echo Method, American Journal of Signal Processing, Vol. 8 No. 2, 2018, pp. 45-53. doi: 10.5923/j.ajsp.20180802.03.
1. Introduction
In both new construction and repairs, the shotcrete is used in almost any concrete project and typically results in a significant savings of time and money. It is the preferred material in the construction of many new structures from foundations up to domes and everything in between. Most advantages of shotcrete is fast development of its strength, which quickly ensures stability of strengthened structure.In this context, the accelerators of the setting become especially important when concrete (shotcrete) or mortar are spayed onto the tunnel walls for immediate temporary support following excavations in unstable ground, where a satisfactory adhesion to the substrate is required. Chemically, accelerating admixtures for shotcrete can be divided into four major groups [1, 2]: alkaline silicates, alkaline earth metal carbonates/hydroxides, sodium and potassium aluminates, and alkali-free accelerators often based on aluminum sulfate or calcium sulfoaluminate. Their primary acceleratory target is the aluminate phase, normally resulting in rapid workability loss. In this study, only an alkali-accelerating admixture is taken into consideration.Currently, the use of non-destructive techniques for characterizing the microstructure of cement-based materials and continuously monitor the setting and hardening behavior of cement paste has become an important research field [3-5]. Among these techniques, Ultrasound P-wave measurements technique has been greatly developed during the last two decades. By the 2000s, H. –W. Reinhardt, G.U. Grosse, Nele De Belie and other authors have successfully used this non-destructive technique to monitor the hydration process and formation of structure of different cement based materials, mostly on cement-mortar and shotcrete [6-8]. However, a big part of these authors has focused on using the ultrasound transmission method rather than the reflection method. Thus, the pulse echo method, i. e, the reflection method need just one transducer so it is less expensive than the transmission technique which requires two transducers. [9-14] stated that the reflection technique can be used to monitor the microstructure development during setting and hardening of cement-mortar and concrete.
2. Aim of the Research
The aim of the current research was to investigate the possible use of the ultrasound pulse echo measurements for monitoring the binding and hardening of mortar. The sensitivity to changes in alkaline accelerator dosage was evaluated.
3. Materials and Methods
3.1. Pulse echo Method
The pulse echo method, i.e. the reflection method uses a pulse which is reflected at the boundary of a known material and the material to be investigated. If a plane wave strikes at normal incidence the interface between two media (M1, M2) with different acoustic impedances, part of incident wave is reflected back and part is transmitted into the second medium. The peak-to-peak amplitude, App, of a pulse echo named E, is given by | (1) |
with A(E) is the amplitude of the pulse echo whose maximum and minimum are denoted MAX, MIN. Assume Z1 is the acoustic impedance of medium one (M1) with the incident wave and Z2 is the acoustic impedance of the connected medium two (M2) then the reflection coefficient is given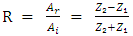 | (2) |
with Ar the maximum magnitude of the power spectrum of the reflected wave and Ai, the maximum magnitude of the power spectrum of incident wave. A negative reflection coefficient merely means that the second medium is lower impedance (Z2 < Z1) than the first. When the second medium is higher impedance, the reflection coefficient takes a positive sign. In order to avoid this reversal of sign behavior in our study, the measurements of reflection coefficient will be done in modulus.In our case, immersion testing is used with water as a couplant. This testing technique has a distinct advantage over contact testing in that the water bath provides a source of constant coupling to the container [15]. However, a large part of the energy that strikes the interface between the water and the part being inspected in immersion testing is reflected back into the fluid. Using this technique, the amplitude of incident wave is hardly defined. At M1/Vacuum interface (Z2 = 0) the transmission coefficient is zero and the reflection coefficient is minus one. The acoustic impedance of air is so much smaller that for all practical purposes, the air can be neglected and the Material/Air interface treated as a Material/Vacuum interface instead.Therefore, the modulus of reflection coefficient on M1/air interface is 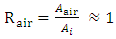 | (3) |
with Aair the maximum magnitude of the power spectrum of reflected wave on the M1/air boundary and Ai the maximum magnitude of the power spectrum of the incident wave. Thus, the reflection coefficient R expression became | (4) |
with Ar the maximum magnitude of the power spectrum of the reflected wave at the interface M1/M2 and Aair the maximum magnitude of the power spectrum of the reflected wave at the interface M1/Air. The density is | (5) |
with  , ultrasonic pulse velocity in the material. In the 1D case if the cross-section remains the same
  with E, Young’s modulus. Thus, the advantage of the reflection method is that only the amplitude of the reflected pulse has to be measured and access is only needed to one side of the material.
3.2. Container
Mortar to be characterized is contained in a parallelepiped container (8 x 12 x 3.32 cm3). The container, transducer and a steel carrier are fully submerged in a room temperature filled with water and regulated at ambient temperature of 25°C.The steel carrier is dimensioned in the laboratory before being manufactured by a subcontractor. This support keeps the transducer and the container so that the transducer side which generated a pulse is parallel to the surface of the container that received the pulse in the first place and away from a distance of 8.8 cm therefrom. Figures 1 and 2 show the results of the development of the steel carrier and the container respectively.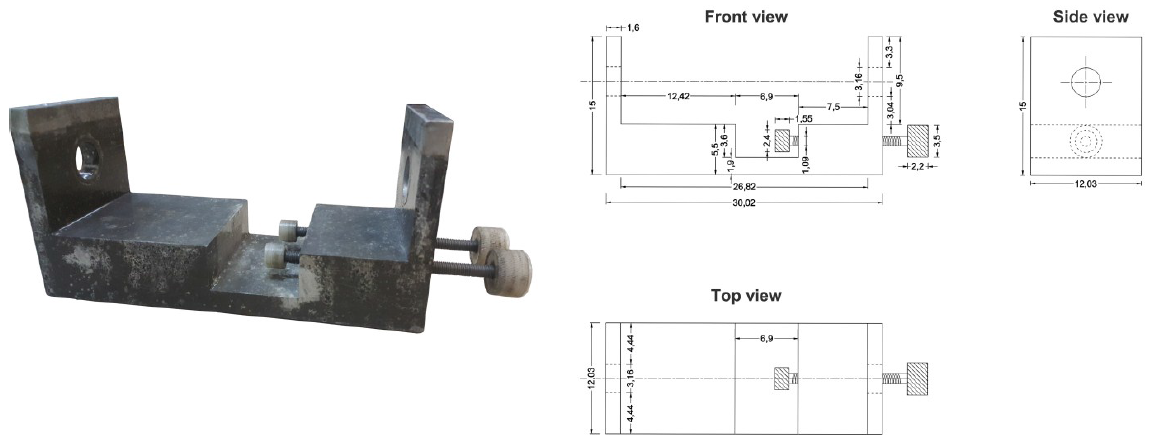 | Figure 1. Views of the steel carrier |
 | Figure 2. Views of the container |
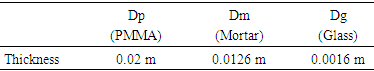
The container consists of one polymethacrylate (PMMA) wall and a glass wall as is shown in Figure 2. The polymethacrylate (PMMA) is chosen for its high acoustic transmission capacity; this will transmit a large part of the P-wave to the mortar sample. Also, to monitor the setting and hardening behaviour of the cementitious materiel as well as its microstructure, transparent glass is used as a reflective medium, thus a large part of the ultrasound wave transmitted to the mortar will be reflected by the front side of the glass plate.The PMMA plate and mortar sample are chosen as thick as possible to avoid overlapping echoes. The thicknesses Dp, Dm and Dg respectively of PMMA plate, mortar sample and glass plate are represented in Table 1. Table 1. Thickness of PMMA plate, mortar sample and glass plate
 |
| |
|
Figure 3 shows a close view of the container and the P-wave transducer both mounted on the steel carrier.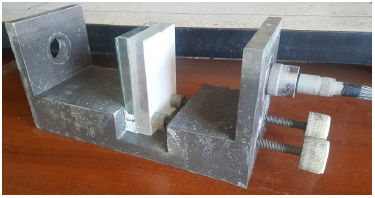 | Figure 3. Close view of the container mounted |
Figure 4 shows a signal composed of the different pulse echoes reflected at the separation surfaces of the different mediums of the container, i.e. The PMMA, the glass and the mortar, using the 1MHz central frequency transducer. The experimental method consists of the analysis of different reflected echoes.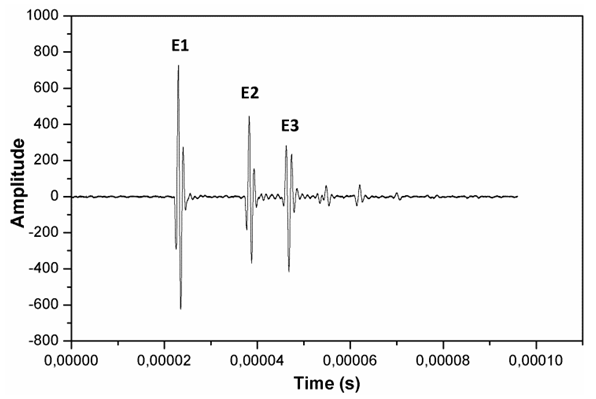 | Figure 4. Signal composed of pulse echoes reflected at container’s media |
The different paths taken by the ultrasound p-wave are shown in Figure 5. In the first place, the first pulse echo E1 is the part of the ultrasound signal reflected at the front of the PMMA. Once the other part of the signal is transmitted in the container, it travels through the PMMA. By the same process, the pulse echo E2 is reflected at the boundary between the PMMA plate and the mortar sample in the container. Continually, the ultrasound p-wave is partly transmitted in the mortar sample and the echo E3 is made by the reflection at the boundary between the mortar and the glass plate. In this research, only E2 and E3 echoes are taken into consideration in our US-measurements.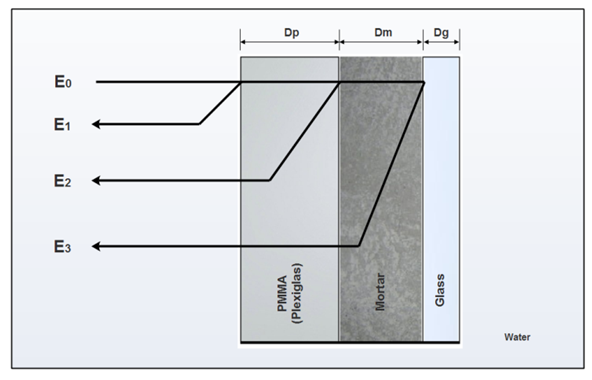 | Figure 5. Different paths of ultrasound pulse propagation in the container filled with mortar |
3.3. Hardware
The schematic of the ultrasound measurement system used to evaluate mortar samples in immersion testing is depicted in Figure 6. The broadband p-wave transducer is used successively as transmitter and as a receiver of ultrasound and is excited by an impulse generator (5052 PR Model, Sofranel, France). This immersion transducer is a panametric’s (V 302 Model) transducer with a central frequency 1 MHz.In our modern ultrasound NDE system, it is necessary to capture the received acoustic signals composed of a series of echoes so that they can be processed further and quantitatively evaluated. This is done through an analog-to-digital conversion process which is taken place inside a PC Oscilloscope (Picoscope 6403A Model, Pico technology) that is a transient recorder with 12 Bit amplitude resolution.In our ultrasound NDE testing, the A-scan, i.e. the voltage versus time is the type of display used for presenting the received signals. The voltage versus time trace is an analog signal, converted to digital form using the PC oscilloscope. This digitizer operates in a real time sampling mode, that captures an ultrasound waveform signal during one repetition time, for a simple pulse shape being sampled at a frequency of 625 MHz, where  is the time spacing between samples.Because the total time required to capture the signal in a real time mode is very small, the PC oscilloscope averages the signals received on twenty repetition cycles to reduce electronic noise.The file-size of a single US-measurement, i.e. one signal, contains between 600 and 650 KB. The data are transferred via an USB cable to a personal computer for further processing and analysis of the signal using a software. The results are made visible on a monitor. The transducer is mounted in the steel carrier and connected to the hardware as shown in Figure 6 just before filling the container with mortar and compacting it so that the first signal acquisition can be taken several minutes after mixing of the mortar. All subsequent signals acquisitions are taken and stored automatically.
 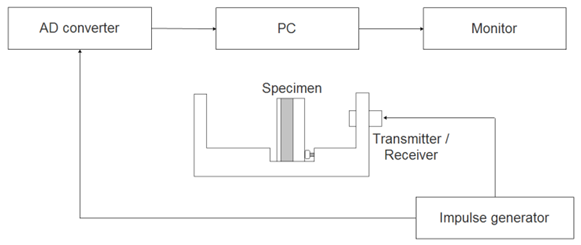 | Figure 6. Schematic of US-measurement |
3.4. Software
The software developed at the laboratory of metrology and information processing at the University of Agadir called USLab1 shows the received ultrasound signals and their frequency spectrum (using an FFT-algorithm) online during the experiment. A screen-shot showing the software at the end of an experiment is shown in Figure 7. The shown graphs are representing the last reflected signal composed of the different echoes and its frequency content – the whole experiment was finished after 72h. As a recording interval 5 min was chosen. In the software window, the recording interval can be set manually before starting to record signals. Continuously, the US-signals with their Fourier transform are recorded and plotted in the software window at the lower right and the lower left, respectively.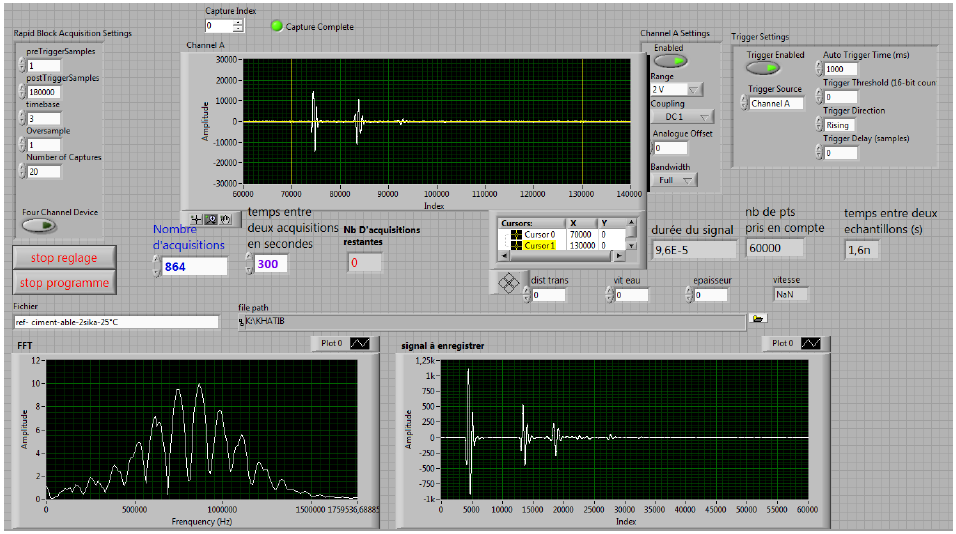 | Figure 7. Screen-shot of the software |
An offline version of the software allows further processing and analysis of the signals after the test, using algorithms for isolation of the different echoes and for measuring the US-parameters as well as presenting those parameters evolution vs. mortar age in curves.
3.5. Preparation of Mortar Specimens
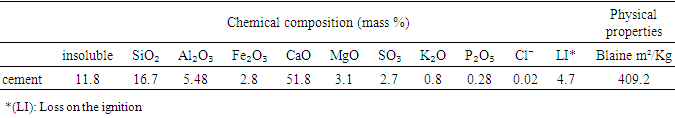
The reference mortar consisted of 140 g standard sand extracted from the river of OUED SOUSS, 70g cement, and 45.5 g water and was prepared according to EN 480-1 [16]. The grains of sand were selected by sieving and exclude those rejected on the Wire mesh having a mesh opening of 0.9 mm. The cement type was a Portland composite cement CPJ 45 (CEM II) produced in the cement plant of AIT BAHA, in the region of Agadir, according to NM 10.1.004 [17]. Their chemical composition and physical properties are displayed in Table 2.Table 2. Chemical compositions and physical properties of Portland composite cement CPJ 45
 |
| |
|
The tested admixture is an alkaline setting accelerator for shotcrete CIMACCEL NCL2. The accelerator dosage amounted to 0%, 1.7%, 3.4%, 5.1% of the cement weight used in tested mortar, according to the dosage rang required in the technical data sheets. First, cement and dry sand are mixed for 60 s. After that, water is added followed by 60 s mixing, then the accelerator was added and the mix procedure was concluded with 10 s mixing. The container was filled and compacted for about 30 to 60 s on a vibrating table. The vibration time was limited in order not to hamper the binding process.
4. Results
In our study, the measured US-parameters include the modulus of the reflection coefficient R of the echo E2 and the peak-to-peak amplitude of the echo E3. The results are shown in Figures 8 and 9 respectively. The different mortar mixes are coded as follows:- C (CPJ 45);- A1A (Alkaline based solution);- number representing the accelerator dosage in percentage of the cement weight used in tested mortar (0%, 1.7%, 3.4%, 5.1%).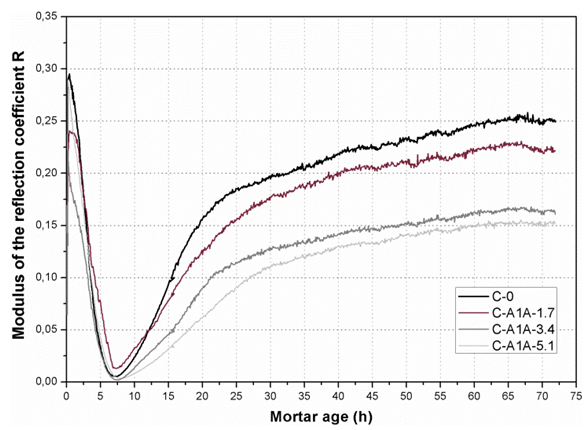 | Figure 8. The modulus of the reflection coefficient of echo E2 vs. age of mortar. Mortars were prepared using the cement type CPJ 45 and an alkaline accelerator dosage of 0%, 1.7%, 3.4% and 5.1% of the cement weight used |
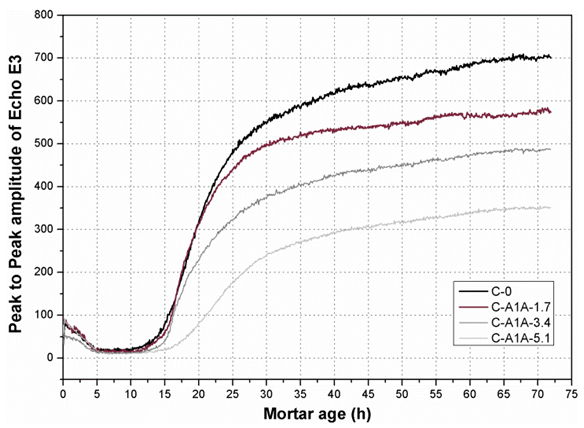 | Figure 9. The peak-to-peak amplitude of the echo E3 vs. age of mortar. Mortars were prepared using the cement type CPJ 45 and an alkaline accelerator dosage of 0%, 1.7%, 3.4% and 5.1% of the cement weight used |
The modulus of reflection coefficient curves all showed the same pattern. All mortar mixes were characterized by a very steep decrease of the modulus of the reflection coefficient from 0.2 – 0.3 to a minimum and this minimum was reached at an age between 7h and 8h. Continually, the modulus of reflection coefficient increases sharply at an age from 7h – 8h to 22h – 25h after which the modulus of reflection coefficient curve started to level off.In unaccelerated mortar samples with Portland composite cement, setting is normally completed within 6 to 7h. According to [6], alkaline accelerators can shorten the setting time, this means that a mortar age above 7h correspond meanly to a time of the hardening period. It is clear that the ultrasound measurements are sensitive to the effect of the alkaline accelerator and dosage on hardening behaviour of mortar. A stepwise increase in alkaline accelerator dosage resulted in more smoothly evolvement of the modulus of the reflection coefficient curve, at an age between 7h and 25h. Above 25h of mortar age, the increase in alkaline accelerator dosage resulted in decreasing values at which the curve had levelled off, indicating a quick change in solid phase connectivity. This change in the evolution of the modulus of the reflection coefficient could be partly explained by an attenuation of the ultrasound signal, which is propagated in the mortar samples. For all mortar mixes, the peak-to-peak amplitude curves had the same shape: a decrease from 50 – 100 to a minimum at which the curves stabilized at an age between 5h and 10h. After that, the peak-to-peak amplitude curves increase sharply at an age between 10h and 25h before they levelled off. The rate of the peak-to-peak amplitude increase as well as the leveling off value depend on the alkaline accelerator dosage and based on the peak-to-peak amplitude curves more or less the same classification of mixes could be made as based on the modulus of reflection coefficient. Figures 10 and 11 show respectively the effect of alkaline accelerator and dosage on young modulus E and density of mortar samples at early age. The measurements of the two parameters had been made at 3 ages of mortar samples: 24h, 48h and 72h.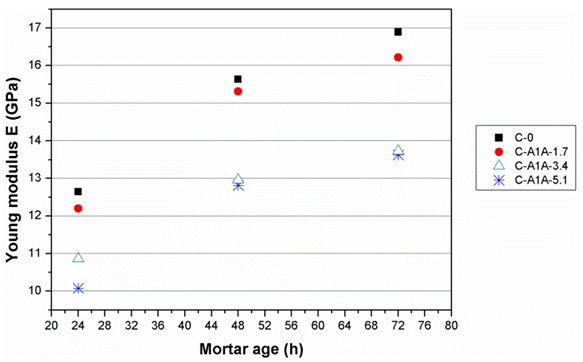 | Figure 10. Effect of alkaline accelerator and dosage on the young modulus E at 24h, 48h and 72h of mortar age |
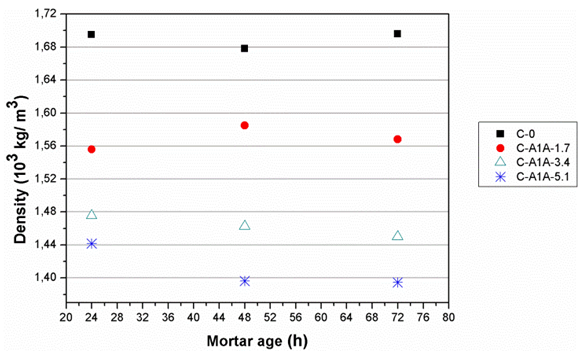 | Figure 11. Effect of alkaline accelerator and dosage on density of the mortar samples at 24h, 48h and 72h of mortar age |
An increase in alkaline accelerator dosage caused a significant reduction in the young modulus E in comparison with reference without accelerator. A dosage of 1.7% caused a reduction in the young modulus E with about 3.5% at 24h of mortar age and with 4% after 72h while the reduction reached 18% for a dosage of 3.4% and by 19.5% for a dosage of 5.1%, at 72h. The young modulus reduction was as high as 19.5% when a dosage of 5.1% of the alkaline accelerator was applied. This could be partly explained by an increase in the void volume, since the mortar density decreased significantly for these mixes e.g. by about 17.5% for a dosage of 5.1% at 72h of mortar age.
5. Discussion
The main mineral phases found in Portland composite cement are tricalcium silicate (3CaO.SiO₂), dicalcium silicate (2CaO.SiO₂), tricalcium aluminate (3CaO.Al₂O₃), and tetra-calcium aluminoferrite (4CaO.Al₂O₃.Fe₂O₃) as well as calcium sulfate (CaSO₄), which is mixed with clinker to prevent rapid hydration of tricalcium aluminate. In an abbreviated notation differing from the normal atomic symbols, these compounds are designated as C₃S, C₂S, C₃A and C₄AF where C stands for calcium oxide (lime), S for silica, A for alumina, F for iron oxide and H for H₂O (water).Each of the four main cement minerals reacts at a different rate and tends to form different solid phases when it hydrates.It should be noted that during the Portland composite cement hydration process all the minerals dissolve into the same pore solution. | (6) |
 | (7) |
 | (8) |
 | (9) |
 | (10) |
All hydration reactions occur simultaneously. Reactions (1) and (2) of the two calcium silicates (C₂S, C₃S) hydration lead to the formation of the calcium silicate hydrate (3CaO.2SiO₂.3H₂O) and calcium hydroxide (Ca[OH]₂) which has the mineral name Portlandite. These compounds are given the shorthand notation C-S-H (represented by the average formula C₃S₂H₃) and CH respectively. C-S-H gel morphology consisting of intertwined fibers gives cement paste its high strength. The hydration of the tricalcium aluminate and tetra-calcium aluminoferrite is somewhat more complex than that of the calcium silicate minerals, and the reactions that take place depend on whether sulfate ions are present in the pore solution. In presence of gypsum (CaSO₄, 2H₂O) and water, C₃A turn into mineral Ettringite (C₃A, 3CaSO₄, 32H₂O). Since all Portland composite cements contain gypsum, reaction (5) is the main hydration reaction for C₃A. When the gypsum in the Portland composite cement reacts completely before the C₃A, then the concentration of sulfate ions in the pore solution decreases drastically and the Ettringite becomes unstable and converts to monosulfoaluminate (C₃A, CaSO₄, 12H₂O) via the reaction (4). When calcium sulfate is completely depleted, C₃A finally hydrate in pure water to form stable calcium aluminate hydrates (C₃A, 6H₂O). According to [18], C-S-H leads to substantial strength gain, and represents about 70% of the hardened cement matrix. Portlandite contributes little to the early strength of cement; its content is about 20%. Ettringite and monosulfoaluminate also contribute to mechanical strengths, and represent about 10% of the hardened cement matrix. The hydration reactions of C₃A and C₃S are very rapid whereas that of C₂S and C₄AF occur more slowly. Makar and al. used differential isothermal calorimetry [19, 20] and high resolution cold field emission SEM [21] to show that during the accelerated hydration, there was an exothermic event of short duration, which they ascribed to “re-initiation of rapid C-S-H formation”. Having a positive coefficient of thermal expansion, the apparent volume of mortar changes due to the temperature variation. Thus, the acceleration of the hydration kinetics gives rise to a progressive increase in the temperature of mortar. According to [22], the temperature rise in the mortar enables the evaporation of water contained in the capillaries of the hydrated cement paste from their ends exposed to air having a hygrometric degree lower than that of the capillary network, allowing the drying shrinkage to develop. In addition to drying shrinkage, other forms of shrinkage develop in the mortar. Endogenous shrinkage or self-desiccation is another form of volume contraction that accompanies the drying shrinkage. It occurs during the hydration phases of calcium silicates and it develops isotropically throughout the mass of the mortar. These forms of shrinkage are constraints of many cementitious materials. They are largely responsible for cracking of hardened concrete materials, thus forming pathways for aggressive substances. These problems are encountered in many structures based on this materials. Indeed, the cracks open when the tensile forces created by the capillary forces in the hydrated cement paste exceed the tensile strength of the cementitious material [22].[6] mentioned that accelerators can shorten the setting time either by affecting the C₃A-hydration or by influencing the rate of C₃S-hydration and found that the alkaline accelerator resulted in a faster microstructure development, thus a quick change in connectivity of the solid phase. This mainly means that a stepwise increase in the alkaline accelerator dosage accelerated the hydration reactions, those allowing the formation of the C-S-H, responsible for the strength of the hardened cement paste, as well as allowing the formation of Portlandite CH. Therefore, the temperature of mortar increases. Our data show that a stepwise increase in the alkaline accelerator dosage caused a gradual decrease in mortar density. According to [6], the decrease in mortar density could be partly explained by an increase in the void volume. Based on the interpretation of De Belie and al. [6], the increase in alkaline accelerator dosage resulted in a more voluminous occupation of the capillary network in the tested mortar.The young's modulus indicates the resistivity of a material against deformation caused par loading. The results confirm that this resistivity decreases when our cementitious material is mixed with alkaline accelerator and that the stepwise increase in its dosage caused a progressive decrease in young modulus of the hardened cement paste. Also, [6] found that only the alkaline accelerator caused a significant reduction in the compressive strength in comparison with the reference mortar without accelerator, and this for all the dosages tested.As a synthesis of this work, the progressive increase in the alkaline accelerator dosage provokes a volume expansion of the capillary network, which in turn caused a gradual increase in tensile forces generated by the capillary forces in the hardened cement paste and then a significant decrease in the resistivity of the mortar samples. Therefore, the cracks open gradually and then form abrupt discontinuities in the cementitious material. These discontinuities are among the major causes of attenuation of the ultrasound signal that propagates in the mortar samples. Alkaline accelerator has a principal function of shortening the setting period of cementitious materials. However, the results shows a big decrease in young modulus when rising the alkaline accelerator’s dosage from 1.7% to 3.4%, indicating a lower resistivity in the evaluated mortar pastes. Moreover, no significant decrease in young modulus was observed when increasing the accelerator’s dosage from 3.4% to 5.1%. In addition, the density decreases sharply even in early ages, when increasing the alkaline accelerator dosage from 1.7% to 3.4% and from 3.4% to 5.1%. So, it is recommended to use the alkaline accelerator in the field by a dosage not exceeding 1.7% of the cement weight used in the mixture, in order to avoid a significant decrease in the resistivity of the accelerated cementitious materials.
6. Conclusions
The ultrasound measurements were clearly sensitive to the effect of alkaline accelerator admixture and its dosage on the hardening behaviour of mortar. A stepwise increase in alkaline accelerator dosage resulted in more smoothly evolvement of the modulus of the reflection coefficient, at a period of 7h to 25h. Above 25h, the increase in alkaline accelerator dosage resulted in decreasing values at which the modulus of the reflection coefficient curve had levelled off. The rate of the peak-to-peak amplitude increase as well as the leveling off value depend on the alkaline accelerator dosage and based on the peak-to-peak amplitude curves more or less the same classification of mixes could be made as based on the modulus of reflection coefficient. The alkaline accelerator caused a significant reduction in young modulus in comparison with the reference without accelerator, and this for all dosage tested. This could be partly explained by an increase in the void volume, since the mortar density decreases significantly for these mixes.
References
| [1] | F.W. Lea, in: P.C. Hewlett (Ed.), Lea’s Chemistry of Cement and Concrete, Butterworth-Heinemann, Oxford, UK, 2004. |
| [2] | L.R. Prudêncio Jr., Accelerating admixtures for shotcrete, Cement and Concrete Composites 20 (1998) 213 – 219. |
| [3] | Chen,W.; Li, Y.; Shen, P.; Shui, Z. Microstructural Development of Hydrating Portland Cement Paste at Early Ages Investigated with Non-destructive Methods and Numerical Simulation. J. Nondestruct. Eval. 2013, 32, 228–237. |
| [4] | Sadowski, Ł.; Stefaniuk, D. Microstructural Evolution within the Interphase between Hardening Overlay and Existing Concrete Substrates. Appl. Sci. 2017, 7, 123. |
| [5] | Gregor Trtnik, Matija Gams, The use of frequency spectrum of ultrasonic P-waves to monitor the setting process of cement pastes, Cement and Concrete Research 34 (2013), 1-11. |
| [6] | N. De Belie., C.U. Grosse., J. Kurz., H.-W. Reinhardt., Ultrasound monitoring of the influence of different accelerating admixtures and cement types for shotcrete on setting and hardening behaviour, Cement and Concrete Research 35 (2005) 2087 – 2094. |
| [7] | H. W. Reinhardt., C.U. Grosse., Continuous monitoring of setting and hardening of mortar and concrete, Construction and Building Materials 18 (2004) 145 – 154. |
| [8] | Nicolas Robeyst., Christian U. Grosse., Nele De Belie, Measuring the change in ultrasonic p-wave energy transmitted in fresh mortar with additives to monitor the setting 39 (2009) 868 – 875. |
| [9] | Popovics, J.S.; Subramaniam, K.V.L. Review of Ultrasonic Wave Reflection Applied to Early-Age Concrete and Cementitious Materials. J. Nondestruct. Eval. 2014, 34, 267. |
| [10] | Y. Akkaya, T. Voigt, K. V. Subramaniam and S. P. Shah, Nondestructive measurement of concrete strength gain by an ultrasonic wave reflection method, Materials and Structures/ Matériaux et Construction 36 (2003) 507 – 514. |
| [11] | Chaix, J.-F.; Garnier, V.; Corneloup, G. Concrete damage evolution analysis by backscattered ultrasonic waves. NDT E Int. 2003, 36, 461–469. |
| [12] | M.I Valič., Hydration of cementitious materials by pulse echo USWR: Method, apparatus and applications examples, Cement and Concrete Research 30 (2000) 1633 – 1640. |
| [13] | T. Öztürk, O. Kroggel, P. Grübl, J.S. Popovics, Improved ultrasound wave reflection technique to monitor the setting of cement-based materials, NDT & E International 39 (2006) 258 – 263. |
| [14] | Hassan Bita, Bouazza Faiz, A. Moudden, H. Lotfi, El Houssaine Ouacha, Banouni Hicham, Ultrasound monitoring of a mortar hydration using Argand Diagram: The effect of sand grain size and temperature, Construction and Building Materials 155 (2017) 1003 – 1012. |
| [15] | Lester W, Schmerr Jr, in: Springer Nature, Fundamentals of Ultrasonic Nondestructive Evaluation - A Modeling Approach, Second Edition, Ames, Iowa, USA, 2016. |
| [16] | EN 480-1, Admixtures for Concrete, Mortar and Grout – Test Methods (2014). |
| [17] | NM 10.1.004, Liants hydrauliques – Ciments – Composition, spécifications et critères de Conformité (2003). |
| [18] | Noureddine Rafaï, Cement matrix compounds, Inside cement, The materials saga, N° 890, April-May 2008. |
| [19] | J.M. Makar, G.W. Chan, Derivative conduction calorimetry, Proceedings of the 12th International Congress on the Chemistry of Cement, Montreal, 2007. |
| [20] | J.M. Makar, G.W. Chan, K.Y. Esseghaier, A peak in the hydration reaction at the end of the cement induction period, J. Mater. Sci. 42 (2007) 1388–1392. |
| [21] | J.M. Makar, High resolution cold field emission scanning electron microscopy of cements, Proceedings of the 29th International Cement Microscopy Association Conference, Quebec City, 2007, pp. 472 – 489. |
| [22] | P.C. Aitcin, A. M. Neville, P. Acker, Integrated view of shrinkage deformation, Concrete International, 19 (1997). |

 Abstract
 Reference
 Full-Text PDF
 Full-text HTML