-
Paper Information
- Paper Submission
-
Journal Information
- About This Journal
- Editorial Board
- Current Issue
- Archive
- Author Guidelines
- Contact Us
American Journal of Signal Processing
p-ISSN: 2165-9354 e-ISSN: 2165-9362
2018; 8(2): 33-44
doi:10.5923/j.ajsp.20180802.02

Monitoring System for Power Transformer Windings Hot Spot Temperature Using Fiber Optic Sensors, Kalman Filter and Integration in SCADA System
 Abstract
 Reference
 Full-Text PDF
 Full-text HTML
Marcel Nicola, Claudiu-Ionel Nicola, Dumitru Sacerdoțianu, Iulian Hurezeanu, Marian Duță
Research, Development Division for Electric Equipment and Energy Efficiency, National Institute for Research, Development and Testing in Electrical Engineering – ICMET, Craiova, Romania
Correspondence to: Claudiu-Ionel Nicola, Research, Development Division for Electric Equipment and Energy Efficiency, National Institute for Research, Development and Testing in Electrical Engineering – ICMET, Craiova, Romania.
| Email: |  |
Copyright © 2018 The Author(s). Published by Scientific & Academic Publishing.
This work is licensed under the Creative Commons Attribution International License (CC BY).
http://creativecommons.org/licenses/by/4.0/

This article presents the implementation based on LabVIEW of a monitoring system using fiber optic sensors for the measurement of hot spot temperature of the transformer windings, which employs a Kalman filter to reduce the measurement noise, and is integrated into a SCADA (Supervisory Control and Data Acquisition) system. The system shows the online evolution of temperatures, automatically creates and prints reports, stores the acquired data as TDMS (Technical data Management Streaming) type files and in a MySQL Server type database. For the connection between the monitoring system and the SCADA a new OPC UA (OLE Object linking and embedding for Process Control Unified Architecture) is used, which simplifies the function collaboration and enterprise deployment. The developed monitoring system implements a unit to access and transmit real time data over the Intranet or Internet, using JSON (JavaScript Object Notation) for the communication between the integrated Web Server and the Web Browser, provides warning reports and sends an e-mail to default addresses. The monitoring of the acquired data, the system operation and SCADA integration of the system presented have been tested using both synthesized virtual signals and real signals. The presented system could be used for monitoring and SCADA integration of the power transformer windings hot spot temperature in the electric power transmission network.
Keywords: Power transformer, Fiber optics, Kalman filters, SCADA systems, Network servers
Cite this paper: Marcel Nicola, Claudiu-Ionel Nicola, Dumitru Sacerdoțianu, Iulian Hurezeanu, Marian Duță, Monitoring System for Power Transformer Windings Hot Spot Temperature Using Fiber Optic Sensors, Kalman Filter and Integration in SCADA System, American Journal of Signal Processing, Vol. 8 No. 2, 2018, pp. 33-44. doi: 10.5923/j.ajsp.20180802.02.
Article Outline
1. Introduction
- Energy is of national and international prime concern in terms of electricity generation, as well as and transmission. With the development of a city and increase in the population density, indoor and underground substations are prevalent in the downtown area in contrast to outdoor substations built in the outskirts of the city [1].The reliable operation of power transformers is of great importance to the operation of power equipment and represents a special problem, for the entire power system and inclusively for the environment [2, 3]. For cost related considerations, there is an ongoing effort to maintain the transformers in service for the longest period possible. The capacity of the transformer to dissipate the heat generated inside to the environment is in part the basic principle which reduces the transformer load capacity and life span. Consequently, the use of transformers can be improved based on information about transformer thermal behavior. The on-line comparison of a measurand, such as the winding temperature, with a calculated value, obtained using the physical model can be used to diagnose certain failures which develop rapidly [4-8]. Winding temperature is a very important measurand in power transformers, which defines the condition, load capacity and operating life of transformers [9].Every operator requires the accurate on-line measurement of the transformer winding hot spot temperature, as the ageing of the transformer insulation and the winding hot spot temperature during operation are interrelated, thus the operator can schedule short term and emergency overloading of the transformer above the rating on its name plate without compromising the estimated life of the transformer. Thus, the accurate measurement of the winding hot spot temperature is essential for the best use of the transformer for short term overloading. The transformer winding temperature is measured by means of the conventional traditional method largely used today, which is an indirect measurement technique, consisting of the calculated value based on thermal imaging proportional to load current. Because of its very high time constant, it doesn’t provide correct hot spot temperature especially for dynamic loading conditions, hence the scheduling of the overloading is not based on the actual ageing of transformer insulation, resulting in a necessity to develop some method and instrument for direct real time measurement of winding hot spot temperature [10-12]. The direct measurement of the internal temperature in transformers can be performed through electrical signals, infrared signals, and optical signals. The thermocouple, thermal resistance and other traditional measurement methods are susceptible to electromagnetic interference, and limited by service life; the operation of the infrared temperature measurement method used essentially for inspection is simple, but it is very difficult to be used for on-line detection. The traditional methods are also susceptible to background noise and electromagnetic interference [13, 14].The direct monitoring of the transformer windings hot spot temperature has the following advantages [15, 16]: - The direct winding temperature measurement provides important design information, heat-run testing, maximizing loading and maintenance; - Safely maximizes transformer loading; prevents catastrophic failure and emergency shutdowns by monitoring long-term, gradual transformer deterioration;- Allows improved timing for winding cooling requirements, to prevent overheating around hot spot near areas; - Gathers important information for organizing maintenance and replacement of units; - Instead of more and/or larger transformers, the overloading of transformers is frequently a better choice for operators and utilities; - The winding temperature is the main factor which generally determines the power transformer aging; - The loading to full capacity performed more frequently entailed better control of windings temperature. Various optical fiber sensors were presented in recent decades, with different operating principles. The greatest problem was at first the dielectric failure and fragile equipment which led to breakage during handling or installation. It was then improved accordingly and it has now been determined as a reliable and accurate method to instantly indicate the real time winding hot spot temperature, so the transformers can be overloaded at optimal levels to comply according to the variable load demand without affecting or degrading their design life [17, 18]. The measurement of the windings hot spot temperature using the fiber optics probe is based on several principles. In order to comply follow the requirements, the sensing probe must have the following properties, since it would be integrated into the high voltage winding spacer: good dielectric property; enough robustness for handling and installation; EMI and RFI proof; fit for high temperature operation; mineral oil compatibility; highly accurate and highly reliable [19, 20].The data filtering module has an important role for a data acquisition system which will be integrated into SCADA system. In terms of suppression of the statistical measurement noise, the best performance is achieved by using a Kalman filter [21].Modern SCADA provides proper monitoring of power transformer in order to maintain operations at an optimal level by identifying and correcting problems before they turn into significant system failures. In a monitoring system for transformer windings hot spot temperature, fiber optic sensors are located in remote locations, but they need centralized management, therefore the implementation of the SCADA network to acquire data from remote sites, process them in a centralized location and perform routine or emergency actions according to the sensed measured data is imperative [22-27].This paper presents a monitoring system based on fiber optic sensors for measuring the transformer windings hot spot temperature which uses a Kalman filter to reduce measurement noise. The system shows the online evolution of temperatures, automatically creates and prints reports, stores the acquired data as TDMS type files and in a MySQL Server type database in order to obtain the temperature evolution log and creates warning reports.For the connection between the monitoring system for windings hot spot temperature and the SCADA a new OPC UA (Unified Architecture) is used to address the above issues, and integrate services of traditional OPC into one OPC server, which simplifies the function collaboration and enterprise deployment. The developed monitoring system implements a unit to access and transmit real time data over the Intranet or Internet, provides warning reports for any emergency situation when the winding hot spot temperature exceeds the warning limits, and sends an e-mail to default addresses. Based on LabVIEW capability for parallel computing and multithreading, all system parameters are monitored together with the temperature of the power transformer windings in real time. The paper is organized as follows: Section 2 describes the main components of the monitoring system for transformer windings hot spot temperature: fiber optic sensors, data acquisition board, signal conditioning module, electro-optical converters and computer for servers and applications for SCADA integration.Section 3 presents the SCADA integration of the monitoring system. The implemented main software modules achieve data acquisition and filtering of acquired signals in order to reduce measurement noise by using a Kalman filter, write the filtered data in the OPC UA, MySQL, Web servers, show the instant evolution of the acquired values, achieve automatic reports, store the evolution in a database, manage the alarms by automatically sending to default email addresses, achieve integration into SCADA and allow the display of data on the Intranet/Internet via a Web Server which is embedded in the application.The paper ends with a section of conclusions describing the main aspects and advantages of the developed monitoring system for transformer windings hot spot temperature, some conclusions will be made and some ideas will be pointed out for continuation of work.
2. Description of the Monitoring System
- It’s a well-known fact that the indirect method of thermal simulation measurement or indirect calculation estimation of the transformer hot spot temperature is influenced by nominal parameters and it is difficult to get the accurate temperature. In addition, in the last decade, the direct method using fiber optic monitoring enables actual hot spot measurement by sensing temperature directly in the windings [10-14].For the direct method of monitoring the transformer winding hot spot temperature, a monitoring system, using fiber optic sensors in direct contact with the high voltage windings was achieved, tested, and integrated into the complex system for operating parameter monitoring in power transformers – SCADA.The proposed solution for the windings hot spot temperature monitoring system using fiber optic sensors is presented in Figure 1.
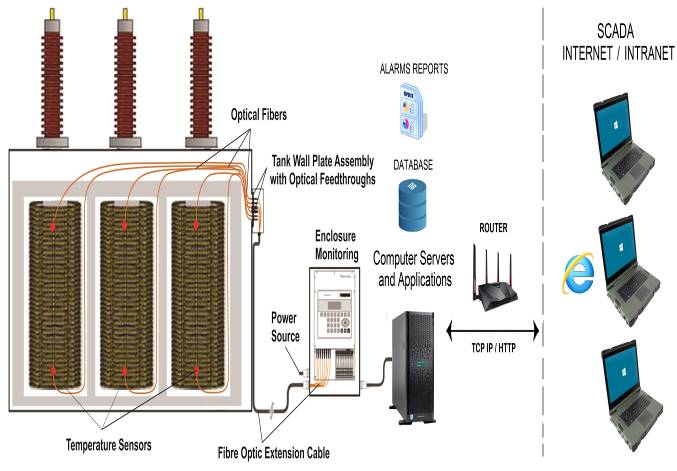 | Figure 1. The block diagram of the monitoring system |
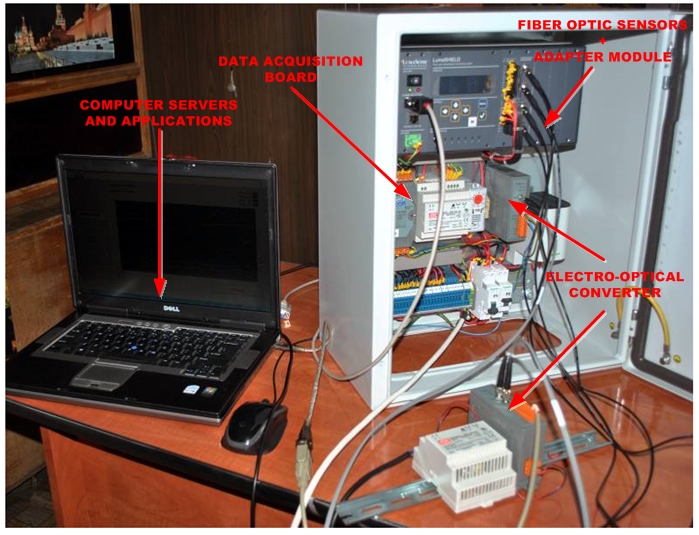 | Figure 2. Picture of the monitoring system |
3. SCADA Integration of the Monitoring System
- SCADA is a computer based system designed for the control and monitoring of technological processes and is the most modern concept and the tool used for the control and monitoring of technological processes. SCADA systems include both software and hardware components and processes the data in an acceptable time frame [24]. One of the most important functions of the SCADA systems is the monitoring and control function of the industrial process.The monitoring and control of technological processes is carried out by means of graphical pages which mimic the technological process and are displayed on one or more computer monitors. These graphical pages are also called HMI’s (Human Machine Interfaces) and we can thus state that the monitoring and control of technological processes is carried out via the HMI’s.Among the main functions of the SCADA system we can mention the following: the automatic control of the technological process in order to optimize the output parameters and in order to improve the efficiency; the real-time display of the technological process state; the graphical display of the process data with a view to creating efficient operating strategies; the efficient management of the process quantities record, the state of the equipment, and the condition of the alarms; the periodic generation of operation reports; the possibility of direct user intervention in the process depending on his rights of access; the possibility of remote process control by using SCADA client stations.A suitable development environment for the implementation of monitoring and SCADA integration applications is the LabVIEW environment, also referred to as G language, which is a graphical programming language using icons instead of lines of text to create applications. In contrast to text-based programming languages, where instructions determine the program execution, LabVIEW uses dataflow programming, where the flow of data determines the execution [25, 31-33]. The presented system contains sensors for temperature measurement based on optical principles and signal conditioning modules which transmit 4-20 mA signals to a data acquisition module.The signal is then conveyed through fiber optics via electro-optical converters to a dedicated computer.Figure 3 shows the architecture of the transformer winding temperature measurement application and the integration in the SCADA.
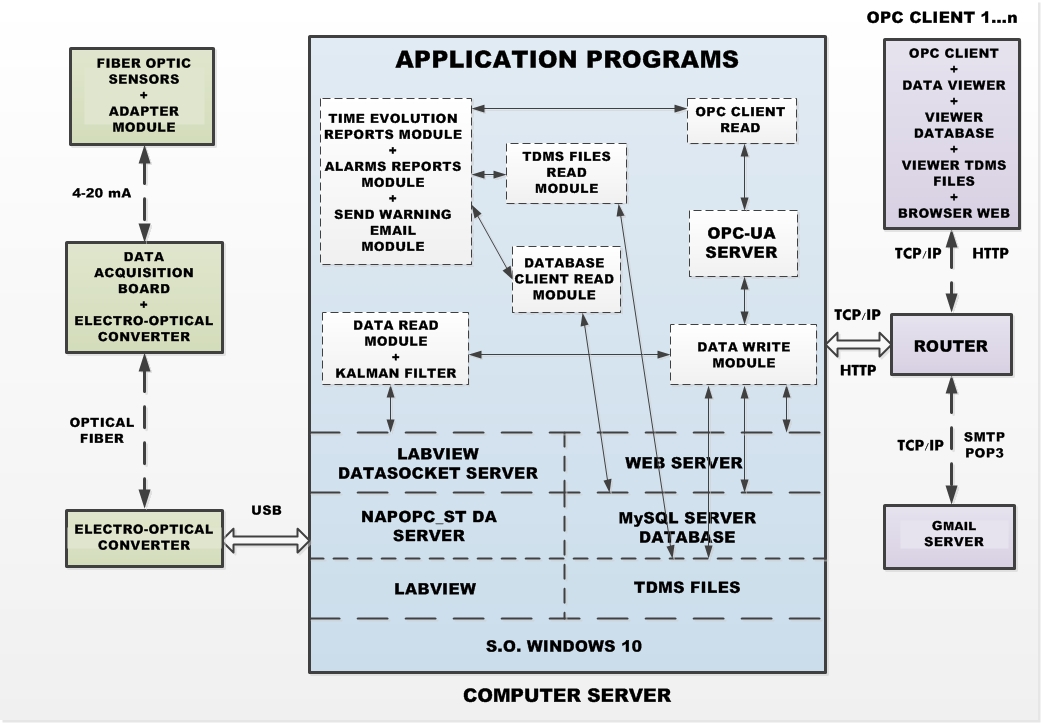 | Figure 3. Transformer windings hot spot temperature monitoring system integration in SCADA - Application architecture |
3.1. Kalman Filter
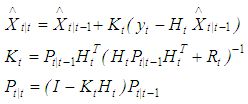
- For de-noising of the acquired winding temperature signals we use the time discrete Kalman filter with the predict-update equations as below [21]:Predict:
 | (1) |
 | (2) |
 - Estimated state;F - State transition matrix (i.e., transition between states);u - Control variables;B - Control matrix (i.e., mapping control to state variables);P - State variance matrix (i.e., error of estimation);Q - Process variance matrix (i.e., error due to process);y - Measurement variables;H - Measurement matrix (i.e., mapping measurements onto state);K - Kalman gain;R - Measurement variance matrix (i.e., error from measurements).Subscripts are as follows: t|t current time period, t-1|t-1 previous time period, and t|t-1 are intermediate steps.Because in this case F = 1, B = 0 we obtain the simplified equation as follows and Matlab script implementation is presented in Figure 3:Predict:
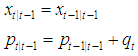 | (3) |
 | (4) |
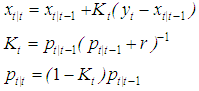
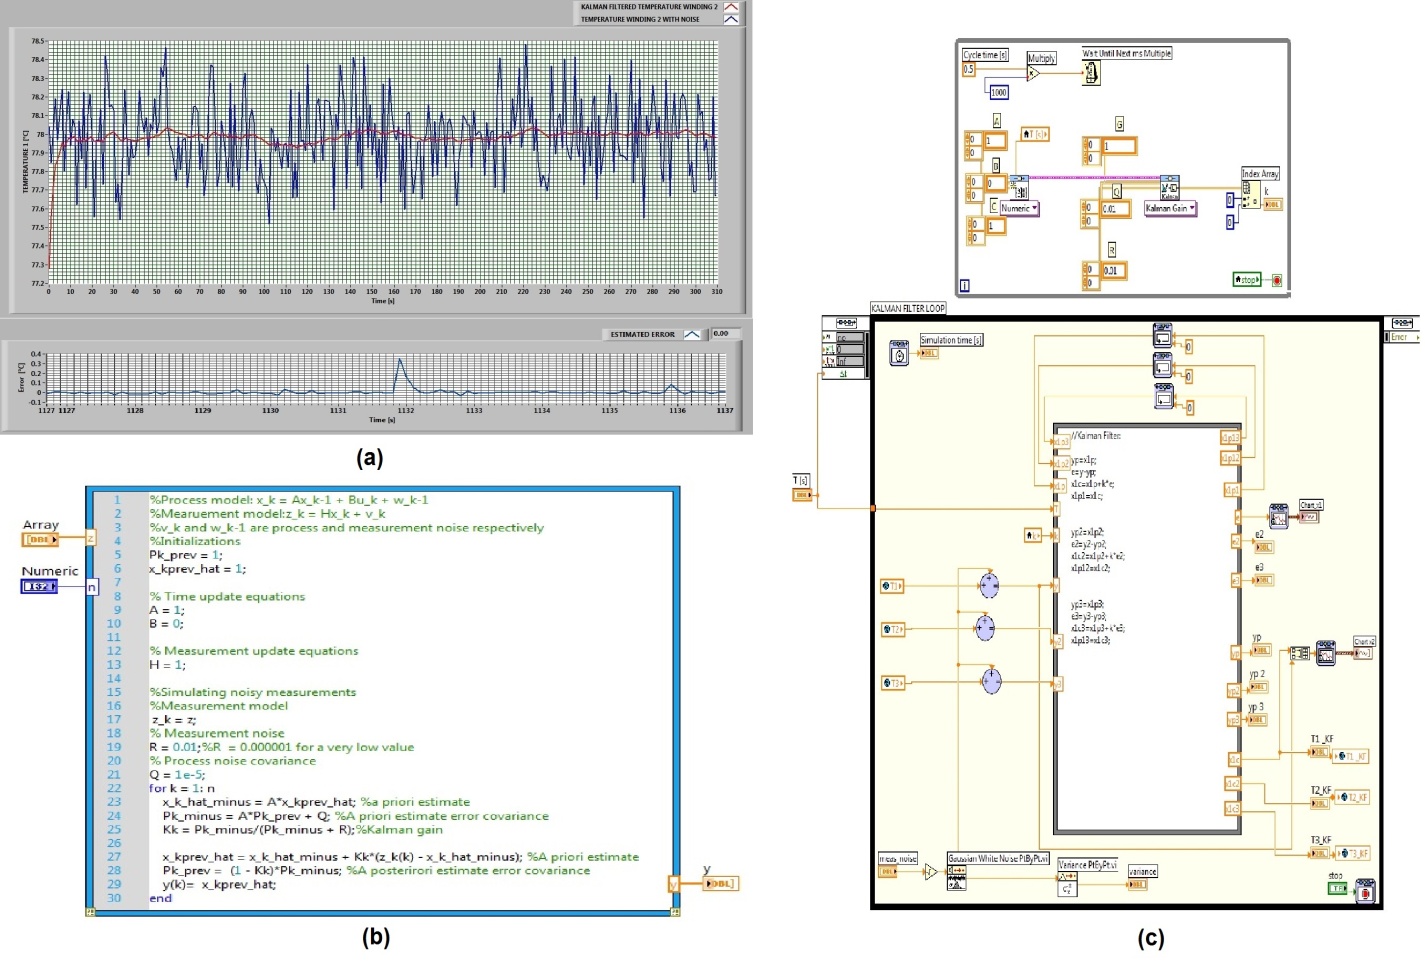 | Figure 4. Kalman Filter for windings hot spot temperature monitoring: (a) Time evolution temperature and error filtering, (b) MathScript implementation, (c) LabVIEW implementation |
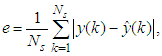 | (5) |
 is the estimated temperature signal. For the small value of the criterion indicated by (5) good approximations are obtained. For example, at 78°C of the second winding, using this criterion the estimation results found for 60 seconds, the absolute mean error by 0.171°C. This error is almost the same for the normal winding temperature for the interval 75 ÷ 85°C (normal operating range).
3.2. Application Programs
- The data acquired from the Data Acquisition board I-7017RC are read by the application program through the NAPOPC_ST DA Server which is a free OPC DA Server (DA stands for Data Access) for ICP DAS products. The NAPOPC_ST DA Server uses many subgroups of tags which belong to I-7017RC acquisition module when they are scanned for performing I/O modules. The NAPOPC_ST DA Server provides many benefits to users such as reduced time through lower system integration costs, easy integration with plug-and-play SCADA/HMI/Database, easy connection and interoperation to custom applications, access to data by anyone in the automation hierarchy, reduced troubleshooting and maintenance cost, synchronous and asynchronous writing to devices (not possible before OPC) [34].The SCADA/HMI/Database application software programs, contacts and obtains data from the NAPOPC_ST DA Server either on the same computer or on another computer.DataSocket for LabVIEW simplifies live data exchange between different applications on one computer or between computers connected through a network. Although a variety of different technologies exist today to share data between applications, including TCP/IP and dynamic data exchange (DDE), most of these tools are not targeted for live data transfer to multiple clients. It implements an easy-to-use, high-performance programming interface that is designed specifically for sharing and publishing live data in measurement and automation applications [35]. The OPC Unified Architecture (UA) is a new communication technology standard that was first released by the OPC Foundation in 2006 as an improvement on its predecessor, the OPC Classic. The OPC UA includes all the functionality found in the OPC Classic. This is done by bringing together the different specifications of the OPC Classic into a single entry point to a system providing current DA (Data Access) and A&E (Alarm & Events) combined with the history of both. Furthermore, the OPC UA is based on a cross-platform, business-optimized Service Oriented Architecture (SOA), which expands on the security and functionality found in the OPC Classic instead of the Microsoft-based COM/DCOM technology [36-38]. The OPC UA extends the functionalities of the original OPC model, the Classic OPC, by improving upon security and migrating to a platform-independent implementation based on standard web technologies. The improvements of the OPC UA overcome many of the challenges with the Classic OPC, and will help to drive the adoption of this open industry standard further in the Industrial Automation area as well as other application areas that require a standard, open, and secure communication interface [38-42].The integration into SCADA itself is carried out by delivering the values of interest to an open and flexible OPC UA Server, and the display of data is done via the OPC Read Module, which runs locally but can be installed on any HMI computer from SCADA. The Data Read Module and the Kalman Filter read the data acquired from the NAPOPC_ST DA server via DataSocket server performs data filtering and communicates them to the Data Write Module. This module writes the filtered data to the OPC UA type server (to be accessed by SCADA), in the MySQL Server and as TDMS type files (to achieve the logging and data archiving) and in the Web Server (to be accessed on the Intranet/Internet in a simple way through a web browser).The tree structure of the project containing the main modules of this application is shown in Figure 5, (a), and the OPC UA server interface is shown in Figure 5, (b).The software interface achieved by the TDMS Files Read Module, the Time Evolution Reports Module, the Alarms Reports Module and the Send Warning Email Module for viewing the instant evolution of the acquired values, achieving automatic reports, storing the evolution as TDMS-type files and managing the alarms is shown in Figure 5, (c). The block diagram for the communication made by the application between the NAPOPC_ST DA Server and the DataSocket Server is shown in Figure 5, (d). The block diagram for entering the data provided by the application in the OPC UA server for the integration into SCADA is shown in Figure 5, (e).
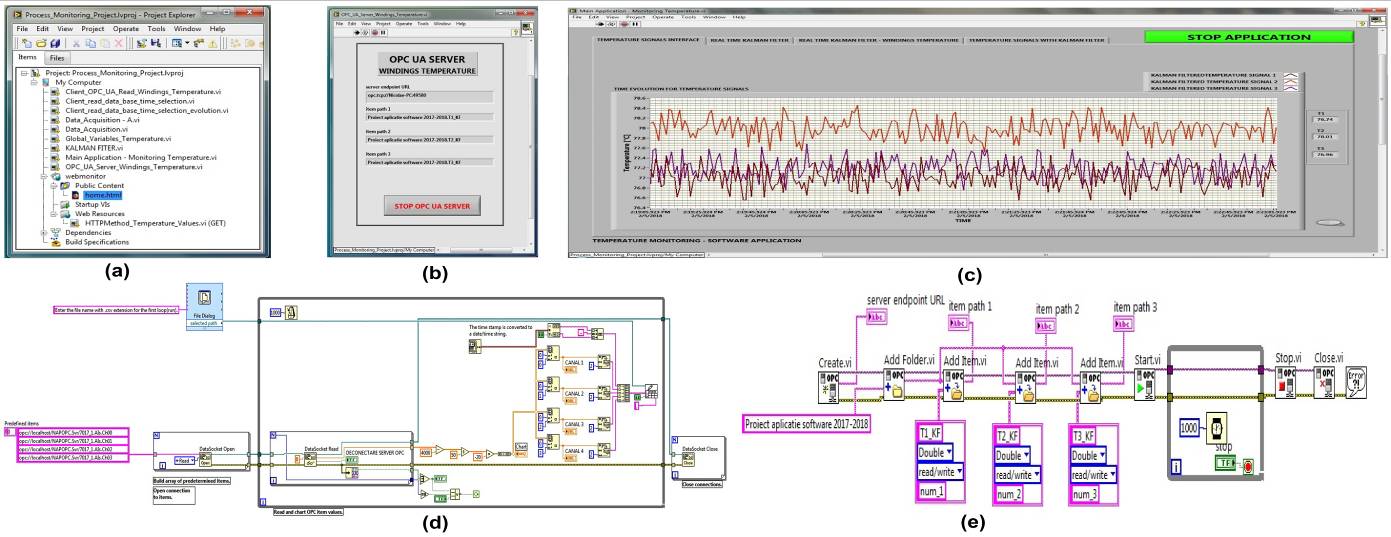 | Figure 5. Monitoring system – SCADA integration: (a) Tree structure of the project, (b) OPC UA Server interface, (c) Windings temperature time evolution, (d) Software block diagram data communication NAPOPC_ST DA Server and DataSocket Server, (e) Software block diagram OPC UA Server SCADA integration |
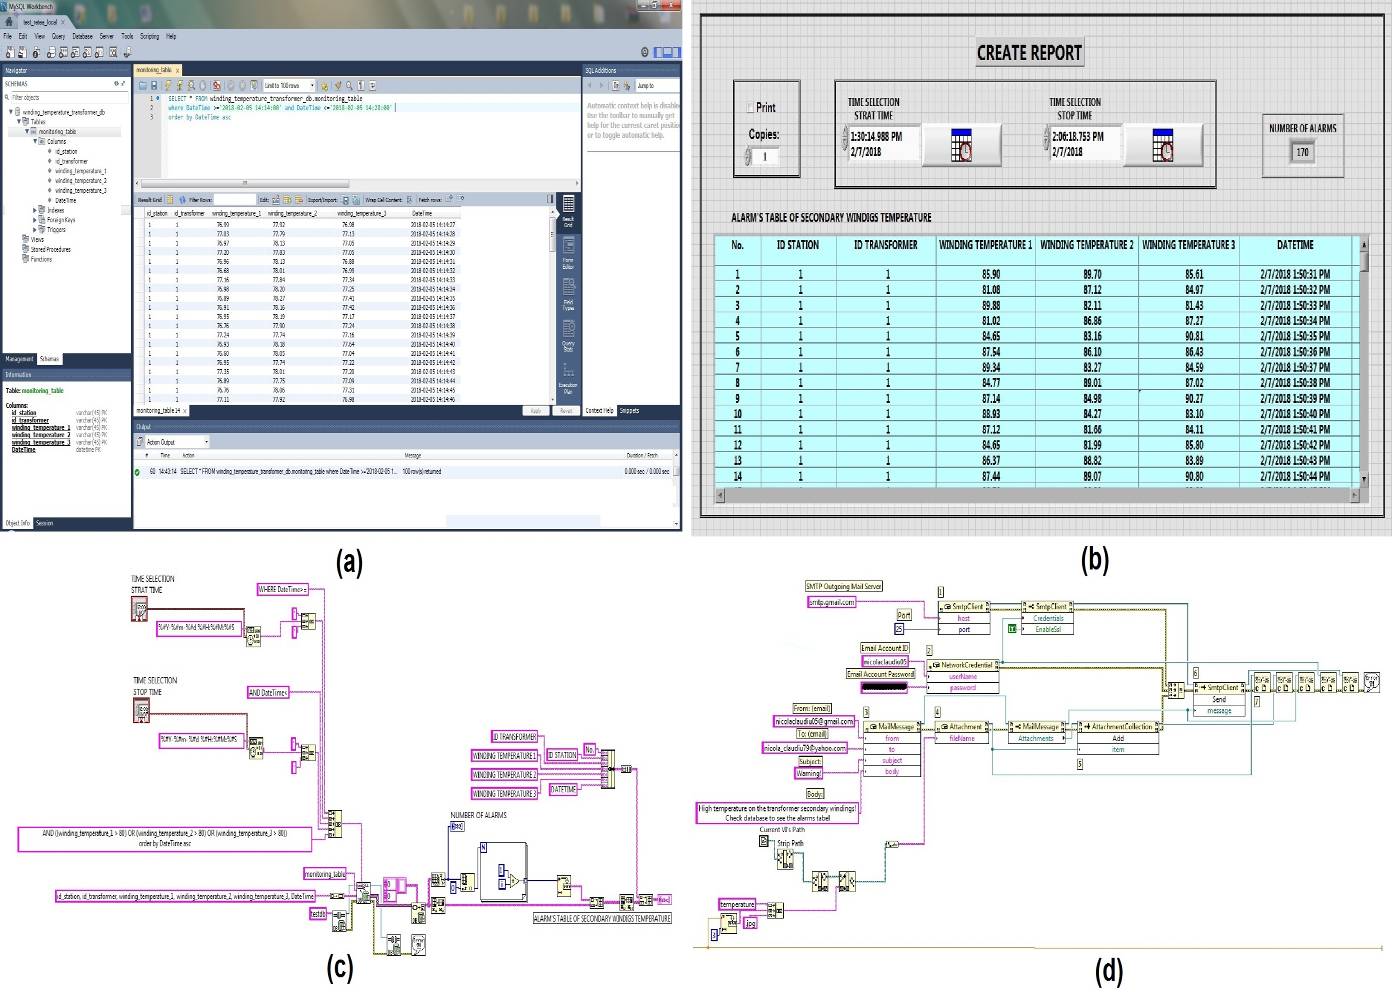 | Figure 6. Monitoring system – connection Database and Gmail Server: (a) Database structure, (b) Database selection, (c) Database Client Read Module software block diagram, (d) Send Warning Email Module software block diagram |
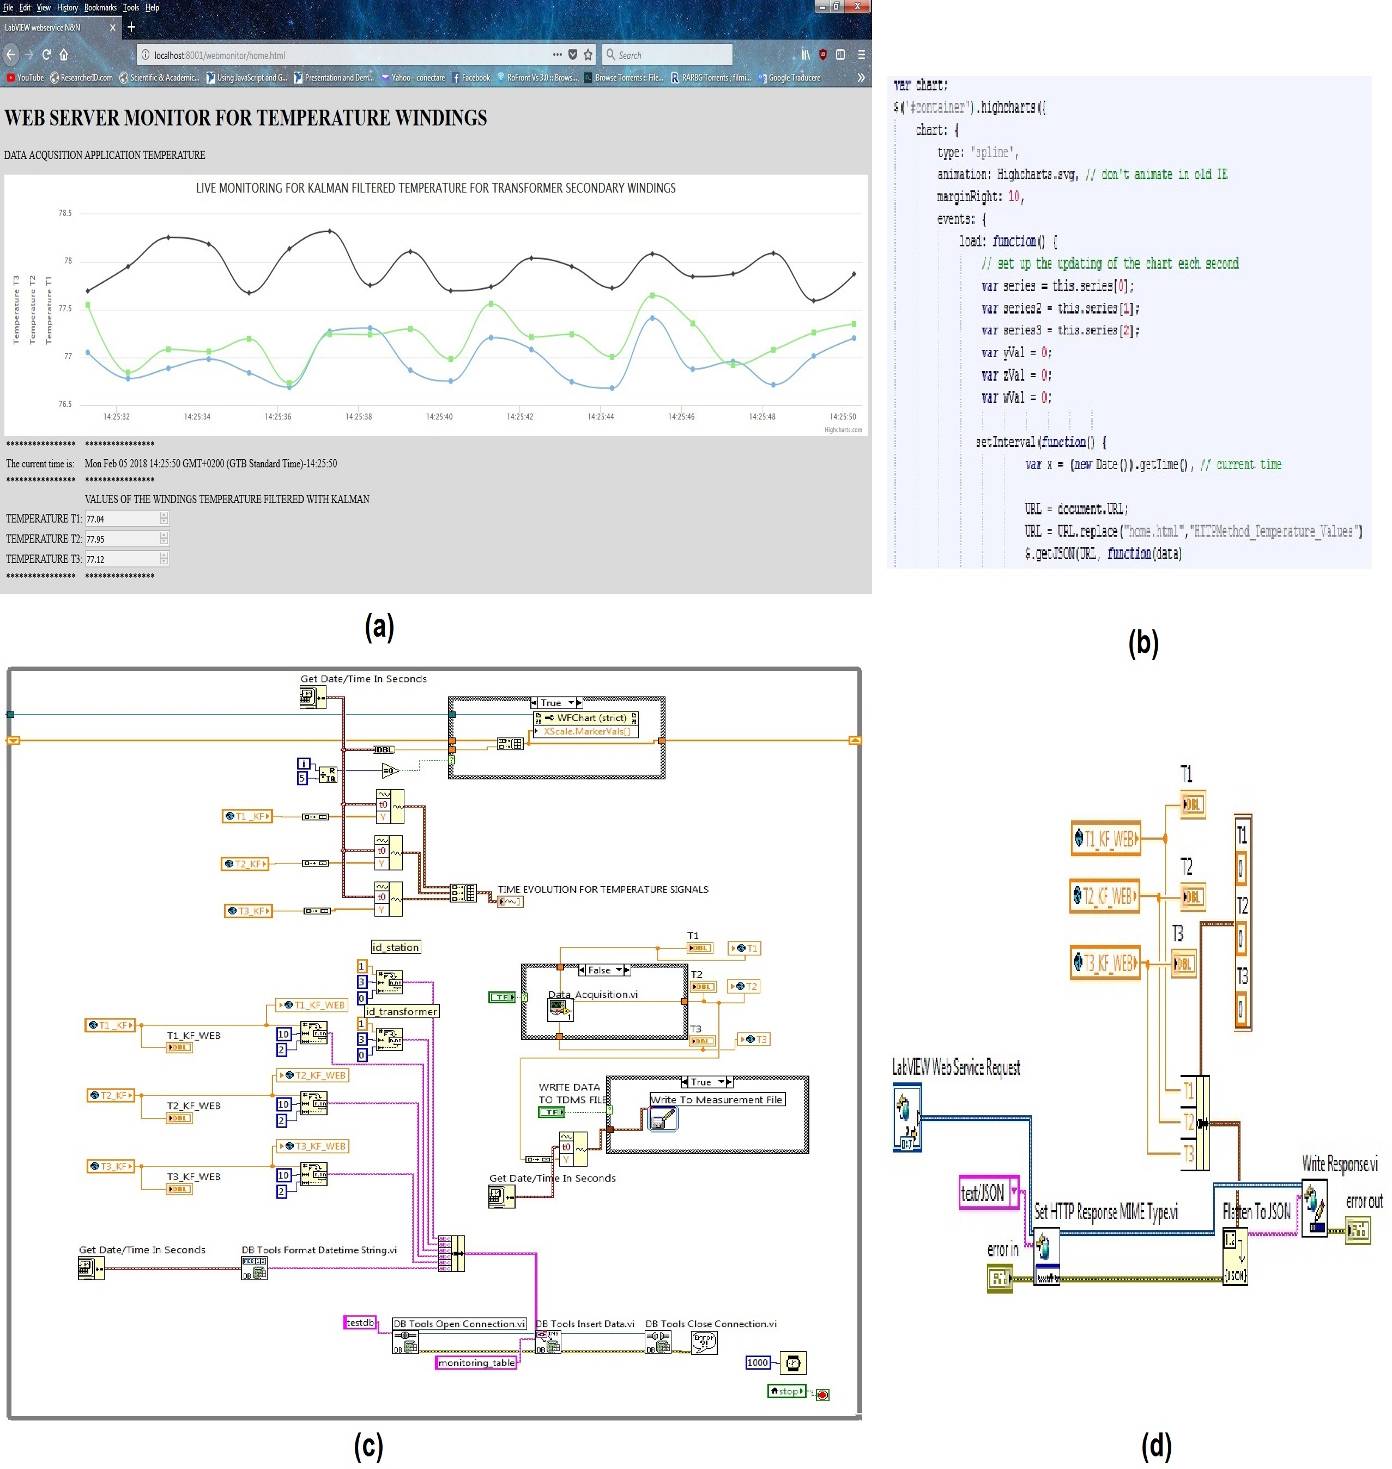 | Figure 7. Monitoring system – Intranet/Internet integration: (a) Windings temperature Web Browser time evolution (b) JSON – HTML implementation, (c) Web Server communication software block diagram, (d) LabVIEW WebService request for HTTP Method software block diagram |
4. Conclusions
- This article presents the implementation of a monitoring system based on fiber optic sensors for measuring the transformer windings hot spot temperature which uses a Kalman filter to reduce the measurement noise, and is integrated into a SCADA system.It presents the architecture and the main components of the monitoring system for transformer windings hot spot temperature: fiber optic sensors, data acquisition board, signal conditioning module, electro-optical converters and computer for servers and applications for SCADA integration.The implemented main software modules achieve the following: writing of the filtered data in the OPC UA, MySQL, Web servers, showing the instant evolution of the acquired values, achieving automatic reports, storing the evolution in a database, managing the alarms by automatically sending to default email addresses, achieving integration into SCADA and allowing the display of data on the Intranet/Internet through Via a Web Server which is embedded in the application.Instant information on winding hot spot temperature provides the reliability required for analysis of overload phenomena.Extensive and optimized versions of the implemented system will be approached in the future, especially in connection with the safety of data transmission and redundancy of main hardware.
ACKNOWLEDGEMENTS
- The paper was developed with funds from the Ministry of Scientific Research as part of the NUCLEU Program: PN 18 25 02 03.