-
Paper Information
- Paper Submission
-
Journal Information
- About This Journal
- Editorial Board
- Current Issue
- Archive
- Author Guidelines
- Contact Us
American Journal of Signal Processing
p-ISSN: 2165-9354 e-ISSN: 2165-9362
2018; 8(2): 27-32
doi:10.5923/j.ajsp.20180802.01

Electronic Health Care Monitoring System (EHCMS)
 Abstract
 Reference
 Full-Text PDF
 Full-text HTML
Musab Nur-Elhuda Mohammed, Faisal Mohammed Abd-Allah
Dept. Computer Science, Karary University, Khrtoum, Sudan
Correspondence to: Musab Nur-Elhuda Mohammed, Dept. Computer Science, Karary University, Khrtoum, Sudan.
| Email: |  |
Copyright © 2018 The Author(s). Published by Scientific & Academic Publishing.
This work is licensed under the Creative Commons Attribution International License (CC BY).
http://creativecommons.org/licenses/by/4.0/

We have developed offline & a real-time algorithms for detection of Q,R,S wave of ECG & PPG signals, monitoring patient continousley by doctor and rapidly increase of patient full health care (EHCMS) and suggest precautions to the patient before entering critical case, and classification of some disease that is faced patient depend on vital signs that is capturing from patient like bradycardia and tachycardia by analysis of Q,R,S wave, this work is part of M.I.C.U.
Keywords: Q,R,S wave, EHCMS electronic health care monitoring system, Vital signs, PPG photoplethysmograph, Bradycardia, Tachycardia, M.I.C.U mobile intensive care unit
Cite this paper: Musab Nur-Elhuda Mohammed, Faisal Mohammed Abd-Allah, Electronic Health Care Monitoring System (EHCMS), American Journal of Signal Processing, Vol. 8 No. 2, 2018, pp. 27-32. doi: 10.5923/j.ajsp.20180802.01.
1. Introduction
- An electrocardiogram, also called ECG or EKG, reflects the electrical activity of the heart. Every heart contraction produces an electrical impulse that is caught by electrodes placed in the skin, This paper proposed a system that is work in two way: Firstly designed HW device to capturing data from patient using arduino microcontroller and PPG sensor and draw ppg. Secondly analysis and processing of that data capturing to determine if this patient normal or abnormal [1]. Thirdly work offline of ECG data to analysis of it. Finally detection and classification.Furthermore (1) To enhancement in telemedicine applications, patient monitoring (2) reduce the cost of electromedical devices (3) manipulate patient disease before become critical case (4) Improve quality of health care (5) reduce time for meeting doctor to diagnosis patient and reduce frequently meeting. This information extraction from this work (app) is benefits to get critical decision about care of patient.Important of this work based on decrease the cost of health care rising in world and improve effictient of diagnosies to some disease that is related to heart. Continously monitoring to patient at home and provide some advice to it. The system includes a circuit which communicates to Arduino Uno R3 board. Matlab was used to analyze the data coming from the Arduino Uno R3 by using PPG sensor to capturing data from finger, read signal comes from sensor and transfer to Matlab to complete analysis of data and show it in LCD.We calculate heart rate and defined that zone patient on it depending on:Ÿ Patient ageŸ Max heart rate (MHR).
2. Methdology
- ECG is a register of the heart’s electrical activity & PPG is register of heart activity based on absorbtion of light. The frequency range of ECG is from (0.1-150) Hz. It is widely used routine for cardiac diagnostic tools. Arduino is a simple microcontroller board and an open source development environment that helps users build digital devices and interactive objects. It is used as the basic component to connect the pulse sensor sensor etc. finger placed on it and detects the flow of blood in the vessels and gets the pulse rate in the body and then send data data to MATLAB software for processing.Steps used:Ÿ data acquisitionECG signals were downloaded from the MIT-BIH arrhythmia databaseŸ pre processingECG signal was first normalized to remove the DC and passed to derifed and squaring filterŸ feature extractionŸ QRS detectionDetermine Q,R,S wave for each beats of patient and classification of ECG.
3. Design & Implementation
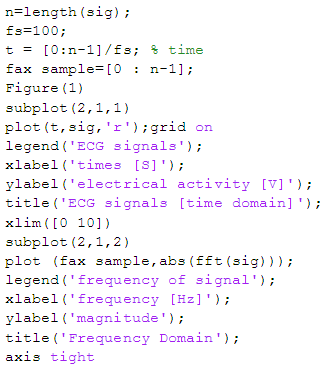
- Ecg signal that is captured from patient X in time domain and converted to frequency domain
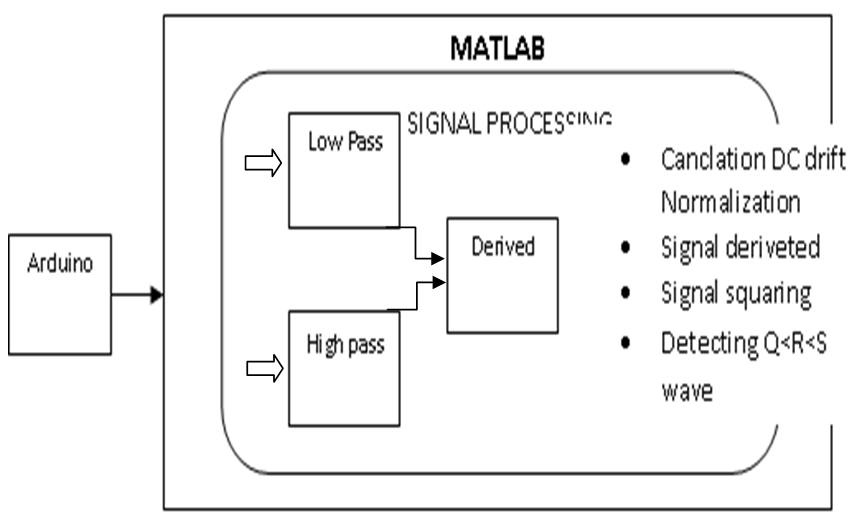 | Figure 1. Architecture of proposed system |
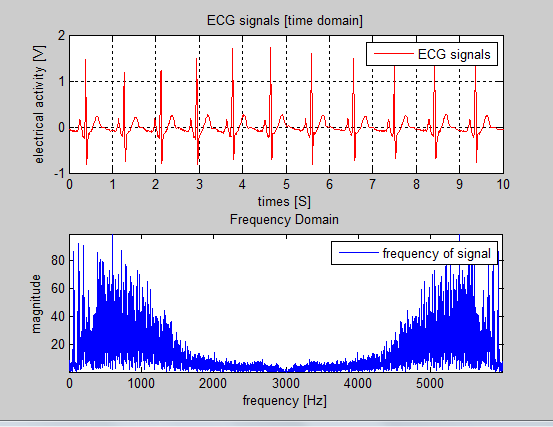 | Figure 2. Time and frequency domain of ECG signal with noising |
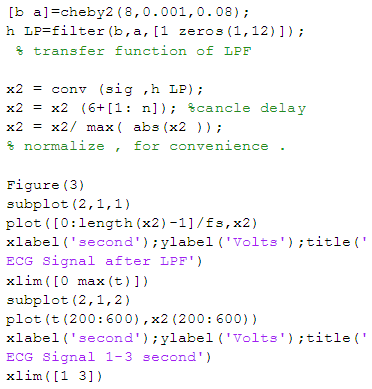
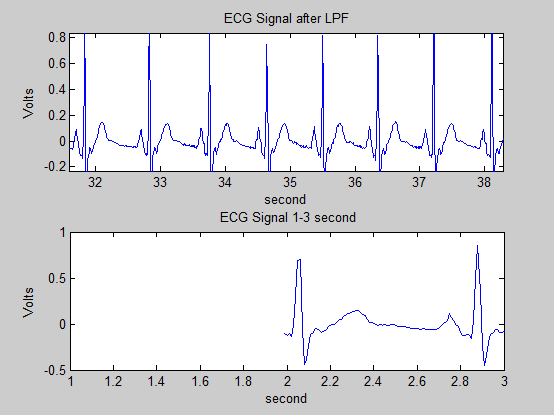
 There are many noise occurs when ECG obtained from heart like:Ÿ Power line interference Ÿ Electrode contact noise, baseline drift and motion artifacts Ÿ EMG from the chest Ÿ Instrumentation noise Ÿ Electrosurgical noiseFor that to avoid that is noise we use two types of filtering (FIR):ü A low-pass filter passes low frequencies fairly wellü A high-pass filter passes high frequencies fairly wellThat is mean used band pass filter to determine range of ECG frequenciy captured from patient and increase the accurate of ECG signal, Figures explained signal format after LPF & HPF.
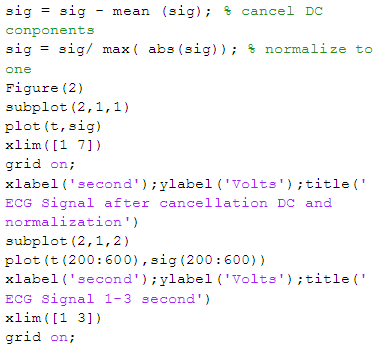
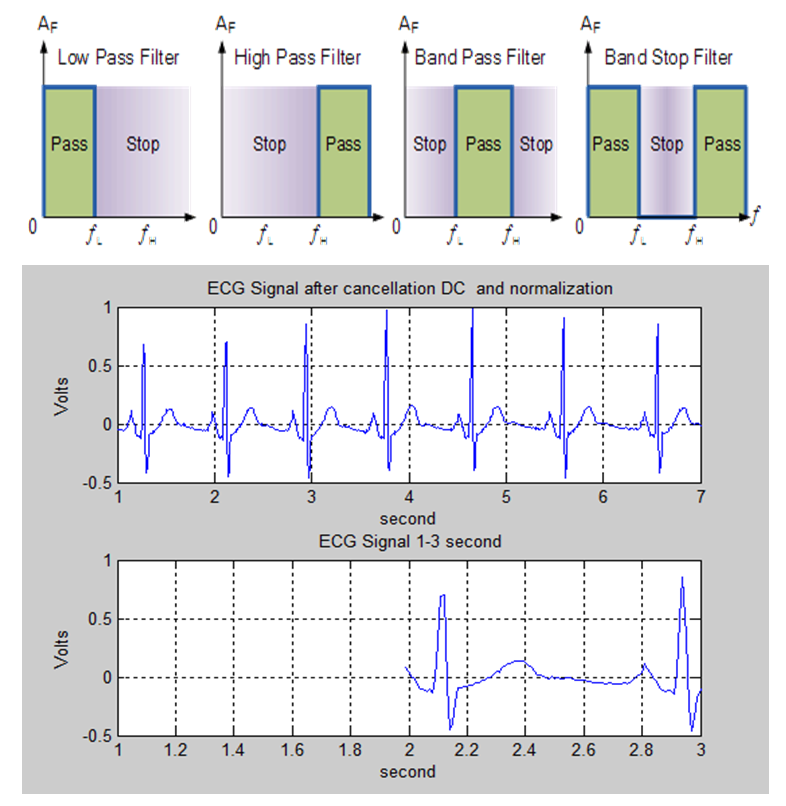 | Figure 3. DC cancelation and normalization of signal |
 | Figure 4. Low pass filter |
 | Figure 5. High pass filter |
|
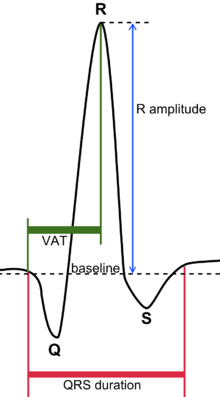 | Figure 6. Q,R,S detection for duration and amplitude for one beat |
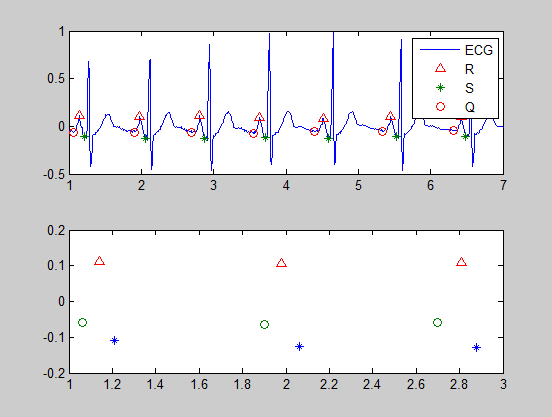 | Figure 7. Q,R,S detection |
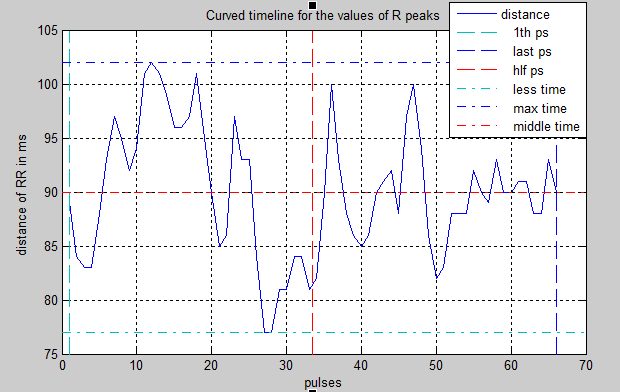 | Figure 8. Timeline of RR wave for patient |
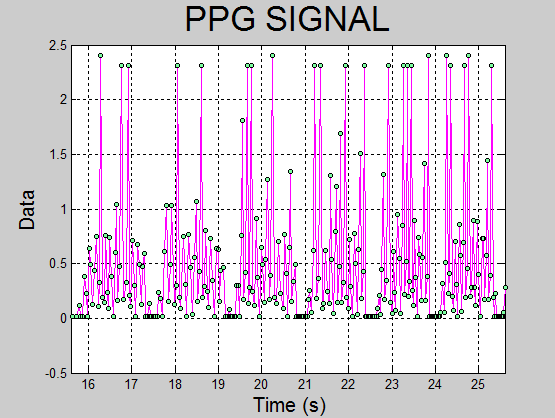 | Figure 9. PPG signal of patient in real time |
4. Conclusions
- The results obtained using MATLAB for ECG analysis and detection of some disease like arrhythmia is very fast and useful, as the ECG can be easily read, saved in a file and the filtering, derivation, squaring, thresholding, applying the moving window integration, peak detection can be done accurately and determining heart rate and some vital signs that is related and depended on HR. That will help us to improve the accuracy.