-
Paper Information
- Paper Submission
-
Journal Information
- About This Journal
- Editorial Board
- Current Issue
- Archive
- Author Guidelines
- Contact Us
American Journal of Signal Processing
p-ISSN: 2165-9354 e-ISSN: 2165-9362
2017; 7(1): 12-24
doi:10.5923/j.ajsp.20170701.02

Advanced Genomic Signal Processing Methods in DNA Mapping Schemes for Gene Prediction Using Digital Filters
 Abstract
 Reference
 Full-Text PDF
 Full-text HTML
Mai S. Mabrouk
Biomedical Engineering Department, Faculty of Engineering, Misr University for Science and Technology (MUST University), Egypt
Correspondence to: Mai S. Mabrouk, Biomedical Engineering Department, Faculty of Engineering, Misr University for Science and Technology (MUST University), Egypt.
| Email: |  |
Copyright © 2017 Scientific & Academic Publishing. All Rights Reserved.
This work is licensed under the Creative Commons Attribution International License (CC BY).
http://creativecommons.org/licenses/by/4.0/

Genomic signal processing (GSP) is an engineering domain involved with the analysis of genomic data using digital signal processing (DSP) approaches after transformation of the sequence of genome to numerical sequence. One challenge of GSP is how to minimize the error of detection of the protein coding region in a specified deoxyribonucleic acid (DNA) sequence with a minimum processing time. Since the type of numerical representation of a DNA sequence extremely affects the prediction accuracy and precision, this study aimed to compare different DNA numerical representations (genetic code context (GCC), atomic number, frequency of nucleotide occurrence in exons (FNO), 2-bit binary and electron ion interaction potential (EIIP)) by measuring the sensitivity, specificity, correlation coefficient (CC) and the processing time for the protein coding region detection. The proposed technique based on digital filters was used to read-out the period 3 components and to eliminate the unwanted noise from DNA sequence. This method applied to 20 human genes demonstrated that the maximum accuracy and minimum processing time are for the 2-bit binary representation method comparing to the other used representation methods. Results suggest that using 2-bit binary representation method significantly enhanced the accuracy of detection and efficiency of the prediction of coding regions using digital filters.
Keywords: Gene prediction, Digital filters, 3- Base periodicity, Exon, Intron, Bioinformatics, Genomic signal processing
Cite this paper: Mai S. Mabrouk, Advanced Genomic Signal Processing Methods in DNA Mapping Schemes for Gene Prediction Using Digital Filters, American Journal of Signal Processing, Vol. 7 No. 1, 2017, pp. 12-24. doi: 10.5923/j.ajsp.20170701.02.
Article Outline
1. Introduction
- Analysis of genomic sequence using DSP approaches such as filters, transformers and models has been increasingly used to recognize the hidden features and information of these sequences which cannot be achieved by the traditional biological methods [1]. As such, DSP is considered as an significant zone of engineering that understands the numerically represented signal manipulation to create a signal with higher quality from the original signal [2].The DSP applications on genomic sequences represent a new scope of GSP [3]. The latter is known as the genomic signals spectral analysis by DSP methods and algorithms to reach different goals such as gene (protein coding regions) detection [4], ECG signals analysis [5], MRI signals description [6], microarray image processing [7] and disease prediction [8]. The GSP applications lead to living system understanding for development of new diagnostic and curative apparatus [9]. In eukaryotic organisms, the DNA consists of intergenic and genic areas. As shown in Fig. 1, the genic areas are composed of two sub-areas called exons (coding regions) and introns (non-coding regions) [10].
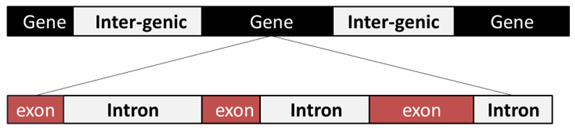 | Figure 1. DNA structure of eukarvotes |
2. Methodology
2.1. Database of DNA Sequence
- The different eukaryotic genes of DNA sequences were downloaded from HMR195 dataset presented by SangaRogic [33]. These model genes were selected according to two conditions. The first condition is that the length of the sequence should not over run 10000 base pairs and the second one is that the exons number should be less than five exons.
2.2. Numerical Representation of DNA
- The sequences of the selected genes DNA were numerically represented by the following five representation methods:
2.2.1. Genetic Code Context (GCC)
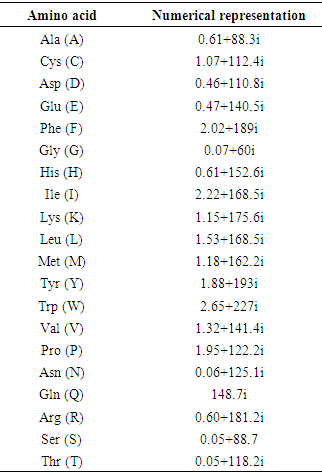
- For a specific DNA sequence Y= ACGATTCAGGT, the triple codons for the three reading frames are as follows; the first reading frame is ACG ATT CAG, the second reading frame is CGA TTC AGG and the third reading frame is GAT TCA GGT. For the first frame, [T, I, Q] is the corresponding encoded amino acids, [R, F, R] for the second frame and [D, S, G] for the third frame. As shown in Table 1, each amino acid is described by a unique complex number.
|
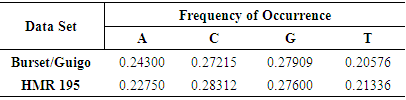
2.2.2. Frequency of Nucleotide Occurrence
- For a specific DNA sequence Y= ACGATTCAGGT from two different datasets, each nucleotide is represented by a real value according to Table 2. Consequently the corresponding DNA numerical sequence downloaded from HMR195 dataset is, [0.22750, 0.28312, 0.27600, 0.22750, 0.21336, 0.21336, 0.28312, 0.22750, 0.27600, 0.27600, 0.21336].
|
2.2.3. Atomic Number
- For a specific DNA sequence Y= ACGATTCAGGT, the values of atomic indicator sequence are known as: A=70, G=78, C=58, T=66.Consequently the corresponding numerical sequence of DNA is, [70, 58, 78, 70, 66, 66, 58, 70, 78, 78, 66]
2.2.4. 2-bit Binary
- For a specific DNA sequence Y= ACGATTCAGGT, the values of the 2-bit binary indicator sequence are known as, A=00, G=10, T=01, C=11.Consequently the corresponding numerical sequence of DNA is [00, 11, 10, 00, 01, 01, 11, 00, 10, 10, 01]
2.2.5. Electron Ion Interaction Potential (EIIP)
- For a specific DNA sequence Y= ACGATTCAGGT, the values of the EIIP indicator sequence are known as, A= 0.1260, G= 0.0806, C= 0.1340, T= 0.1335.Consequently the corresponding numerical sequence of DNA is, [0.1260, 0.1340, 0.0806, 0.1260, 0.1335, 0.1335, 0.1340, 0.1260, 0.0806, 0.0806, 0.1335]
2.3. Protein Coding Region Detection Using Digital Filter
- Infinite impulse response (IIR) digital filter are classified based on their equivalent analog filter approximation into the following types; Butterworth, Bessel-Thomson, Elliptic, Chepyshev (Type I) and inverse Chepyshev (Type II). In this study, the inverse Chebyshev (Type II) approximation has been elected because of its high selectivity which can be carried out with a low order transfer function. In addition, it doesn't display any undulation in its passband amplitude response [2] that is necessary for the application of protein coding region detection. In order to eliminate the IIR filter phase response delay, zero phase filtering is applied.The background noise was removed by Savitzky-Golay (S-G) filter. The latter has the ability to effectively smooth the noisy signal while preserving the signal’s features such as the peak’s width and height. Fig. 2 shows the procedures of the technique realization using MATLAB, in which the numerically converted DNA sequence has been filtered through narrowband bandpass filter designed to read out the period 3 component, the noise has been eliminated using S-G filter, then the evaluation parameters for each numerically represented DNA sequence have been measured.
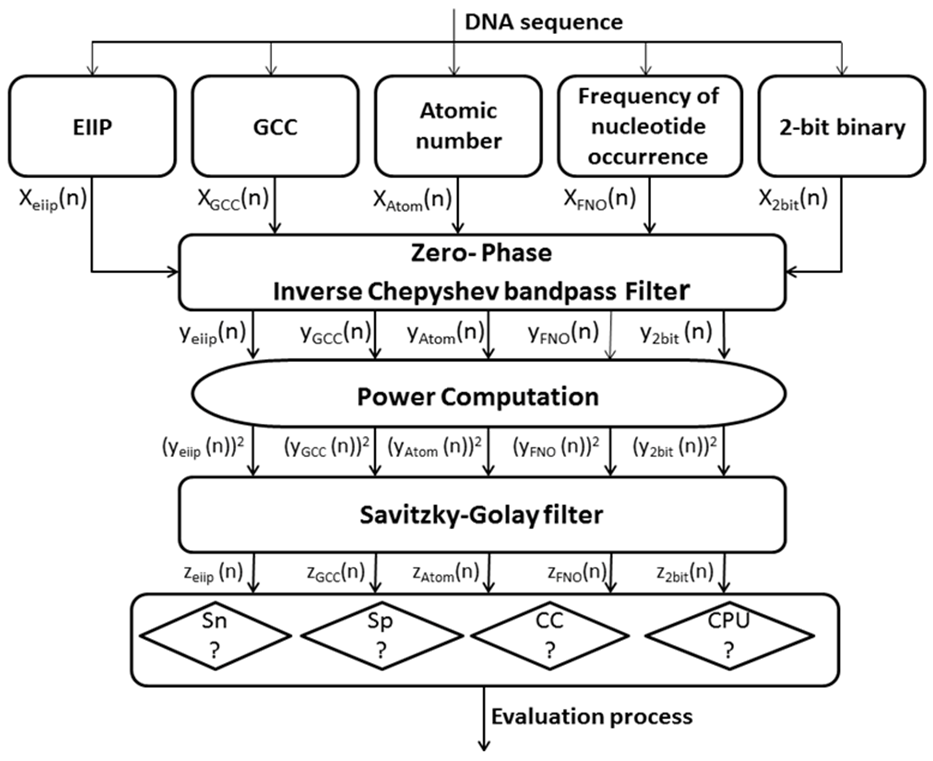 | Figure 2. Overall scheme of the proposed system; Sn: Sensitivity SP: Specificity CC: Correlation coefficient CPU: CPU run tine |
2.3.1. Zero-phase Bandpass Filtering
- The numerical sequence DNA is filtered using Inverse Chepyshev bandpass filter with specifications as follow: Filter order N=3, the lower & upper stopband edge frequencies [0.66, 0.672], the lower & upper passband edge frequencies [0.663, 0.669], the minimum stopband attenuation=30dB, the maximum passband attenuation=1dB. The filter amplitude response is shown in Fig. 3.
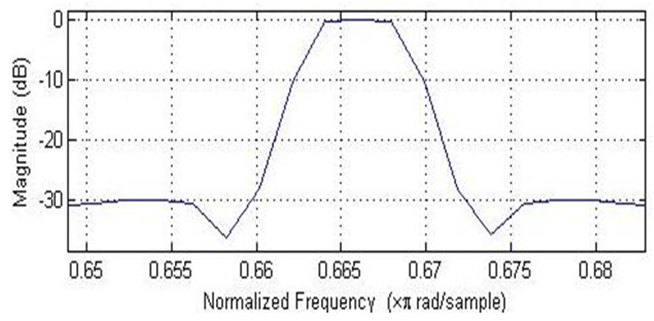 | Figure 3. Amplitude response of the bandpass Type II Chebyshev filter |
2.3.2. Power Computation
- When the signals are represented in the frequency domain, the power levels of those signals need to be measured. The signal power is proportional to the amplitude square. For instance, for a specific time domain sequence y(n), the power of that sequence can be defined as |Y(n)|^2. Thus, the power of the output filtered DNA signal was estimated by squaring the signal amplitude.
2.3.3. The Savitzky-Golay Smoothing Filtering
- The S-G smoothing filter was applied to smooth the squared signal to noise trajectories of DNA sequences. The main indicator of the S-G smoothing filter was determined by the frame size (N) and polynomial order (M).Various values for M and N were examined for better DNA sequence smoothing. The chosen design parameters are; M=3 and N=51.
2.4. Estimation of Evaluation Parameters
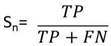
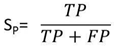
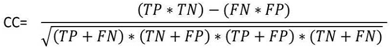
- To measure the effect of various DNA representation methods on different protein coding regions by detecting the overall efficiency using digital filter, the evaluation parameters (sensitivity, specificity, correlation coefficient and average CPU run times) were estimated as follows:Sensitivity (Sn) is the representation method ability to predict the true exons. In opposite, specificity (Sp) is the representation method ability to exclude the false exons. The DNA representation method is believed to be rigorous only if both sensitivity and specificity are high. Correlation coefficient (CC) is the measure of accuracy and ranges from -1 to 1 [34].The Sn, Sp, and CC can be calculated by the following equations:
 | (1) |
 | (2) |
 | (3) |
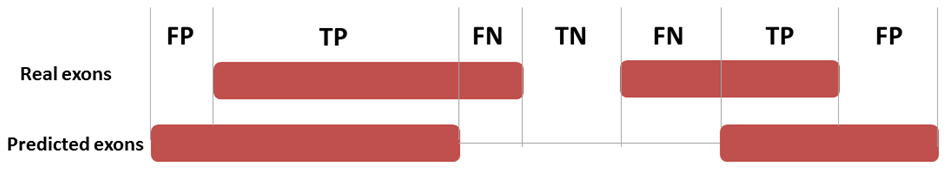 | Figure 4. Definition of four basic measures of exon prediction accuracy at the nucleotide level |
3. Results
3.1. The Used Dataset Demographic
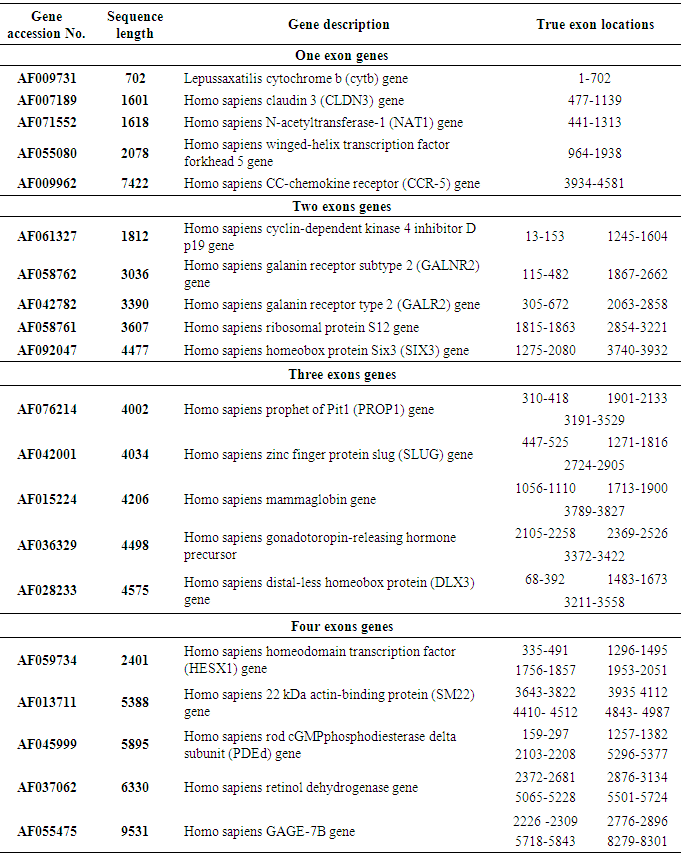
- To reach our purpose, IIR inverse Chepyshev digital filter was used for applying the detection technique on 20 human testing genes with single and multiple exons which were downloaded from HMR195 dataset. In Table 3, the accession numbers, gene description, sequence length and true exon locations of the genes are shown.
|
3.2. Single Exon Genes
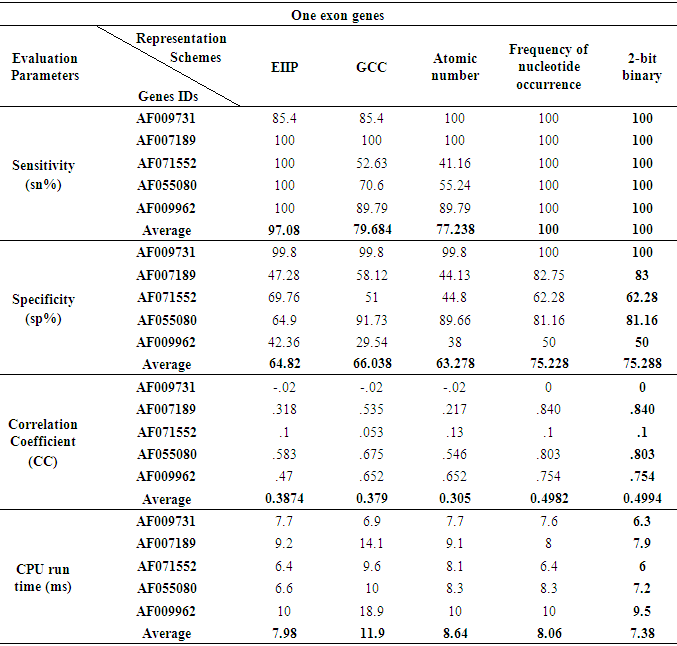
- As shown in Fig. 5, at the level of single exon the frequency of nucleotide occurrence in exons (FNO) and 2-bit binary representation schemes showed a clearly identified high peak at the right location of true exon (964-1938) without any other misleading peaks compared to EIIP, GCC, and atomic umber schemes. Furthermore, when the performance measures were calculated for different single exon genes, the FNO and 2-bit binary representation schemes showed the same highest level of sensitivity, specificity, and correlation coefficient of (100%, 75.228%, and 0.4994) respectively. Of note, the 2-bit binary scheme showed the lowest computational time (7.38ms) among other representation schemes, see Table 4.
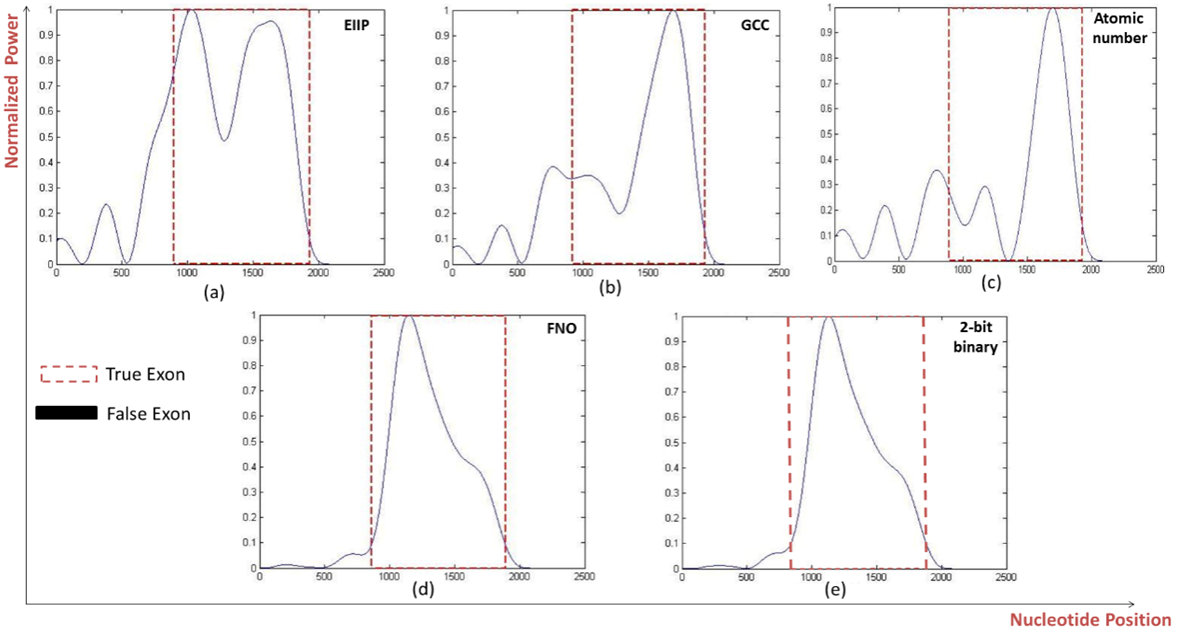 | Figure 5. Power spectrum of Homo sapiens winged-helix phosphodiesterase delta subunit PDEd gene (AF055080) using a) EIIP, b) GCC, c) Atomic number, d) Frequency of nucleotide occurrence (FNO), e) 2-bit binary schemes |
|
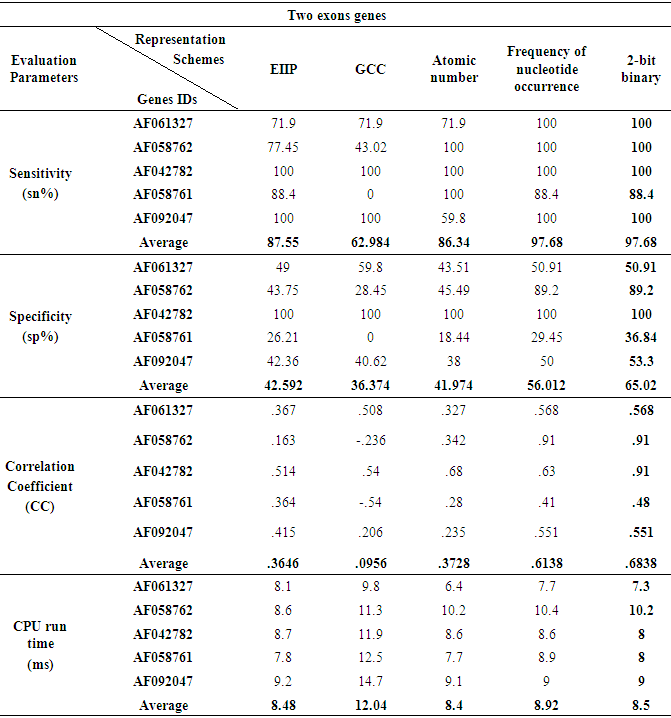
3.3. Genes of Two Exonic Regions
- The prediction efficiency of the various representation methods on various genes with two exonic regions was explained, the same results were showed by the FNO and 2-bit binary methods at the level of sensitivity and nucleotide position identification and as displayed in Fig. 6 where the two methods efficiently detect the two true exons of (GALNR2) gene at their right positions (115-482, 1867-2662). Although the specificity of the FNO and 2-bit binary schemes were reduced by approximately half of that achieved with the prediction of single exonic region, but they also gave the highest specificity values of (56.012%, 65.02) respectively compared to other schemes. Interestingly the 2-bit binary representation method gave the highest correlation coefficient (0.6838) and minimum processing time (8.5ms) among all representation schemes, see Table 5.
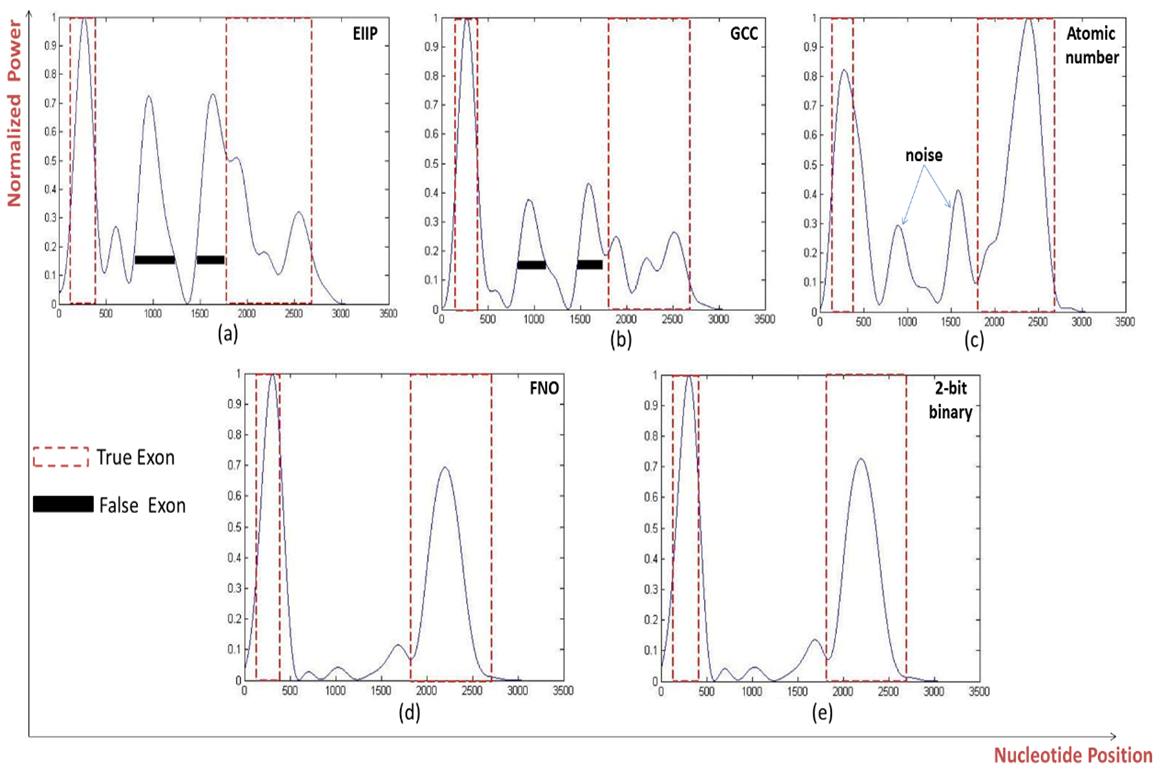 | Figure 6. Power spectrum of Homo sapiens galanin receptor subtype 2 GALNR2 (AF058762) using a) EIIP, b) GCC, c) Atomic number, d) Frequency of nucleotide occurrence (FNO), e) 2-bit binary schemes |
|
3.4. Genes of Three and Four Exonic Regions
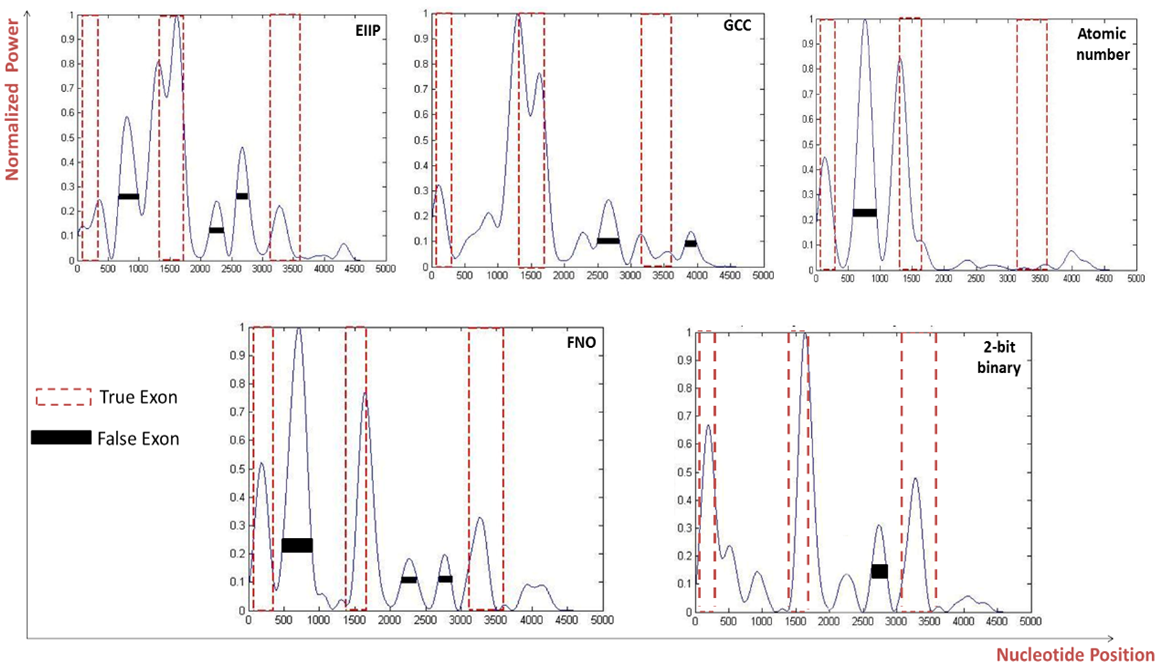
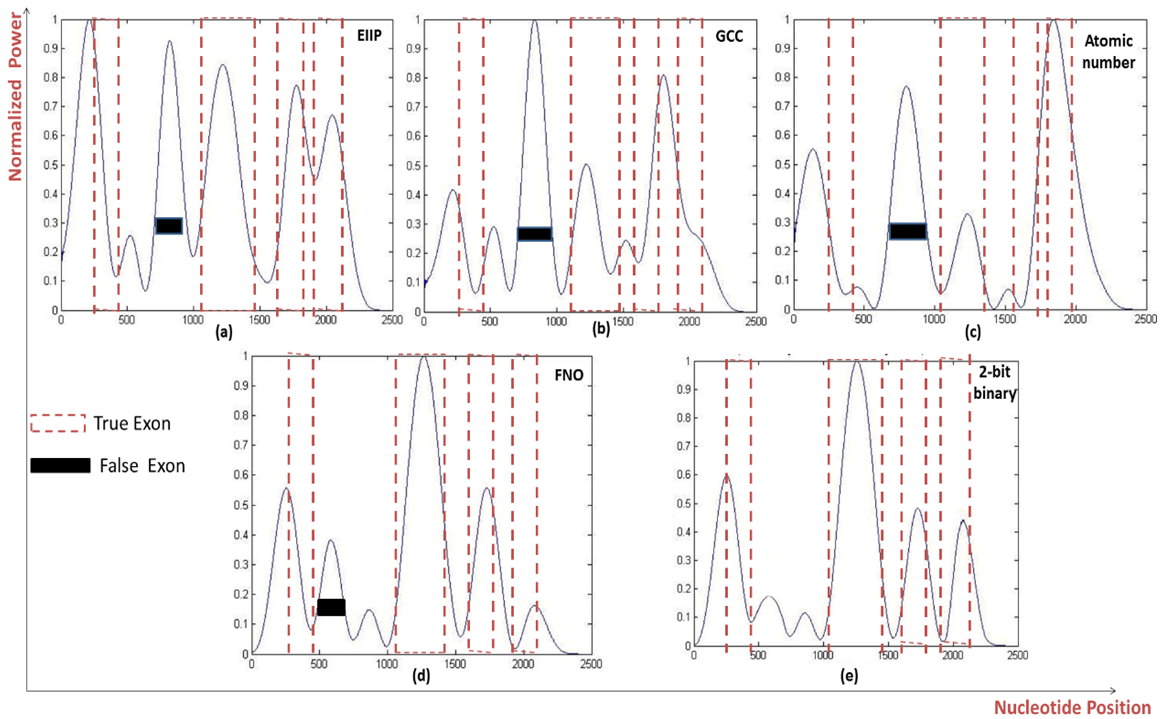
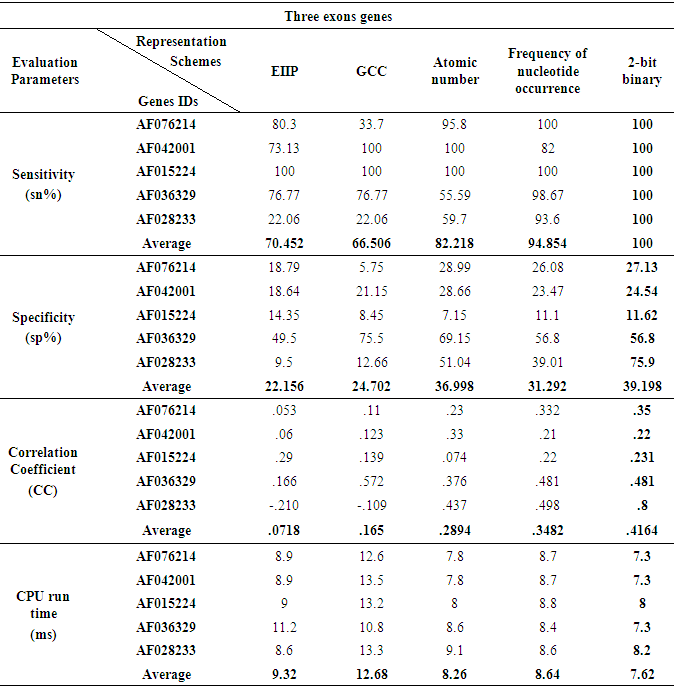
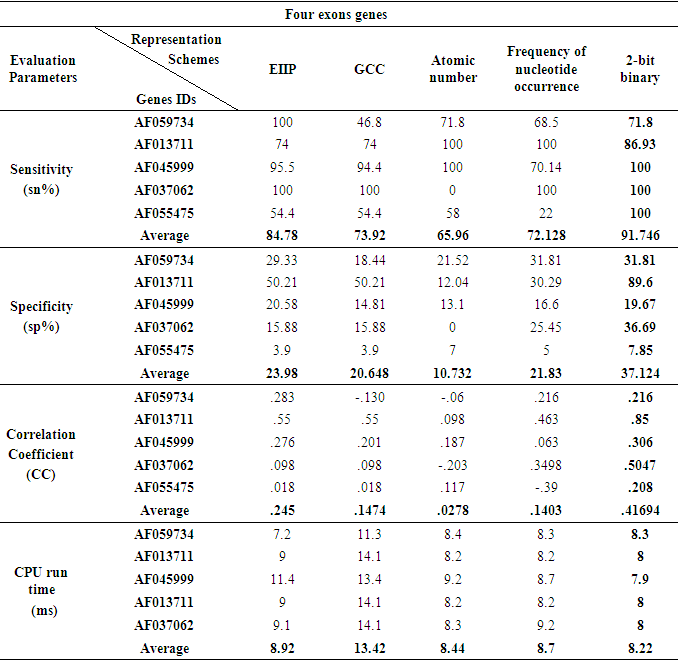
- When the five various representation methods were used in the prediction technique which was applied on various genes of three and four exonic regions, the representation method 2-bit binary obviously reinforced the accuracy as compared to the remaining representation methods as displayed in Fig 7 and Fig. 8. Under this setting, two genes of three and four true exon locations analyzed, the true nucleotide positions were carefully detected with minimum number of false exons which appropriate with the highest levels of sensitivity, correlation coefficient, specificity and minimum CPU run time achieved by this scheme, see Tables 6 and Table 7.
 | Figure 7. Power spectrum of Homo sapiens distal-less homobox protein DLX3 gene (AF028233) using a) EIIP, b) GCC, c) Atomic number, d) Frequency of nucleotide occurrence (FNO), e) 2-bit binary schemes |
 | Figure 8. Power spectrum of Homo sapiens homeodomain transcription factor (HESX1) gene (AF059734) using a) EIIP, b) GCC, c) Atomic number, d) Frequency of nucleotide occurrence (FNO), e) 2-bit binary schemes |
|
|
4. Discussions and Conclusions
- In this study, the effect of various DNA numerical representation methods on the accuracy of protein coding regions (exons) detection was discussed for twenty benchmark human genes using IIR inverse Chepyshev filter. For this purpose, the sensitivity, specificity and correlation coefficient were measured with four advanced DNA numerical representation schemes (GCC, FNO, atomic number and 2-bit binary) as compared to EIIP, which is considered the most vastly used method for protein coding regions detection [21, 35, 36].The results observed that the 2-bit binary representation method significantly enhanced the identification accuracy of true nucleotide position as compared to other representation schemes regardless the number of exonic regions in the tested sequences with high levels of sensitivity, correlation coefficient, specificity and minimum processing time compared with other schemes.These findings are consistent with other studies which used the 2-bit binary in another application and they showed that, the 2-bit binary was the best numerical representation scheme with the human DNA sequences for the promoter prediction application using neural network when compared with the 4-bit binary and integer representation schemes [37, 38].It was also found that at the level of one and two exonic region detection, the 2-bit binary and FNO representation schemes showed the same high levels of sensitivity, correlation coefficient and specificity when compared with the other schemes even though they are different in their numerical representation based methods. For instance, the 2-bit binary depends on assigning some arbitrarily numbers to the nucleotides while the FNO depends on statistically based measures.At the level of three and four exonic regions detection, the FNO was considered as the second best choice as compared with the 2-bit binary representation scheme. These results are consistent with previous study which showed that the frequency of nucleotide occurrence and the paired numeric representation schemes improved the accuracy prediction of protein coding regions using DFT base technique [1].Interestingly, the tested phyisco-chemical representation schemes including (EIIP, GCC and atomic number) showed low levels of prediction accuracy although they reflect the physical and chemical properties of the studied sequences. However, EIIP is still the best choice as it gives the highest prediction accuracy of protein coding regions compared with the GCC and atomic number. These findings are consistent with other studies which showed that using EIIP numerically converted DNA sequences improved the protein coding regions detection accuracy when DFT and artificial neural network techniques have been applied [21, 23]. Of note, we found that the GCC representation scheme showed the longest processing time as compared to all other tested schemes which can be explained as the GCC deals with the 20 amino acid instead of four nucleotides as the other schemes did. The present study is considered the first to report that the 2-bit binary is the optimal representation method among the tested methods for protein coding regions detection using digital filters as it opens new frontiers for further studies to use the 2-bit binary scheme in other applications and to include more representation schemes for comparison.
ACKNOWLEDGMENTS
- This study has been propped by a grant (ID# 5245) funded from the Science and Technology Development Fund (STDF), Ministry of Scientific Research, Egypt to Mohamed L. Salem, the Principal investigator of this project.
Abbreviation List
- GSP: Genomic Signal Processing.DNA: Deoxyribose Nucleic Acid.GCC: Genetic Code Context.FNO: Frequency of Nucleotide Occurrence.EIIP: Electron Ion Interaction Pseudo potential.DSP: Digital Signal Processing.RNA: Ribonucleic acid.A: Adenine.C: Cytosine.G: Guanine.T: Thymine.FM: Fixed Mapping.PCPBM: Physico Chemical Property Based Mapping.SPBM: Statistical Property Based Mapping.DFT: Discrete Fourier Transform.IIR: Infinite Impulse Response.Tp: True PositiveTn: True Negative.Fp: False Positive.Fn: False Negative.Sn: Sensitivity.Sp: Specificity.CC: Correlation Coefficient.