-
Paper Information
- Paper Submission
-
Journal Information
- About This Journal
- Editorial Board
- Current Issue
- Archive
- Author Guidelines
- Contact Us
American Journal of Signal Processing
p-ISSN: 2165-9354 e-ISSN: 2165-9362
2015; 5(3): 51-55
doi:10.5923/j.ajsp.20150503.01
Image Quality Assessment for Defocused Blur Images
 Abstract
 Reference
 Full-Text PDF
 Full-text HTML
Fatin E. M. Al-Obaidi
Department of Physics, College of Science, Al-Mustansiriyah University, Baghdad, Iraq
Correspondence to: Fatin E. M. Al-Obaidi, Department of Physics, College of Science, Al-Mustansiriyah University, Baghdad, Iraq.
| Email: |  |
Copyright © 2015 Scientific & Academic Publishing. All Rights Reserved.
Defocus blur is considered as an important visual cue for image quality assessment which the latter plays an effective role in various image processing applications. Image quality assessment related to image similarity in which quality is based on the difference between the degraded image and the original one. Among the well-known algorithms for measuring image quality assessment, Mean Squared Error (MSE), Signal-to-Noise Ratio (SNR), Structural Similarity Index Metric (SSIM), and structural Dissimilarity metric (DSSIM) have been used. An attempt to improve the quality of such blur has been executed which the latter treated by six different mechanisms. Results of the objective quality assessment showed the role of its parameters in providing mechanisms' quality through their applications. Among the different used mechanisms, the conversion to grayscale mechanism produces a powerful result upon the defocused blur images. Besides, results also show the highest efficiency for the objective quality assessment which has been used here to discriminate the best and worst used mechanisms upon such blur images.
Keywords: Image quality assessment, Signal-to-Noise Ratio, Structural Similarity Index Metric
Cite this paper: Fatin E. M. Al-Obaidi, Image Quality Assessment for Defocused Blur Images, American Journal of Signal Processing, Vol. 5 No. 3, 2015, pp. 51-55. doi: 10.5923/j.ajsp.20150503.01.
Article Outline
1. Introduction
- Defocus blur is mainly a result of a certain problem of the geometric image formation in addition to the finite depth of field of practical camera lens systems. This type of blur causes a serious image degradation [1]. So, the need for image quality measurement takes place which has long considered a very important cue for numerous image processing applications. Basically image quality is measured in two ways; subjective and objective methods. In practice, however, subjective evaluation is usually too inconvenient, time-consuming and expensive [2]. The objective method attempted to quantify the visibility of differences between the distorted image and the reference one using a variety of known properties of the human visual system (HVS) [3]. The objective method is more preferable than subjective method because it predicts image quality automatically [4]. In recent years, an attention towards an objective methods has been attracted and a large number of objective image quality metrics has been developed during the last decade. The objective metrics can be divided into three categories; full-reference, no-reference, and reduced-reference. The full-reference is the most existing approaches in which a complete reference image is assumed to be known. In many practical applications, however, the reference image is not available, and hence a no-reference quality assessment approach is desirable. In order to evaluate the quality of the distorted image in the third part of the method, the reference image is only partially available in a form of a set of extracted features which are made available as side information [2, 3, 5]. The presented work here has been established upon the assumption of a full-reference image quality measure. In general, there are two classes of objective quality assessment approaches [2, 6]: • Simple statistics error metrics • HVS feature based metricsAmong numerous metrics of objective quality assessment approaches, the presented work has been adopted the following measures:
2. Simple Statistics Error Metrics
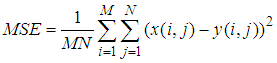
2.1. Mean Squared Error (MSE)
- It is the simplest, and most widely used full-reference image quality measurement. This metric measures the similarity between images through computing the average energy of signal's error. It stands for the mean squared difference between the original and distorted images and can be defined as follows [2, 4, 6]:
 | (1) |
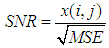
2.2. Signal-to-Noise Ratio (SNR)
- The signal to noise ratio is inversely proportional to the MSE and it is given by the next equation [7]:
 | (2) |
3. HVS Feature Based Metrics
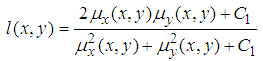
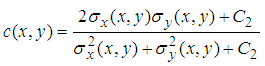
3.1. Structural Similarity Index Metric (SSIM)
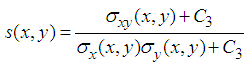
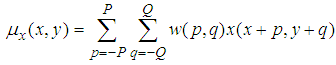
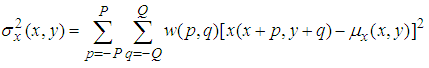
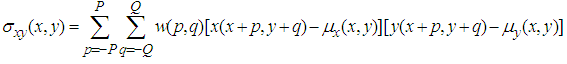
- The structural similarity index is a method for measuring the similarity between two images [5]. This measure compares two images using information about luminous, contrast and structure as follow [5, 8, 9]:
 | (3) |
 | (4) |
 | (5) |
 | (6) |
 | (7) |
 | (8) |
 | (9) |
 | (10) |
 | (11) |
 | (12) |
 and
and  are two scalar constants. Throughout this research a value of 0.01 and 0.03 are set to parameter K1 and K2 respectively. The structure similarity can be written as [5, 8, 9]:
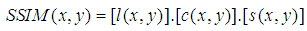 | (13) |
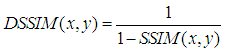
3.2. DSSIM
- This is the structural dissimilarity metric which is derived from SSIM as follows [6]:
 | (14) |
4. The Adopted Mechanisms
4.1. Histogram Equalization
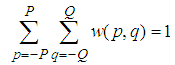
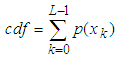
- Histogram equalization is a method in image processing of contrast adjustment using image's histogram [10, 11]. This is achieved by spreading the intensity values over full range [12]. So, if X={x(i,j)}denotes an image which composed of L discrete gray levels. Then the probability density function p(xk) is [11]:
 | (15) |
 | (16) |
 | (17) |
4.2. Opposite Histogram Equalization
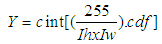
- Based on the above equations, a new mechanism has been suggested. The cdf can be re-written as:
 | (18) |
4.3. Laplacian Filter
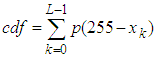
- Laplacian filter is one of the sharpening spatial filters which enhances image's details that have been blurred through errors or imperfect capturing devices. According to the consideration of laplacian filter as a linear spatial filter, one can implement it by using the convolution process and hence laplacian's filter can be implemented here by using the next 3x3 masks [12].
 | Figure 1. Laplacian masks (a) [13], (b) suggested |
4.4. Conversion the RGB Image to Grayscale Image
- In RGB images, each pixel has a particular color described by the amount of red, green and blue in it. In grayscale image on the other side, each pixel is a shade of gray in which each pixel is represented by eight bits, or exactly one byte [14]. The following average method can be used here to convert RGB image to grayscale image [15].
 | (19) |
4.5. Emboss Filter
- An emboss filter gives a 3D shadow effect to the image in such that some objects of the picture are closer or further away than the background, making a 3D or embossed effect [16]. Filter's matrix for embossing effect which has been used here is:
 | Figure 2. The suggested emboss mask |
5. Experimental Results and Discussions
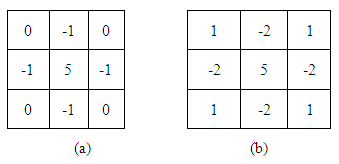
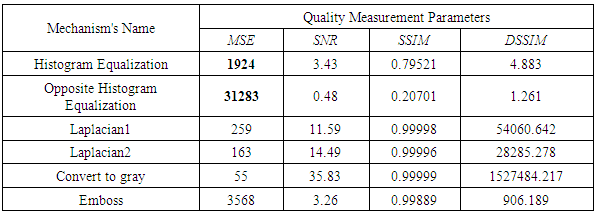
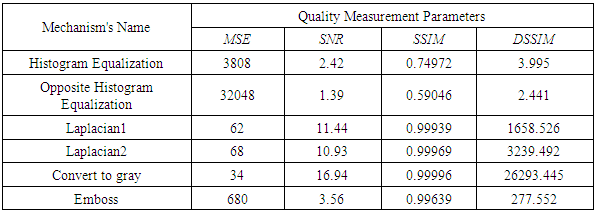
- As said previously, the research here is based on full-reference image quality assessment. With the aim of Canon EOS 650D of 18 megapixel CMOS, two scenes have been selected to capture images as shown in Fig.(3). The blur images have been obtained by defocusing the scene randomly. The effect of the adopted mechanisms was shown in Fig.(4). The measurement for image quality assessment has been tested upon the defocused blur image for each scene. Tables (1), and (2) show the results of such measurements.
 | Figure 3. The original used images (a) Palm image (b) Masterpiece image |
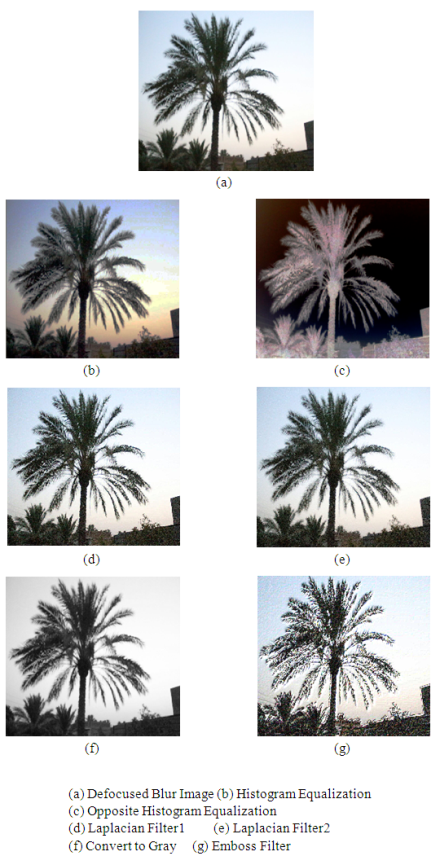 | Figure 4. Results of the adopted mechanisms upon palm image |
|
|
6. Conclusions
- An attempt to measure the quality of defocused blur images has been executed and tested after being affected by some selected mechanisms. Among the different types of mechanisms that have been used here, one can use the conversion to grayscale mechanism as a good procedure to treat such blur images. Results also show the role of the objective quality assessments with all its used parameters in providing mechanisms' quality through their applications. Quality measurement parameters measure the similarity between images with consistent accuracy to introduce as a result the best and worst used mechanism upon such blur images.