Fatemeh Ahmadi Bakhsh, Keivan Maghooli
Biomedical Engineering Department, Science and Research Branch, Islamic Azad University, Tehran, Iran
Correspondence to: Fatemeh Ahmadi Bakhsh, Biomedical Engineering Department, Science and Research Branch, Islamic Azad University, Tehran, Iran.
| Email: |  |
Copyright © 2014 Scientific & Academic Publishing. All Rights Reserved.
Abstract
Missing data is one of the most challenging issues in data mining especially when the data is large, and one of its well-known solving approaches is the Mean imputation. However, as it biases the data and do not consider the similarity between the objects, it is no longer useful. Therefore, our aim in this paper is to combine different versions of the k-means clustering algorithms, which consider the aforementioned similarity, and the mean operator to enhance the results. To do so, the fuzzy, rough and rough-fuzzy k-means are applied to the normalized dataset in different percentage of missing data and their performances are evaluated in terms of the Root Mean Square Error (RMSE) and accuracy. The results show that, the behaviors of the fuzzy k-means and k-means are the same (p-values > 0.05) in terms of the accuracy; while the fuzzy k-means outperforms the others (p-value ≈ 8.5×10⁻⁸) in terms of the RMSE, particularly in higher missing rates.
Keywords:
Imputation, Missing Data, k-means Clustering Algorithm, Rough Set Theory, Fuzzy Theory
Cite this paper: Fatemeh Ahmadi Bakhsh, Keivan Maghooli, Missing Data Analysis: A Survey on the Effect of Different K-Means Clustering Algorithms, American Journal of Signal Processing, Vol. 4 No. 3, 2014, pp. 65-70. doi: 10.5923/j.ajsp.20140403.01.
1. Introduction
Data mining is one of the most prominent processes in artificial intelligence, machine learning and even marketing [1]. By conventional and modern computations, it detects patterns in large enough datasets. The primary objective of data mining is to extract information from a data set and change it to interpretable rules and structures [2]. However, when the size of the dataset is large, there is a high probability of having missing values due to instruments’ malfunctions, unavailability of them or hesitancy of the subjects to answer the specific questions [3].In general, there are three main categories of missing values: Missing Completely at Random (MCAR), Missing at Random (MAR) and Missing Not at Random (MNAR) [4]. In MCAR, the probability of the missing objects (observation) is unrelated to neither its value nor the other variables. For example, not reporting the low income in a dataset is not considered MCAR because the response is typically related to the income rate. In MAR, the missingness does not depend on the value of the object after the other variables are controlled and influenced the non-reported observation. For example, not reporting the low income due to depression or stress is a missing data but this does not have any correlations with the value of the income. Neither MCAR nor MAR, the data is called MNAR. For example, if a person is known as a poor, not reporting the low income would be obvious and the data is not missing at random. In general, it is better to have MCAR and MAR data, but when any knowledge about the person biases the parameter estimator (like in MNAR), the related data are not proper enough to making inferences and rules [5].There are different approaches to deal with missing data. Roth in 1994 used listwise deletion method [6]. A pairwise deletion was used by Wothke in 2000 [7]. In these both methods, discarding and deleting the incomplete observations are of interest. However, imputation is the best way to deal with missing data, which is a process of filling out the missing data with an appropriate value calculated from an algorithm [8]. One algorithm is called Mean imputation. Given a dataset of M×N dimensions (also known as “information system”), which M and N are the number of objects and attributes respectively, this algorithm computes the mean value of each column (attribute) and substitute the corresponding missing value with it. The other algorithm is known as hot-deck imputation, which substitutes the missing observation with a complete one that has relatively close characteristics, through clustering a dataset and distributes the incomplete observations to the cluster, and replaces the missing value with the mean of the same clustered observations [9]. However due to its poor clustering, this paper aims to combine these two aforementioned algorithms with better clustering methods and study their performances in terms of the accuracy and Root Mean Square Error (RMSE). Among the best clustering methods, k-means is used in wide researches [10-12]. It partitions the observations into K clusters in which each observation belongs to the cluster with close characteristic. In the rest of the paper and in section 2, the dataset used in this paper and different versions of k-means methods such as, fuzzy k-means, rough k-means and rough-fuzzy k-means are introduced. Section 3, shows the behaviour of different fuzzifiers for the fuzzy-based methods, the best number of clusters, the best distant threshold in the rough-based methods, and finally investigates the performance of the algorithms in terms of the accuracy and RMSE in different percentage of missing data. Section 4, discusses the results and compares the clustering methods, and section 5 concludes the whole paper.
2. Material and Methods
This section represents the database used in this study and the clustering algorithms apply to it for different parameter extraction and percentage of missing data.
2.1. Dataset
Iris dataset, most commonly used dataset in the literature of pattern recognition, is considered for this study. It contains 150 observations from iris flowers. These observations are classified into the Setosa, Iris Versicolour and Iris Verginica. From each observation, four attributes of sepal's width and length, and petal's width and length have been measured [13]. This dataset in 150×5 dimensions, which the last column corresponds to the classes’ label, is available on MATLAB software package. It should be noted that for parameter adjustment and for classification which describe below, the values in each column (attribute), except the last one, are normalized in the range of 0 to 100.
2.2. Data Clustering and Imputation
In this section, the different clustering algorithms are discussed. It should be noted that, the Root Mean Square Error (RMSE) is computed after running each algorithm and is defined as follows: | (1) |
where, L is the number of all missing values ( ) and
) and  is the corresponding estimated one.
2.2.1. k-means Clustering
The k-means, also known as “hard” or crisp k-means, clustering algorithm is represented for one epoch as follows:1. A predefined percentage of missing value is applied randomly to the dataset and the mean imputation is used to fill in the missing values.2. K complete observations are selected randomly as the centroids (Cs).3. The Euclidean distance measure is computed for the observations to the centroids. 4. Each observation is then assigned to a centroid in which it has the lowest distance.5. Update each centroid by its assigned observations using the mean operator.6. Repeat steps 3, 4 and 5 for 100 iterations. 7. Substitute the missing values of each object by meaning the related values of the same clustered ones.8. RMSE is calculated at the end of the epoch.Then, the mean RMSE and its standard deviation from 100 epochs are calculated.
2.2.2. Fuzzy k-means Clustering
In k-means, one observation belongs to just one cluster; however in real data one observation may have close similarity to more than one cluster. This status can be taken into account with fuzzy logic. Therefore, fuzzy k-means clusters the observations so that each of them can belong to all clusters but with unequal membership values. The steps of this algorithm for one epoch are as follows:1. Steps 1, 2 and 3 of the k-means algorithm.2. Each observation is assigned to all clusters with different membership values [14]: | (2) |
where  is the membersip value of i’th observation with respect to the j’th centroid;
  is the measured Euclidean distance; and m is the fuzzifier which determines the level of cluster fuzziness. Higher value of m, smaller membership values would be. 3. Update each centroid using the following equation [14]:
 | (3) |
where, N is the number of all the objects ( ).4. Compute the Euclidean distance of all observations to the updated centroids.5. Repeat steps 2, 3 and 4 for 100 iterations.6. Do the following statements:A. Choose the observation that had missing value (
 ) and specify its maximum membership value and the corresponding centroid.B. Determine
  complete observations that have the closest membership values with respect to the specified centroid (In this study,
  is set to 10)C. Combining these
  +1 observations, substitute the missing value by the following formula:
  | (4) |
where,  is the estimated amount of the v’th attribute in
  ; and
; and  is the value of the v’th attribute of the j’th centroid.7. Steps 8 of the k-means algorithm.Then, the mean RMSE and its standard deviation of 100 epochs are calculated.
2.2.3. Rough k-means Clustering
The inherent imprecision of the k-means clustering is reduced by fuzzy k-means. Rough set theory can reduce this impreciseness, too. Considering a cluster with its objects as a set, it defines two subsets for each cluster and uses all the subsets to update the centroids [15]. These two subsets are called lower (B*(X)) and upper (B*(X)) approximations of a given set X and are represented in the following rough k-means clustering algorithm:1. Steps 1 of the k-means algorithm.2. Select randomly one object as the first cluster’s centroid.3. Select the 2’nd object as the second cluster’s centroid so that it has the highest Euclidean distance from the first centroid.4. Select the next object as the other centroid so that it has the highest distance from the perpendicular bisector of the two last centroids’ plane. Repeat this step until all K clusters are identified. 5. Assign each object ( ) to the lower and upper subsets of a cluster as follows:
 | (5) |
where,  is the Euclidean distance between the i’th object and the j’th centroid, and θ is the distance threshold. Note that, j is the index of a cluster which has the lowest distance from
  ; therefore
  is always positive.6. Update each centroid using the following equation:
 | (6) |
where, N and M are the sizes of  and
and , respectively and α is a control parameter. 7. Repeat steps 5 and 6 for 100 iterations.8. Specify the lower subset of an object that has missing values, and substitute the missing value from the same clustered objects as follows:
 | (7) |
9. Step 8 of the k-means algorithm.Then, the mean RMSE and its standard deviation of 100 epochs are calculated.
2.2.4. Rough-fuzzy k-means Clustering
In rough k-means clustering, one object belongs to just one lower subset of a cluster and the centroids are updated by their corresponding lower subsets. However, using the fuzzy theory, one object may be classified in different lower subsets due to its similarity. To emphasize this property, the rough-fuzzy set is proposed and its clustering algorithm for one epoch is represented as follows:1. Steps 1, 2, 3 and 4 of rough k-means clustering.2. The lower subset of each cluster and the membership function of its objects ( ) are obtained by the following:
 | (8) |
Like in the rough k-means,  is always positive, since j is the index of a cluster which has the lowest distance from
  .
. | (9) |
3. Each object is considered an element of each cluster’s upper subset with different membership function( ) calculated from equation 2.4. Update each centroid using the following equation:
  | (10) |
5. Repeat steps 2, 3 and 4 for 100 epochs.6. Substitute the missing value of the corresponding observation ( ) from the same clustered objects:A. For the observation that had missing value, specify the maximum of
  and the related centroid (
 ).B. While considering the lower subset of the specified cluster, the missing value is calculated from the following equation:
 | (11) |
It should be noted that,  is just the membership value of all the objects in
  .Then, the mean RMSE and its standard deviation of 100 epochs are calculated.Finally, in order to compare the clustering algorithms, the statistical test is carried out by Student’s t distribution [16] with significance level of 5% and 198 (100+100-2) degree of freedom in the MATLAB software package.
3. Results
This section presents the outputs of the proposed algorithms applied to the aforementioned dataset. Figure 1 shows the mean RMSE and its standard deviation for different α values in 5% missing data for rough-fuzzy and rough k-means. In this figure, the θ for rough-fuzzy k-means is 1 while it is 70 for rough k-means, the value of the fuzzifier (m) is 1.8 and the number of clusters (K) is 6. The value of α near 0.9 for both algorithms has the lowest RMSE.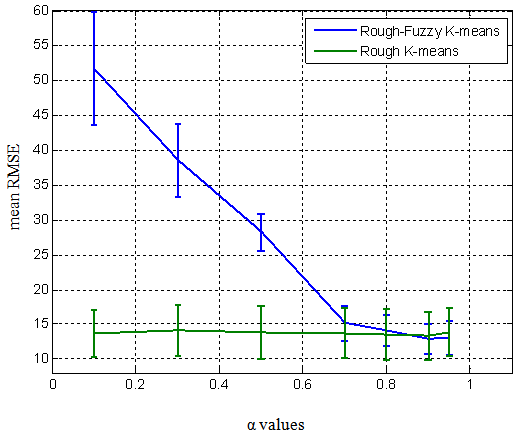 | Figure 1. Mean RMSE and the standard deviation of rough-fuzzy and rough k-means over the α values |
Figure 2 displays the mean RMSE and its standard deviation of the four clustering algorithms for different number of clusters in 5% missing data. In this figure, for rough-fuzzy k-means the value of α is 0.92, θ is 1 and m equals to 1.8. Moreover, m is 1.3 for fuzzy k-means and for rough k-means, α is 0.9 and θ is 70. As it is obvious from the figure, the RMSE values for K equals to 6 or 7 are less than the others.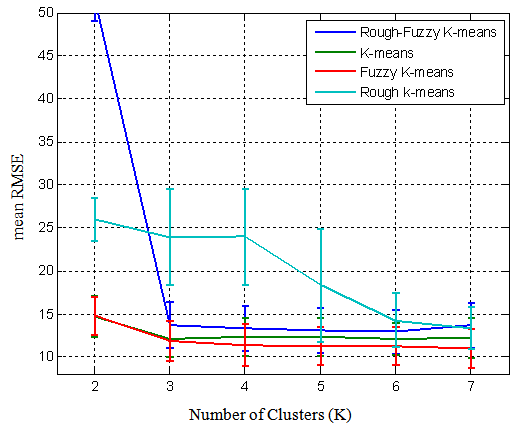 | Figure 2. Mean RMSE and the standard deviation of the four algorithms over the number of clusters |
Figure 3 shows the mean RMSE and its standard deviation of rough-fuzzy and rough k-means algorithms over the distance threshold (θ). It should be noted that the fuzzifier is 1.8, α is 0.9 and number of clusters is 6 for both of them. As it can be seen, for rough k-means, θ near 70 behaves better than the other values while this parameter for rough-fuzzy k-means is 1.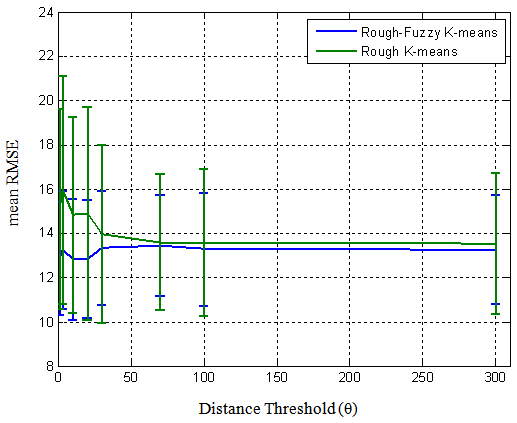 | Figure 3. Mean RMSE and the standard deviation of rough-fuzzy and rough k-means over the θ values |
Figure 4 displays the mean RMSE and its standard deviation of rough-fuzzy and fuzzy k-means algorithms over the value of fuzzifier (m). In this figure, α is 0.92, θ is 1 and k is 6 for both algorithms. The values of 1.8 in rough-fuzzy and 1.3 in fuzzy k-means are better than the other values.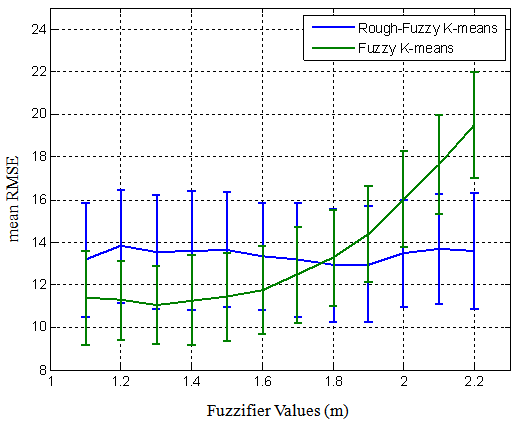 | Figure 4. Mean RMSE and the standard deviation of rough-fuzzy and fuzzy k-means over different fuzzifier values |
Figure 5 displays the mean RMSE and its standard deviation over different percentage of the generated missing values for the four clustering algorithms and also the results are compared with the classical mean imputation. By increasing the percentage of generated missing values in the dataset, the mean RMSE of the proposed algorithms increases while it does not occur for the classical mean imputation. In this figure, the fuzzifier of rough-fuzzy and fuzzy k-means clustering is 1.8 and 1.3, respectively. For all algorithms, number of clusters is set to 6; α is set to 0.9; and θ is 1 and 70 for rough-fuzzy and rough k-means algorithms, respectively.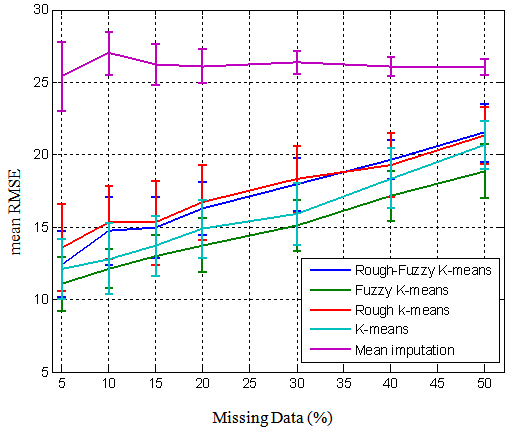 | Figure 5. Mean RMSE and the standard deviation of the four algorithms and the mean imputation over different percentages of missing data |
Figure 6 demonstrates the performance of the clustering algorithms over different percentage of generated missing values in terms of the accuracy calculated from Linear Discriminant Analysis (LDA). It should be noted that, as the primary goal of this study is not focused on different classifiers, therefore just LDA is used to calculate the correct rate for each of the clustering algorithms. It is obvious that, higher percentage of missing values results in lower rates of the accuracy. In this figure, the adjusted parameters are the same as figure 5.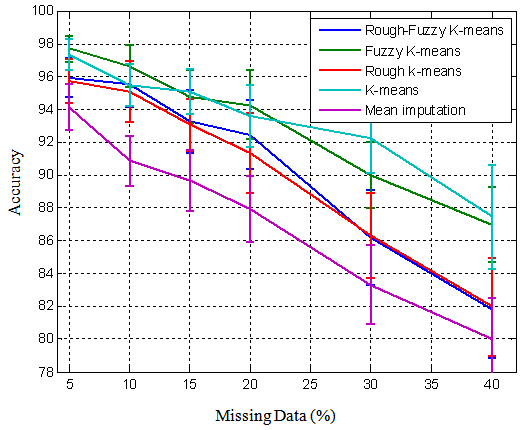 | Figure 6. Mean accuracy and the standard deviation of the four algorithms and the mean imputation over different percentages of missing data |
4. Discussion
In this study, the effects of various k-means clustering algorithms on the performance of the missing value imputation have been investigated. To do so, the Iris data is selected and for a given percentage of the missing values (5% in this study) generated in the dataset, the best number of clusters (k), fuzzifier value (m), distance threshold (θ) and control parameter (α) are analysed and adjusted using the hard, fuzzy, rough and rough-fuzzy k-means clustering. Finally, these algorithms together with the classical mean imputation algorithm are compared in terms of the RMSE and the LDA output.According to figure 1, for rough based algorithms, α near 0.9 has the best performance, and the sensitivity of the rough-fuzzy is higher than the others. For lower values of α, in both algorithms, the centroids are mostly influenced by their upper subsets; and as all the objects, in rough-fuzzy, are in the upper subsets of all clusters, therefore little changes in α result in greater RMSE variability. According to figure 2, the rough based algorithms do not outperform the k-means and fuzzy k-means. It seems that the objects cannot be categorized properly in the subsets with different distance thresholds and the objects in the upper sets have higher impacts on the performance. However, as the Iris dataset has 3 classes, these algorithms, except the rough one, are able to determine the number of clusters, appropriately. The RMSE values for different k, higher than three, vary insignificantly. According to figure 3, the best distance threshold (θ) for rough k-means is much higher than the one of rough-fuzzy k-means owing to small value of θ, the lower subsets in the former are so dense while in the latter each centroid can be computed from different lower subsets. According to figure 4, the performance of the fuzzy k-means deteriorates, while follows a distinct pattern. In fuzzy based methods, when the fuzzifier increases, the corresponding membership functions decrease, and hence, the missing values are partially obtained from inconsiderable membership functions, however, in rough-fuzzy k-means due to the impact of θ in membership functions, this is not happening much.After parameters’ analysis in figures 1 to 4, the adjusted ones are used for comparing the clustering algorithms. According to figure 5, the sensitivity of the mean imputation is less than the one of the four proposed clustering algorithms. In addition, there is not a significant difference between rough-fuzzy and rough k-means even in the 5% missing value (p-value ≈ 0.0212). However, the fuzzy k-means outperforms other algorithms almost in every percentage of missing values. The p-values of 0.0033, 0.0031, 6.9×10⁻⁴ and 8.5×10⁻⁸ in 5%, 20%, 40% and 50% missing value, with respect to even the k-means, show its supremacy. According to figure 6, the accuracies of fuzzy k-means and k-means, while are better than the other algorithms (p-values << 0.05), are similar to each other in every percentage of missing values (p-values > 0.05) except in 10% and 30% ones with p-values of 2.6×10⁻⁵ and 3.82×10⁻⁹, respectively.
5. Conclusions
This paper aims to evaluate the effects of different clustering algorithms on the accuracy and RMSE values. We can conclude that k-means, fuzzy k-means and rough-fuzzy k-means can determine the number of classes if the observations of the dataset have class labels. In addition, fuzzy k-means and k-means clustering algorithms demonstrate more appropriate results, although their sensitivity over various changes in the percentage of missing values in the dataset is high.
References
| [1] | U. M. Fayyad, G. Piatetsky-Shapiro et al (1996) Advances in Knowledge Discovery and Data Mining, AAAI Press/MIT Press, 1-36. |
| [2] | V. Kurbatsky, N. Tomin (2012) Application of the data mining methodology for short-term forecasting of power systems operating conditions. International Conference on Computer Science, Engineering & Technology, 1-12. |
| [3] | D. Li, J. S. Deogun et al (2005) Dealing with Missing Data: Algorithms Based on Fuzzy Set and Rough Set Theories, Transactions on Rough Sets IV, Lecture Notes in Computer Science, Vol. 3700, 37-57. |
| [4] | V. L. Kristman et al (2005) Methods to Account for Attrition in Longitudinal Data: Do They Work? A Simulation Study. European Journal of Epidemiology, Vol. 20, No. 8, 657-662. |
| [5] | David C. Howell (2012). Treatment of Missing Data (Part 1), Available:http://www.uvm.edu/~dhowell/StatPages/More_Stuff/Missing_Data/Missing.html. |
| [6] | P. L. Roth, (1994) Missing Data: A Conceptual Review for Applied Psychologists. Personnel Psychology, Vol. 47, 537–560 |
| [7] | W. Wothke et al, (2000) Longitudinal and multi-group modeling with missing data. Modeling longitudinal and multiple group data: Practical issues, applied approaches and specific examples, 219–240. |
| [8] | A. Rogier T. Donders, et al (2006) Review: A gentle introduction to imputation of missing values. Journal of Clinical Epidemiology, Vol. 59, No. 10, 1087-1091. |
| [9] | R. J. Little, (2005) Missing Data. In Encyclopedia of Statistics in Behavioral Science, Vol. 3, 1234-1238. |
| [10] | T. Kanungo, D.M. Mount et al (2002) An efficient k-means clustering algorithm: analysis and implementation. Pattern Analysis and Machine Intelligence, IEEE Transactions on , Vol. 24, No.7, 881,892. |
| [11] | Shi Yu et al (2012), Optimized Data Fusion for Kernel k-Means Clustering. Pattern Analysis and Machine Intelligence, IEEE Transactions on, Vol. 34, No.5, 1031-1039. |
| [12] | R. C. de Amorim, B. Mirkin et al (2012) feature weighting and anomalous cluster initializing in K-Means clustering. Pattern Recognition, Vol. 45, No. 3, 1061-1075. |
| [13] | A. Roy, D. Dutta et al (2013) Training Artificial Neural Network using Particle Swarm Optimization Algorithm. International Journal of Advanced Research in Computer Science and Software Engineering, Vol. 3, No. 3, 430-434. |
| [14] | C. Chang, J. Lai et al (2011) A Fuzzy K-means Clustering Algorithm Using Cluster Center Displacement. Journal of Information Science and Engineering, Vol. 27, 995-1009. |
| [15] | Z. Pawlak (1998) Rough sets theory and its applications to data analysis, Cybernetics and Systems, Vol. 29, No. 3, 661-668. |
| [16] | M. Dondrup, A. T. Hüser, et al (2009) An evaluation framework for statistical tests on microarray data. Elsevier, Journal of Biotechnology, Vol. 140, 18-26. |
 Abstract
 Reference
 Full-Text PDF
 Full-text HTML