Ali Danladi1, Silas N. Edwin2
1Department of Physics, Adamawa State University, Mubi. Adamawa State. Nigeria
2Department of Computer Engineering, Federal Polytechnic, Mubi. Adamawa State, Nigeria
Correspondence to: Ali Danladi, Department of Physics, Adamawa State University, Mubi. Adamawa State. Nigeria.
| Email: |  |
Copyright © 2014 Scientific & Academic Publishing. All Rights Reserved.
Abstract
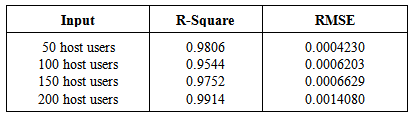
Achieving excellent network quality of service (QoS) is the fundamental aim of any internet service provider (ISP), in view of this, a model of a corporate network has been developed, simulated and implemented using optimized network engineering tool (OPNET) technology in the simulation area of 10,000m2 office topology to monitor the effect of data delay in a network based on the host users; 50, 100, 150 and 200 to predict the network performance. The result shows that the network with the less number of host users has the better network performance, which implies that; the more the Number of the host users the higher the network error. The RMSE predicted in each LAN for 50, 100, 150 and 200 host users are 0.000423, 0.0006203, 0.0006629 and 0.001408 respectively. The modeling result predicts that input characteristics have influence over network performance as well as capacity utilization.
Keywords:
Local area network, Delay, Model, Traffic monitoring and host user's
Cite this paper: Ali Danladi, Silas N. Edwin, Modeling of Corporate Network Performance and Smoothing Spline Interpolation, American Journal of Signal Processing, Vol. 4 No. 2, 2014, pp. 60-64. doi: 10.5923/j.ajsp.20140402.03.
1. Introduction
Telecommunication industries in early age used separate technologies to meet their different communication means, for example, traditional telephone system, AM radio, or TV technology and so on but today, with the recent growth in telecommunication Industries all these separate means of communications are harmonized and achieved through single technology. Up to date, more demand of telecommunications service is at the top gear, due to these high demands imposed on the telecommunication service, traffic structure is becoming more and more complex day by day and the network performance is degrading [1] [3] [4] [6]. Therefore, there is a need to constantly monitor the network performance to gain accurate of bill network activities and to predict how the status of future network will be. Traffic or network monitoring is a very difficult task because the causes of the poor network performance are numerous, which could come from device malfunctioning, threat's attack, geographic situation and many others, it must not necessarily come from input characteristics along although in this work, our interest is raised because of the increasing volume of traffic more especially the introduction of multimedia traffic on the internet network, this prompted us to study the effect of input characteristics on a network performance while ignoring other sources of the cause of poor network performance.To undertake the design of a workable and scalable corporate network; high quality of service one must have to take into account; the nature of input characteristics in relation to bandwidth, Network equipment’s and others, because, when investigating various properties or characteristics of information transfer across the corporate network; brings about issue of developing model of input characteristics that is near the actual characteristics of the data stream.Many research works had considered that the sources of the cause of poor performance could be attributed to network failure due to equipment’s, threats attack and some outdoor activities. In [2], the study conducted; was based on loss and delay measurement data collected from internet service providers (IPS) in US. The study arrived at the conclusion that some paths experience severe impairments due to network protocol failure, reconfiguration and router operation may be responsible for network delay instead of normal congestion and quality of service. In [5], research was conducted to study network efficiency in terms of measuring network congestion; the result of the work revealed that most congestion problems were experienced due to the network component, which include structural failure, links, nodes, other, such as a natural disaster, and attack from terrorist. In [7] [8] says that quality of service depends on the healthy condition of your network; that is a network that is free from service theft, spamming, phishing attacks, viruses and malware. In [9], research was conducted on network security threats; the result of the work revealed that an intruder could consume the significant part of the bandwidth that could consequently deny distributed service.In this work, we propose to develop a corporate network using OPNET simulator to monitor data delay, which is known as one of the major conditions of degrading network performance with different input characteristics say 50, 100, 150 and 200 host users. Next we will use smoothing spline interpolation to model and predict the performance of the corporate network in terms of the root mean square error (RMSE) of data delay in each local area network (LAN). This is hardly mentioned in the literature for this purpose. Non-uniform fitting is use to predict the RMSE of the data delay to help us show how much is the impact of input characteristics on network performance in terms of data delay in the simulated network.
2. Implementation of the Simulation Model
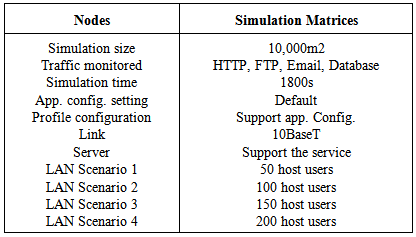
A simulation area of 10,000m2 office topology network is first created using a startup wizard. The required numbers of the nodes are dragged into the empty space base on suitable number of nodes needed for the implementation of the proposed model as shown in Fig 1, then each of the nodes field is set to carry out their functions. These include application configuration, profile configuration, server, switch, person computer in LAN. The Table 1, below gives the model and the simulation parameters.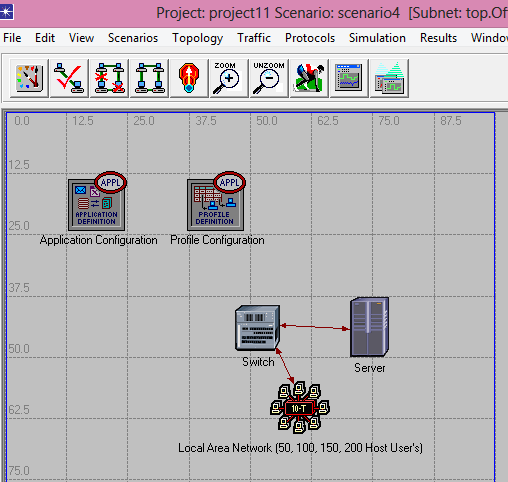 | Figure 1. Developed simulated model of the corporate network |
Table 1. Simulation Matrics Parameters
 |
| |
|
2.1. Traffic Monitoring and Collection of Statistics
Data traffic such as high web browsing (HTTP), high file transfer protocol (FTP), high database and high email from different sources say 50, 100, 150, 200 host users were introduced into the model and monitored. The goal is to test the network performance in terms of input characteristics. In OPNET there are two major statistics available, these are; global statistics and node statistics. Global statistics tell us about the statistics of the entire network while node statistics tell us about the statistics of an individual node, in this work we monitored only delay traffic in the global statistics to test which input has less data delay with better network performance. Simulation is run and results are taken, the monitored delay data traffic is presented in Fig. 2 below as signals.
2.2. Choice of Model
Based on the traffic monitored and captured; we considered the properties of the data delay captured; in terms of stationary and non-stationary process to enable us choose the appropriate model. We identified that the traffic captured (data delay) is stochastic stationary based on the following observations; autocorrelation decay quickly at 2 lag, the correlogram has spikes at very small lag, the mean and variance show no systematic change. This features allowed us to pick piecewise polynomials model to model our observed data.
2.3. Model
Usually, when choosing a model it is expected that the model should be able to predict near real values of the data observed. We used smoothing spline piecewise type, this is because they have shown reasonable results in predictions of random data. Basically, in this work, as earlier mentioned our attention will be focused on root mean square error (RMSE) and R - square to validate our prediction results.Let’s consider the length of data delay observed as 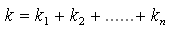 | (1) |
The RMSE of the observed data may be given by Eq.(2);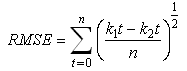 | (2) |
Where n is the number of observations. RMSE gives us the difference between values predicted by the model and real data observed and it provides good measure of accuracy. While R - square sometimes refers to coefficient of determination or coefficient of multi determination for multiple regression; this parameter shows how close the data fits the model, low value of R-square signifies poor prediction and high value give better prediction which is usually from 0 to 1, the performance of the prediction increases when R - square gets closer to 1.
3. Results and Discussion
3.1. Discussions
Network performance is the measure of overall quality of service (QoS) of a particular network more especially; the performance received by the end users of the network. QoS is an important parameter for transporting data traffic or packets from source to destination without losing any meaningful information. The measure of QoS is usually considered in terms of throughput, bandwidth, and transmission delay and so on. Among all mention above data delay could be responsible for the cause of error rate, low throughput, over flow probability and data drop in the network. That is why we choose the data delay parameter to be monitored, and to develop model that will fit the input characteristics of the simulated network. Piecewise polynomials model yield reasonable predictive accurate results than high order polynomials [10]; as we can see in the work sufficient information about the data delay from the simulated network model is adequately predicted. This prediction model is a vital tool in time – series that are stationary stochastic in nature as shown in Fig. 2.Fig. 2, present the data delay measured in all the LANs, it exhibits stationary stochastic behavior; blue color graph represent LAN with 50 host users, green color graph 100 host users, red color graph 150 host users while black color graph 200 host users. 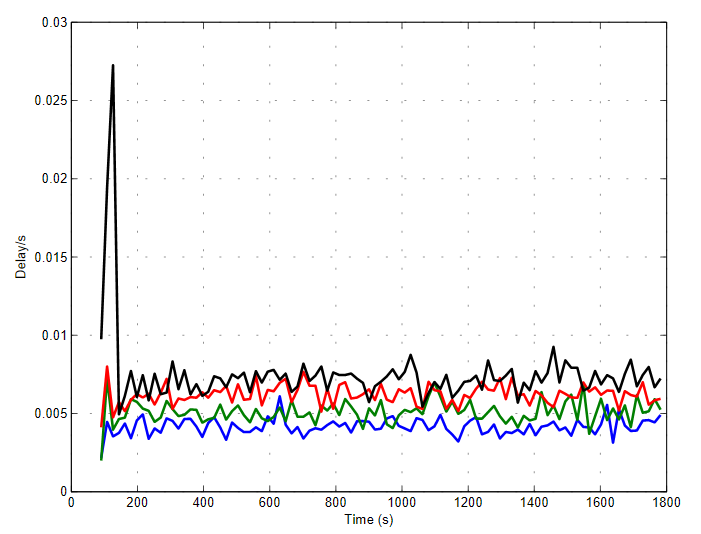 | Figure 2. Delay measured in all the scenarios |
Fig. 3 to 6, show the observed and the modeled data; the red color graph represents the observed data while the blue color graph represents the modeled data. As we can see clearly interpolation using piecewise polynomials model is flexible, because it followed the pattern of the observed data, it provide better smoothing platform with effective approximation and reduced computational complexities. The method demonstrate better compatibility with observed data; in all the predictions with high R-square, high adjusted R - square and accurate RMSE. This prediction is almost perfect with the average of 98%. Piecewise model is chosen ahead of high - order polynomials because of its flexibility. We noticed that the RMSE increases as the number of host users increases, see Table 2. Therefore, it is safe to say input characteristics determine the network performance as well as the capacity utilization.Table 2. Summary of The Data Delayed Predicted by Test and Normalized Models
 |
| |
|
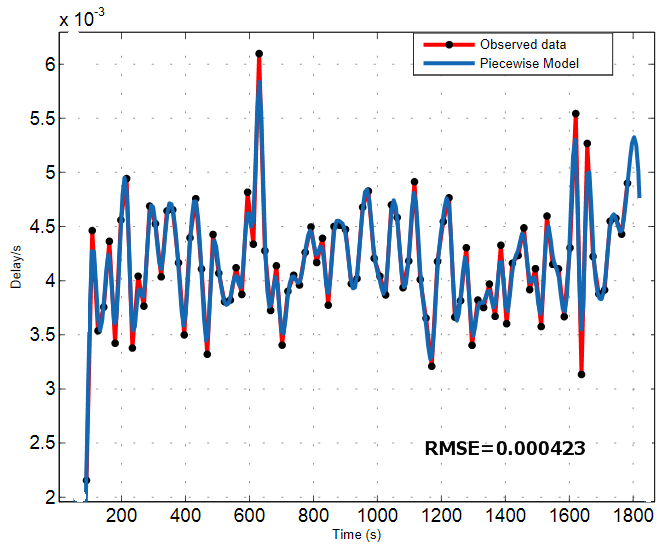 | Figure 3. Test and normalized models for 50 host users |
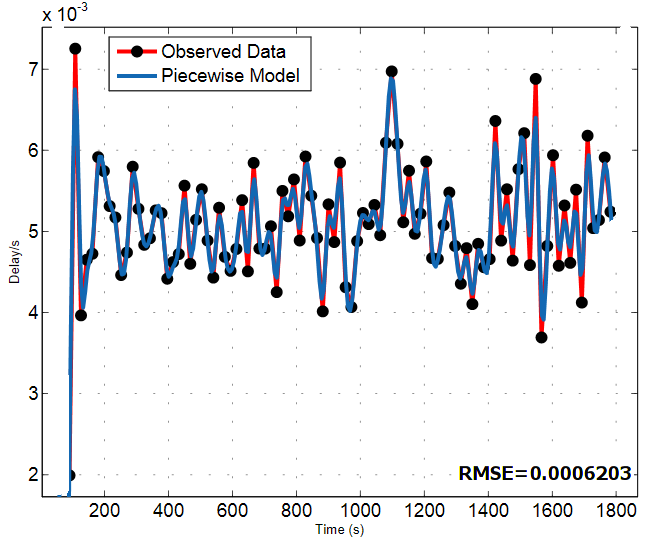 | Figure 4. Test and normalized models for 100 host users |
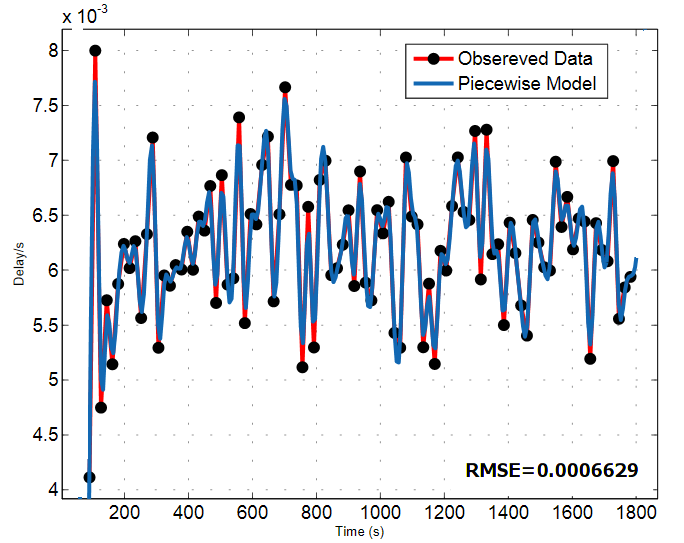 | Figure 5. Test and normalized model for 150 host users |
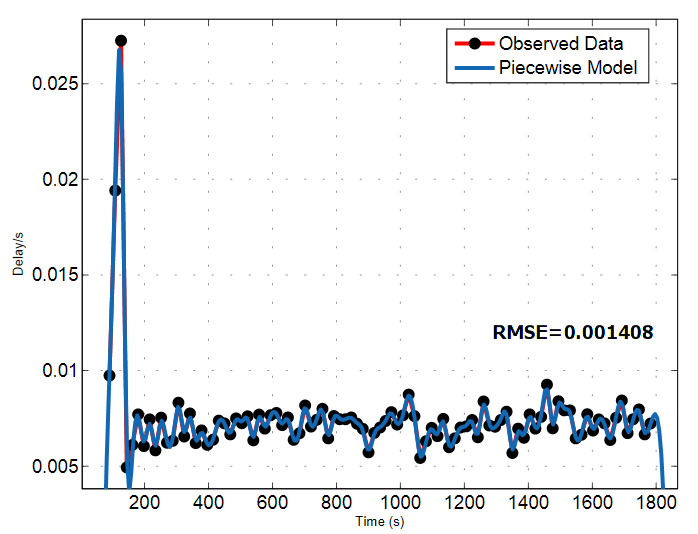 | Figure 6. Observed and model data for 200 host users |
4. Conclusions
A corporate network had been developed, simulated and implemented using OPNET technology; data delay is monitored with varying input characteristics say 50, 100, 150 and 200 host users. Piecewise polynomials model is developed to predict the network performance based on RMSE of the observed data delay. The model predicts that the input characteristics have a significant influence on network performance. Therefore, when designing a network of any type, input characteristics is one of the factors to put into consideration for the network to have good performance. This work takes into consideration only input characteristics, but, does not consider other sources that could affect network performance. Hope this modeling work has provided some vital information about the effect of input characteristics on network. We recommend that other researches should be carried out to find out the other possible causes of poor network performance.
References
| [1] | A. Agarwal, “Quality of service in a new network architecture”, IEEE Canadian review fall/autome, 2006. |
| [2] | M. Athiama, T. Fouad , and K. Mansour Loss and delay measurement of internet backbone, Computer communication special issue on monitoring and measurement, 2005. |
| [3] | C. Cconetti, L. Luciano, and E. Mongozzi, “Quality of service support in IEEE 802.16 network”, in IEEE network, 2006, pp. 50-55. |
| [4] | E. Brent Kelly, “Quality of service in internet protocol (IP) network” Wainhouse research, 2002, pp 1-5. |
| [5] | A. Nagurney, and Q Qiang, “A effeciency measure for congested network” Epl Journal, 2007. |
| [6] | V. Bilo, A. Dipasquale, F. Fioranvant, M. Flamini, Lfirlizi, F. Lopresh, G. Melideo, E. Nardelli, A. Navarra and G. Proiehi “Quality of service in wireless networks” Proceedings of the international parallel distributed processing symposium, 2003. |
| [7] | Http://www.microsoft.com/technet/archive/security/bestprac/bpent/sec2/secentbb.mspx. |
| [8] | Http://voip.about.com/od/voipbasics/a/voipproblems.htm. |
| [9] | http//www.microsoft.com. |
| [10] | A. Danladi and V. V. Gnatushenko “Predictive Modeling of Data Delay in a Corporate Network Based on Input Characteristics by Applying Simulation Model” International conference in advances in computing and information technology. In press. |
 Abstract
 Reference
 Full-Text PDF
 Full-text HTML