Mujahid F. Al-Azzo, Khalaf I. Al-Sabaawi
Department of Communications Engineering, Faculty of Electronics Engineering, Mosul University, Iraq
Correspondence to: Khalaf I. Al-Sabaawi, Department of Communications Engineering, Faculty of Electronics Engineering, Mosul University, Iraq.
| Email: |  |
Copyright © 2014 Scientific & Academic Publishing. All Rights Reserved.
Abstract
In this paper, the Direction of Arrival (DOA) estimation is implemented using a set of Ultrasonic transducers. Different experiments for different number of sources (one and two sources) have been achieved. The techniques used in this paper are high-resolution techniques such as Pisarenko Harmonic Decomposition (PHD), MUltiple SIgnal Classification (MUSIC), and EigenVector (EV) methods. These techniques are compared with the classical method, Fast Fourier Transform (FFT). The practical results show the better performance of high resolution techniques when compared with the classical method.
Keywords:
Array signal processing, DOA, FFT, PHD, MUSIC, EV
Cite this paper: Mujahid F. Al-Azzo, Khalaf I. Al-Sabaawi, High Resolution Techniques for Direction of Arrival Estimation of Ultrasonic Waves, American Journal of Signal Processing, Vol. 4 No. 2, 2014, pp. 49-59. doi: 10.5923/j.ajsp.20140402.02.
1. Introduction
Direction-of-arrival (DOA) estimation (or direction finding) essentially concerns the estimation of direction-of-arrival of signals, either in the form of electromagnetic (i.e., radio) or acoustic waves, impinging on a sensor or antenna array. The requirement for DOA estimation arises from the needs of locating and tracking signal sources in both civilian and military applications, such as seismology, search and rescue, sonar, law enforcement [1].DOA estimation is one of the important subjects of array signal processing [2], and extensively applied in the field of radar and sonar [3]. The objective of DOA estimation is to find a spatial spectrum of the sensor array and calculate the DOAs from this spectrum [4]. The algorithms of DOA estimation can be classified into two algorithms classical such as Fast Fourier Transform (FFT) and subspace method such as Pisarenko Harmonic Decomposition (PHD) [5], MUltiple SIgnal Classification (MUSIC) [6], and EigenVector (EV).The main advantage of subspace methods over the conventional method is that the aperture of the entire array does not limit the resolution, therefore these also known as super resolution techniques [7]. The aims of this research are to make an investigation about modern DOA estimation methods such as Pisarenko Harmonic Decomposition (PHD), MUltiple SIgnal Classification (MUSIC), and Eigenvector (EV) methods. These methods based on eignanalysis of an autocorrelation matrix of the received signal. Then, these methods are compared with the conventional method Fast Fourier Transform (FFT).
2. Data Model
We assume that a system consist of uniform linear array (ULA) with N-elements and M-sources and the distance between elements is d. The first element of the array consider as a reference element. The scenario for this system is the sources in the far field and the incoming data is plane wave. This system is shown in figure (1).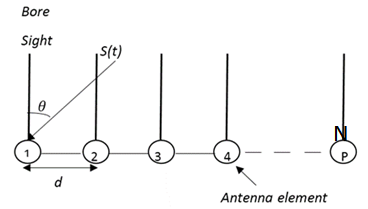 | Figure 1. Uniform Linear Array (ULA) and the Direction of Arrival (DOA) |
The data received at the array antenna is  | (1) |
Where Array steering vector.
 Signal source.
 is an additive noise term whose mean is 0 and variance is
  .The autocorrelation matrix of the received signal can be written as
 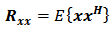 | (2) |
Where E: expectation operator.(.)H: is a complex conjugate transpose. The high-resolution algorithms that used in this paper based on this autocorrelation matrix [8].
3. DOA Algorithms
In this paper, the method used for DOA estimation can be classified into two categories: classical method and super resolution methods.
3.1. Calssical Method (Fourier Transform)
Fourier Transform (FT) is one of the spectrum estimation methods that can resolve between two adjacent sources when the data is long [9]. This property of DFT can be used to estimate the direction of arrival of incoming signal to array receiving antennas. In direction of arrival estimation technique there is Fourier relationship between the beam pattern and the excitation at the array of the receiving system. This make the (DOA) estimation problem to be treated as equivalent to spectral estimation. The signals received at the sensors must be decomposed into spectral components. These components then are used to find the DOA estimation and signal recovery. A popular method for decomposition is a DFT [10].Forward DFT are: 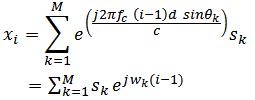 | (3) |
Where 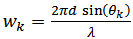 and
and  : is the number of the sensor
  : is the number of the source
  distance between elements
 wavelength
3.2. Super Resolution Methods
In this section, we will discuss three of super resolution methods. These methods are PHD, MUSIC, and EV methods.
3.2.1. Pisarenko Harmonic Decomposition (PHD)
Pisarenko Harmonic Decomposition (PHD) is one of the subspace method was proposed by V. Pisarenko in 1973 that based on Eigen decomposition of the autocorrelation matrix. The purpose of this method is to minimize the mean-squared error of the array output under the constraint that the norm of the weight vector be equal to unity. The eigenvector that minimizes the mean-squared error corresponds to the smallest eigenvalue [5]. This method demonstrated that the frequencies could be derived from the eigenvector corresponding to the minimum eigenvalue of the autocorrelation matrix Rx obtained from the process x(n) which is a random process consisting of k complex exponentials in white noise. Rx is an M1 × M1 square matrix, where M1 = M+1[7].The corresponding PHD pseudo spectrum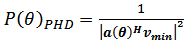 | (4) |
 Array steering vector
  Minimum eigenvector (eigenvector of the noise corresponding to min. eigenvalue).PHD is somewhat limited in its usefulness due to its sensitivity to noise and that it assumes prior knowledge of the number of complex exponentials in the signal [11, 12].
3.2.2. Multiple Signal Classification (MUSIC)
MUiltiple SIgnal Classification (MUSIC) is one of the high-resolution subspace DOA algorithms that based on eigen decomposition of the autocorrelation matrix of the received signal. The MUSIC method decomposes the covariance matrix into two subspaces, signal subspace and noise subspace. The direction of arrival is determined from steering vectors that orthogonal to the noise subspace, by finding the peak in spatial power spectrum [13, 14].The power output of the MUSIC method can be written as: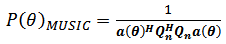 | (5) |
 is a noise subspace eigenvectors that obtained from autocorrelation matrix.
3.2.3. EigenVector (EV) Method
The MUSIC method was proposed as an improved to PHD, and in addition to the them, a number of other eigenvector methods have been offered for spectrum estimation of complex exponential in noise. One of these, the EigenVector (EV) method. The EigenVector is closely relate to the MUSIC algorithm. Specifically, the EV method estimates the exponential frequencies from the peaks of the eigenspectrum: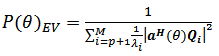 | (6) |
Where  is the eigenvalue associated with eigenvector
  ,
,  is the array steering vector.The only difference between the MUSIC method and EV method is the use of inverse eigenvalue (the λi are the noise subspace eigenvalues of R) weighting in EV and unity weighting in MUSIC, which causes EV to yield fewer spurious peaks than MUSIC [12].
4. Experimental Results
The ultrasonic transducers are used in DOA estimation experiment set for single and two sources. The FFT, PHD, MUSIC, and EV methods are used for DOA estimation. Then a comparison is made between high-resolution and classical methods for different values of the system parameter. The system parameters are N (number of samples), Δx (distance between samples and equal to d in equation), Zo (distance between transmitter and receiver). Figure (2) show the block diagram of the practical system that is used in the laboratory to estimate the DOA.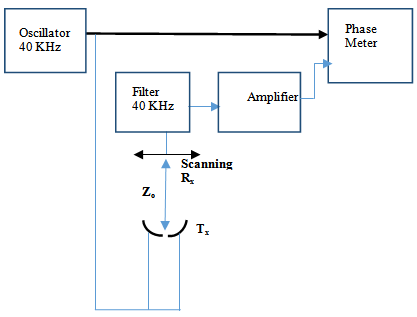 | Figure 2. The practical system block diagram for the DOA estimation |
In uniform linear array (ULA) the maximum distance between the elements of the array is less than or equal (λ/2), where λ is the wavelength. The wavelength of the ultrasonic is equal to 8mm. To satisfy the condition of ULA the distance between the ultrasonic transducers must be not exceed 4mm. The available transducers have 11mm diameter. Due to the distance from center to center of transducers is 11mm, so the scanning receiver have been used. Number of experiments are done to find the DOA estimation.To types of experiments were achieved:1. Experiment with single source2. Experiments with two sources
4.1. Experiment with Single Source
In this experiment, the parameters used are N=20 samples, Zo=70 cm, Δx=0.2cm, f=40 MHz, λ= 0.8 cm, θ=100 (Direction of arrival). We proposed that the maximum accepted sidelobe level (SLL) should not be less than the 3 dB from the desired peak (source). The results are shown in figures 3(a – d).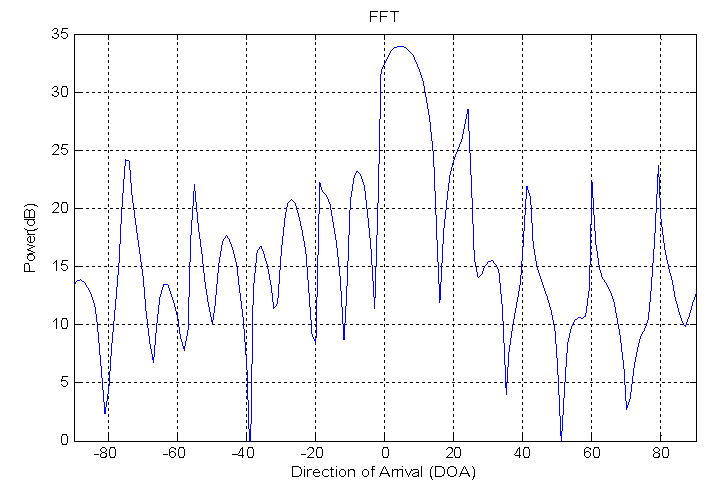 | Figure 3a. DOA estimation for single source using FFT method |
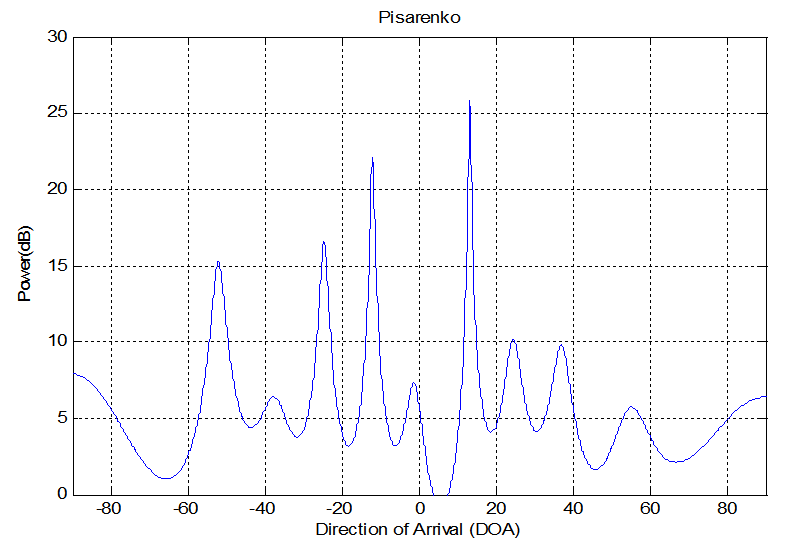
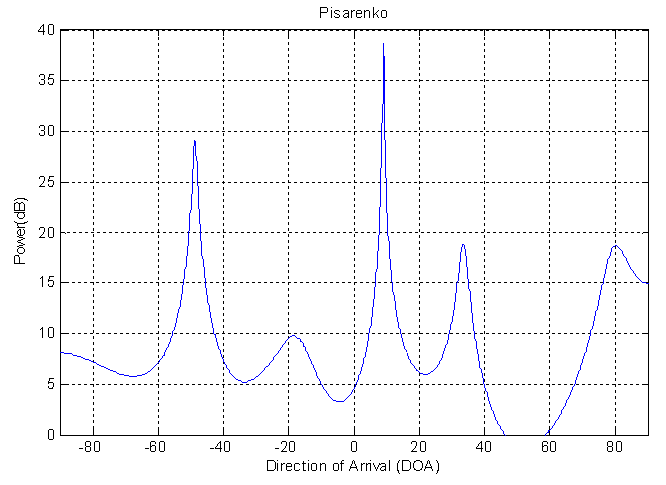 | Figure 3b. DOA estimation for single source using PHD method |
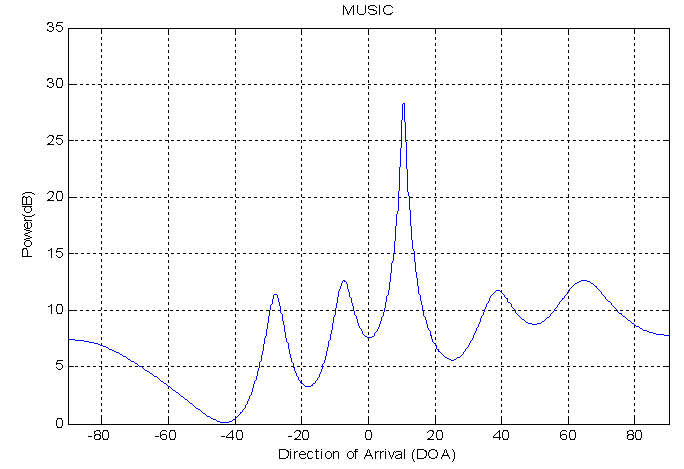 | Figure 3c. DOA estimation for single source using MUSIC method |
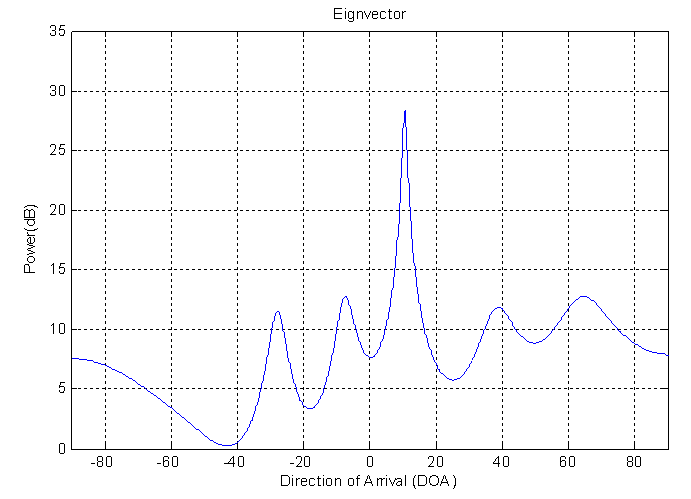 | Figure 3d. DOA estimation for single source using EV method |
Fig.3a indicate the FFT method. It is able to estimate the DOA but with high SLL and high error in resolution about (60%). In addition wide beamwidth about (120). The wide beamwidth give an ambiguity in estimation the DOA. The high error in the resolution is noticed in this method due to the short data used in the experiment where the resolution in this method is proportion inversely with the data length.Fig.3b shows the result of using PHD method. It is capable to estimate the DOA with SLL less than that in FFT method. In addition, the error in resolution for this method is smaller than that in FFT method and equal to 10%. It is narrow beamwidth and this property give accurate DOA estimation. The good results for this method because it is high-resolution algorithms.Fig. (3c&3d) shows the performance of using MUSIC and EV methods. However the results show very good DOA estimation. The SLL in those methods has results is better than FFT and PHD methods. The error in resolution are very small and equal to (5%), and these errors are smaller than FFT and PHD methods. Therefore, the MUSIC and EV methods are the best.The performance for the above method can be indicated in the table (1).| Table 1. Comparison between the performances of the DOA estimation methods for single source |
| | Method | Estimated Angle | Error % | | FFT | 40 | 60 % | | PHD | 90 | 10 % | | MUSIC | 10.50 | 5 % | | EV | 10.50 | 5 % |
|
|
4.2. Experiments with Two Sources
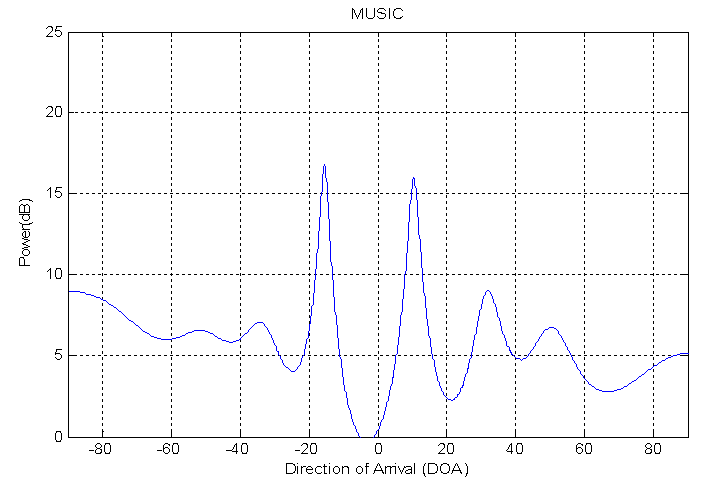
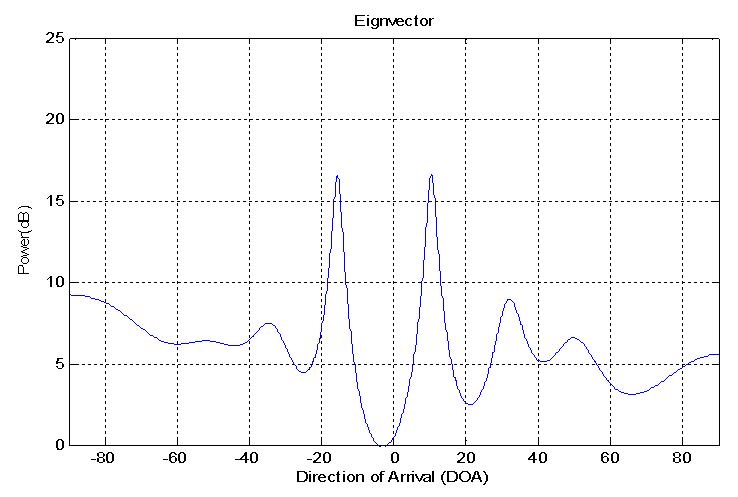
In these experiments, another type of DOA estimation have been achieved. Two sources of ultrasonic transducers DOA estimation are implemented. When the date is short, the classical method such as FFT failed to resolve between two sources for this reason the high-resolution algorithms are using. In the first experiment the parameters used are N=26 samples, Zo=63cm, Δx=0.2cm, f=40MHz, λ= 0.8cm, θ1=-120, θ2=100 (Directions of arrival). The results shown in figures 4(a – d) Figure 4.a shows the results of using FFT method. A high sidelobe level is clear and this is one of the disadvantages of the FFT method. It distinguish between the sources with large error in resolution equal to 63%. The error in resolution for the source one is 75%. It is failed to locate this source in the right direction. The error in resolution for the source two is about 50 %.Figure 4.b indications the result of using PHD method. It is capable to recognize between two sources with small error in resolution between them. This error equals to 15 %. The error in resolution for source one is very small and less than FFT method. This error equals 1.6 % so it locate the source in the specific direction. The error in resolution for source two equals to 30%. Figure (4.c) shows the result of using MUSIC method. It is low SLL. It is able to distinguish between two sources with small error in the resolution of the difference between them where the error equal 11%. This value of error are smaller than error in FFT and PHD. The error in resolution for source one is 19%. The error in resolution for source two is 2%, the source two are located in the right direction.Figure (4.d) displays the result of using EV method. It is low SLL. It is able to resolve between two sources with small error in the resolution of the difference between them. This error equals to 11%. This value of error are smaller than error in FFT and PHD. The error in resolution for source one is 19%.The error in resolution for source two is 2% so this source are located in the right direction. The performance for the above method can be indicated using the table (2).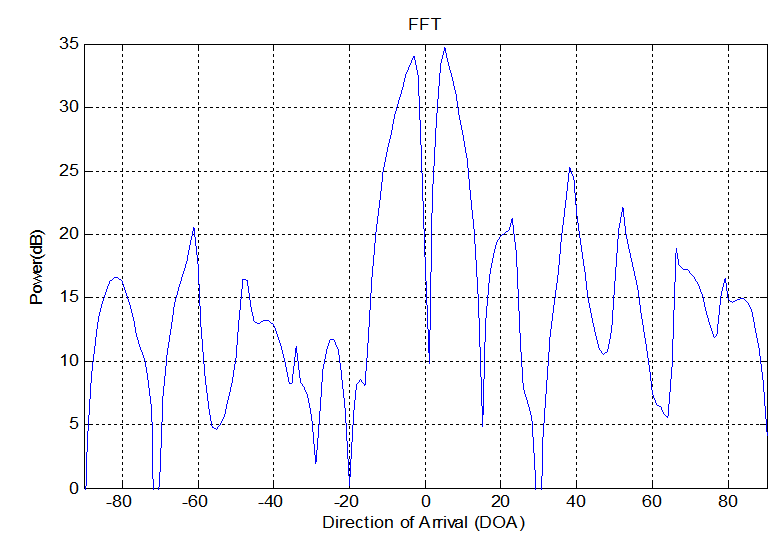 | Figure 4a. DOA estimation for single source using FFT method |
 | Figure 4b. DOA estimation for single source using PHD method |
 | Figure 4c. DOA estimation for single source using MUSIC method |
 | Figure 4d. DOA estimation for single source using MUSIC method |
| Table 2. Comparison between the performances of the DOA estimation methods for two sources |
| | Method | Estimated angle1 | Error% | Estimated angle2 | Error% | Error difference% | | FFT | -30 | 75% | 50 | 50% | 63% | | PHD | -12.20 | 1.6% | 13.10 | 31% | 14% | | MUSIC | -14.30 | 19% | 10.20 | 2% | 11% | | EV | -14.30 | 19% | 10.20 | 2% | 11% |
|
|
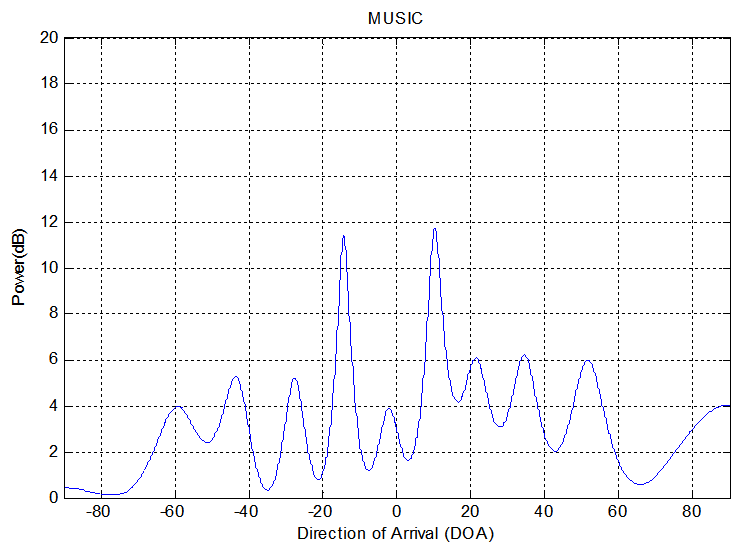
The second experiment the parameter used are N=20 samples Zo=62 cm, Δx=0.2cm, f=40 MHz, λ= 0.8 cm, θ1=-140, θ2=9.60 (Directions of arrival). The results shown in figures 5(a – d).Figure (5.a) shows the results of using FFT method to estimation two sources the difference between them are equal to (23.6). A high sidelobe level is clear and this is one of the disadvantages of FFT method. The error in resolution of the difference for two sources is 74%. This large value of error give an ambiguity in resolve between sources. The error in resolution for source one is equal to 85%. This value of error explain that the FFT method failed to locate this source in accurate direction. The error in resolution for source two is equal to 45%. This value of error less than the value in source one.Figure (5.b) display the PHD method. Low SLL and this is on advantages over FFT method. The error in resolution of the difference between sources is 21%. This result is good result compare with FFT method. The error in resolution for source one equals to 28%. The error in resolution for source two equals to 11%. 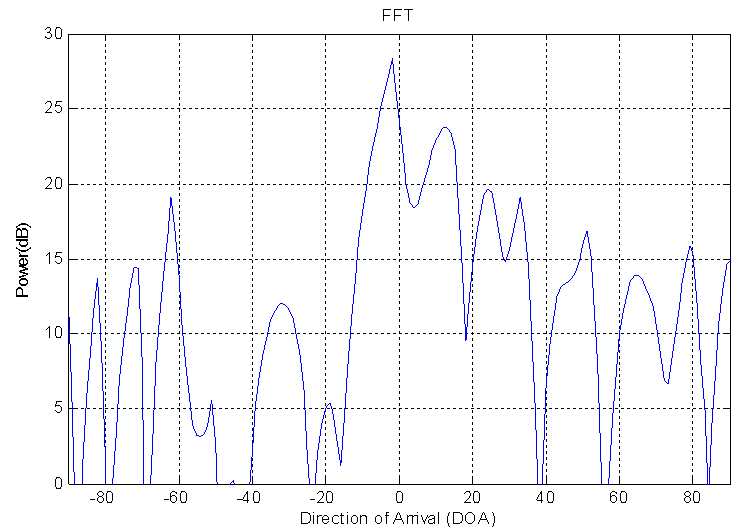 | Figure 5a. DOA estimation for two sources using FFT method |
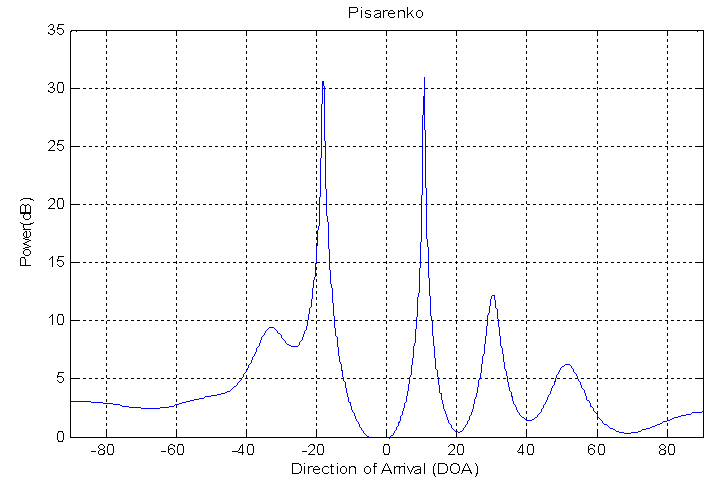 | Figure 5b. DOA estimation for two sources using PHD method |
 | Figure 5c. DOA estimation for two sources using MUSIC method |
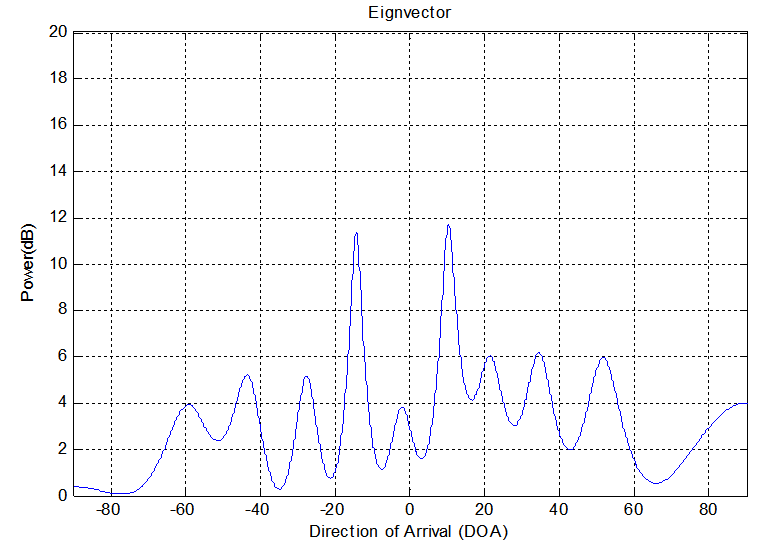
 | Figure 5d. DOA estimation for two sources using EV method |
| Table 3. Comparison between the performances of the DOA estimation methods for two sources |
| | Method | Estimated angle1 | Error% | Estimated angle2 | Error% | Error difference% | | FFT | -20 | 85% | 140 | 45% | 32% | | PHD | -180 | 28% | 10.70 | 11% | 21% | | MUSIC | -15.50 | 10% | 10.30 | 7% | 9% | | EV | -15.30 | 9% | 100 | 4% | 7% |
|
|
Figure (5.c) shows the result of using MUSIC method. The sidelobe level is low. It is able to recognize between two sources with small error in resolution equals to 9%, this value is less than error in FFT and PHD methods. The error in resolution for source one is 10%. The error in resolution for source two equals to 8%. These small error explain that this method locate each source in accurate direction. This method is better than FFT and PHD method in error resolution for each source.Figure (5.d) shows the result of using EV method. A lwo SLL is clear. It is able to recognize between two sources with small error in resolution equals to 8%. This value is less than error in FFT, PHD, and MUSIC methods. The errors in resolution for source one is 10% and for source two is 4%. These small error explain that this method is located each source in specific direction. This method is better than FFT, PHD, and MUSIC method in error in resolution for each source. The performance for the above method can be indicated using the table (1).
5. Conclusions
From the practical results that are presented in this paper, we conclude that the FFT method failed to locate the DOA for single source in the accurate direction. In addition, the high sidelobe level is clear and this is one of the disadvantages of FFT method. The high-resolution techniques estimated the DOA with small error compared to FFT method and this is one of the advantages of these techniques over FFT method. Also, the sidelobe levels were low. In two sources DOA estimation the FFT method failed to resolve between two sources in the specific difference resolution and with high sidelobe level, while the high-resolution techniques recognize between two sources with small error in resolution and low sidelobe level.
References
| [1] | Z.Chen, G. Gokeda, Y.Yu, “Introduction to Direction of Arrival Estimation”, Artech House, 2010. |
| [2] | J., D.H. and Dudgeon, D.E., “Array Signal Processing: Concepts and Techniques”, Prentice-Hall, Englewood Cliffs NJ, 1993. |
| [3] | Z., Xiaofei, Lv Wen, Shi Ying, Zhao Ruina, Xu Dazhuan, “A Novel DOA estimation Algorithm Based on Eigen Space”, IEEE International Symposium on Microwave, Antenna, Propagation, and EMC Technologies For Wireless Communications2007. |
| [4] | M. Viberg, M. Lanne, A. Lundgren, ‘’Calibration in Array Processing’’, chapter3 in thebook Classical and Modern Direction-of-Arrival Estimation, T. Engin Tuncer, B. Friedlander (Editors), Academic Press, July 2009, PP. 93-121. |
| [5] | V. F. Pisarenko, “The retrieval of harmonics from a covariance function Geophysics”, J. Roy. Astron. Soc., vol. 33, pp. 347-366, 1973. |
| [6] | R. Schmidt, “Multiple emitter location and signal parameter estimation”. IEEE Transactions on Antenna and Propagation. Vol. 34, PP. 276 – 280, 1986. |
| [7] | J. G. Proakis and Dimitris G. Manolakis, "Digital Signal Processing, Principles, Algorithm, and Applications", Third Edition, Prentice-Hall, Inc., 2007 |
| [8] | S. F. Cotter, A Two Stage Matching Pursuit Based Algorithm for DOA Estimation in Fast Time-Varying Environments, IEEE Proc. of the 2007 15th Intl. Conf. on Digital Signal Processing, 2007. |
| [9] | Weijie Zhu, “DOA estimation for broadband signal that use FFTinterpolation method”,4th IEEE International Conference on Software Engineering and Service Science (ICSESS), 2013. |
| [10] | S. Chandran,”Advances in Direction-of-Arrival Estimation”, 2006 ARTECH HOUSE, INC. |
| [11] | M. Bakha, Vani.R.M, and P.V.Hunagund,”Comparative Studied of Direction of Arrival Algorthims for Smart Antenna System”,World Journal of science and Technology, 1(8): 20-25,2011. |
| [12] | M. H. Hayes, "Statistical Digital Signal Processing and Modeling", John Wiley & Sons, Inc., Georgia Institute of Technology, 1996. |
| [13] | L. C. Godara, "Application of Antenna Arrays To Mobile Communications II. Beam-Forming and Direction-Of-Arrival Considerations," of the Proceedings IEEE, vol. 85, pp. 1195-1245, 1997. |
| [14] | K Reaz, F Haque, and M A Matin,“A comprehensive analysis and performanceevaluation of different direction of arrival estimation algorithms”, 2012 IEEE Symposium on Computers & Informatics (ISCI), PP. 256 – 259 |
 Abstract
 Reference
 Full-Text PDF
 Full-text HTML