-
Paper Information
- Next Paper
- Previous Paper
- Paper Submission
-
Journal Information
- About This Journal
- Editorial Board
- Current Issue
- Archive
- Author Guidelines
- Contact Us
American Journal of Signal Processing
p-ISSN: 2165-9354 e-ISSN: 2165-9362
2014; 4(1): 16-23
doi:10.5923/j.ajsp.20140401.03
Salt-and-Pepper Noise Removal and Detail Preservation Using Convolution Kernels and Pixel Neighborhood
 Abstract
 Reference
 Full-Text PDF
 Full-text HTML
Zayed M. Ramadan
Electrical and Computer Engineering Department, King Abdulaziz University –North Jeddah Campus, Jeddah, 21589, KSA
Correspondence to: Zayed M. Ramadan, Electrical and Computer Engineering Department, King Abdulaziz University –North Jeddah Campus, Jeddah, 21589, KSA.
| Email: |  |
Copyright © 2012 Scientific & Academic Publishing. All Rights Reserved.
This paper introduces a method for removal of salt-and-pepper impulsive noise from images while preserving edges and fine details. The method consists of two stages: detection and filtering. In the detection stage, two conditions must be satisfied for a pixel to be considered noisy. The first condition is based on convolution of the corrupted image with four convolution kernels and the second depends on the pixel under consideration in the sliding window and its neighborhood. In the filtering stage, the conventional median filtering is used except that only pixels that are considered noise-free in the sliding window of the detection stage are included in the calculations of the median value that replaces the corrupted pixel value. Small size of sliding windows and wide range of noise densities are used in this paper. Simulation results using many images of different features show superior results of the proposed method over other well-known methods in the literature of image restoration.
Keywords: Impulse noise, Salt-and-pepper noise, Convolution kernels, Noise detection, Noise suppression
Cite this paper: Zayed M. Ramadan, Salt-and-Pepper Noise Removal and Detail Preservation Using Convolution Kernels and Pixel Neighborhood, American Journal of Signal Processing, Vol. 4 No. 1, 2014, pp. 16-23. doi: 10.5923/j.ajsp.20140401.03.
1. Introduction
- Images are often corrupted by several types of noise that might cause serious impacts on their qualities. Impulse noise is a specific type that occurs for a short duration but with high energy due to camera sensors or transmission in noisy channels. Various methods have been proposed over the years to remove this type of noise[1-15].Standard median filter (SMF)[1] is one of the most popular filters used for this purpose. In SMF, the center pixel within a sliding window is replaced by the median value of the pixels in that window. Unfortunately, edges and fine details are often lost and a lot of blurring occurs by using SMF, especially when the size of the filtering window is large. Moreover, noise suppression is insufficient even for low size sliding windows. To overcome some or all of these drawbacks, various methods including variants of median filters have been proposed in the literature of image restoration.The adaptive median filter (AMF) proposed by[2] uses a specialized regularization technique to suppress salt-and pepper-noise. While the AMF works for a wide range of noise densities, it uses a large size of the filtering window.The convolution-based impulse detector and switching median filter (CD-SMF) algorithm[3] uses a predetermined threshold value to determine whether the pixel under consideration is corrupted or not. The restoration method for detection and filtering of salt-and-pepper impulsive noise presented in[4] is based on the minimum absolute value (MAV) of four convolutional kernels and on a filtering scheme that depends on sorting the pixels in the sliding window. The corrupted pixels in the proposed method in[5] are replaced by either the median pixel or a neighborhood pixel depending on a decision- based algorithm (DBA) using a small fixed size filtering window. The adaptive fuzzy switching filter presented in[6] uses a fuzzy logic approach and the maximum-minimum filter for impulse noise removal and edge preservation. The detection stage of the proposed method in[7] uses statistical tools while the filtering stage uses a filtering scheme based on adaptive network fuzzy inference system.The noise detection technique in[8] is primarily dependent on the correlations between a pixel and its neighbors. Noise candidates are selected first using the homogeneity level and then elimination of false detections is performed through a refining process. The unified approach for removal of salt-and-pepper noise and image deblurring presented in[9] employs a cost function that represents deblurring, robustness, and a piecewise smooth image model. The main strategy in the restoration technique proposed in[10] is to minimize convex cost-functions that are composed of both a smooth regularization and a non-smooth data fidelity terms. In[11], the detection stage is based on comparing the minimum absolute value of four mean differences in four directional windows with a predefined threshold value. In the filtering stage, an adaptive weighted mean filter is used. The method proposed in[12] uses an iterative pixel-wise modification of the absolute deviations (MAD) from the median to separate noisy pixels from the image details. A differential rank impulse detector (DRID) that compares signal samples within a narrow rank window based on both the rank and absolute value is proposed in[13]. The adaptive fuzzy switching median (NAFSM) filter proposed in[14] uses histogram of the contaminated image in the detection stage and employs fuzzy reasoning to handle uncertainty in its filtering mechanism. The method proposed in[15] employs both fuzzy techniques and the noisy image histogram to eliminate salt-and-pepper noise and preserve image sharpness.The foremost challenge is still open to obtain superior noise suppression without loss of edges and fine details for a reasonable and realistic wide range of noise levels. The main key in the restoration scheme presented in this paper is the detection stage. This stage is essentially based on convolving the corrupted image with four 7×7 kernels, and then compares the minimum absolute value of the results with a predetermined threshold value as a first step in the detection stage. In the second step, another threshold depending on the current pixel neighborhood in the sliding window is introduced to finally determine whether that pixel is noisy or not.The proposed method significantly removes salt-and-pepper noise while preserving fine details and edges. At the same time, it works very well for a wide variation of noise density corrupting various images with different features, and uses an adaptive filtering sliding window of small size.The rest of the paper is organized as follows. The proposed method is analyzed in detail in Section 2, extensive simulation results of the proposed method and other image restoration schemes are depicted in Section 3, and conclusions are shown in Section 4.
2. Proposed Method
- The noise in this paper is assumed to be salt-and-pepper impulse noise in which the noise is randomly distributed over the image. For 8-bit gray images, this noise takes on two extreme values, namely 255 for salt and 0 for pepper with equal probability. The proposed method consists of two stages: detection and filtering. In the detection stage, two steps are performed to determine whether a pixel is corrupted with noise or not. The first step is based on convolution of the corrupted input image with four one-dimensional Laplacianoperators (kernels) of size 7×7 that are sensitive to edges in different directions as shown in figure1. The minimum absolute value of these four convolutions is then compared with a threshold value (T) as a necessary but not sufficient condition for a pixel to be classified as noisy. Mathematically, the first step can be implemented as follows
 | (1) |
 stands for the corrupted input image,
  stands for convolution operation and
  stands for the pth convolutional kernel. The minimum absolute value of these convolutions is then compared with a threshold value, T, such that if
  is greater than T, then the considered pixel is a possible noise candidate. Otherwise, the pixel is noise-free and must be left unchanged. Mathematically, this can be expressed as
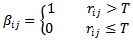 | (2) |
 is small if either the current pixel lies in a noise-free flat region (the four convolutions are small), or if it is an edge (at least one of the convolutions is small, and others are large). Moreover,
  is large if the current pixel is isolated impulse(the four convolutions are large). Only pixels that are considered as possible noisy candidates in the first step (denoted by
 ) are further processed through the second step to finally determine if these pixels are noisy or not. These pixels can be considered noisy if they are corrupted by either pepper or salt noise. A pixel is considered pepper noisy pixel if its value is 0 and the number of 0’s in the corresponding sliding window is less than some threshold value, say
  . Similarly, a pixel is considered salt noisy pixel if its value is 255 and the number of 255’s in the corresponding sliding window is less than the same threshold value,
  .Consequently, the second step can be expressed mathematically as
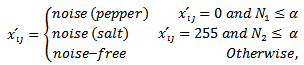 | (3) |
 and
and  are the number of
  and
and  in the sliding window, respectively.The threshold
  is directly proportional to the noise density, D, and its value is less than or equal to the total number of elements in the sliding window, i.e.,
  , where W is the length of the square filtering window. In the second stage of the proposed method, i.e., the filtering stage, the conventional median filtering is used. However, only uncorrupted pixels in the sliding window are counted in the calculations of the median value for the case in which the center pixel in the window is considered noisy in the detection stage. The following roughly estimate values of W are used in the simulations of the proposed method in which up to D = 60% total noise density is considered.
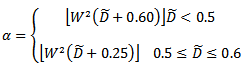
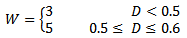 | (4) |
 , the following formula can be used as a starting estimate value after which the most optimum value can be found through computer simulations.
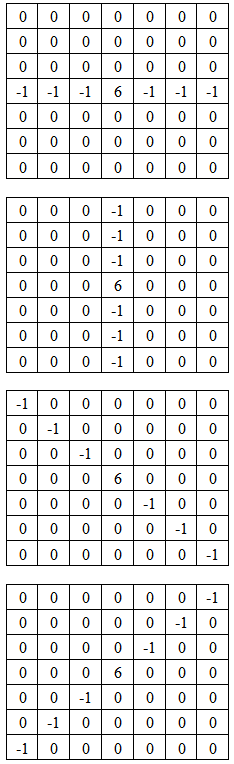 | Figure 1. Four 7×7 convolutionkernels |
 | (5) |
 | (6) |
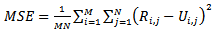
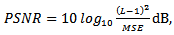
 is the floor operation.The quantitative indices for measuring the performance of the restoration methods in this paper are the mean absolute error (MAE), mean square error (MSE) and the peak signal to noise ratio (PSNR). These measuring indices are defined as follows:
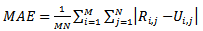 | (7) |
 | (8) |
 | (9) |
 for 8-bit gray scale images, M and N are the total number of pixels in the horizontal and vertical dimensions of the image, and
  and
and  are the pixel values in the
  locations of the restored (filtered) image and the uncorrupted image, respectively
3. Simulation Results
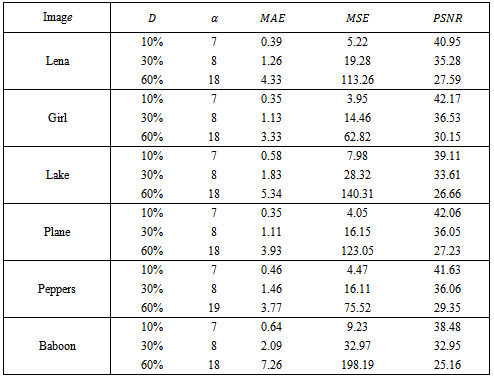
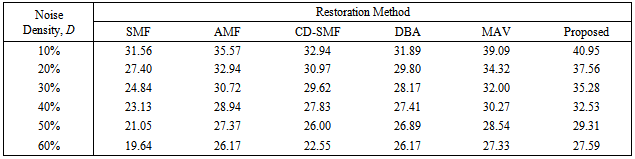
- The computer simulations of the proposed restoration algorithm are performed in MATLAB 7.13 (R2011b) on a computer equipped with 2.5 GHz CPU and 6 GB RAM. Many images were tested using the proposed method in this paper. However, six images, among those commonly used in the image restoration field, are used in this paper as shown in Figure 2. These images are: Lena (256×256), Girl (256×256), Lake (512×512), Plane (512×512), Peppers (512×512), Baboon (512×512). The performance of the proposed scheme is illustrated in detail by measuring its MAE, MSE, and PSNR for these six images corrupted with salt-and-pepper impulsive noise with varying density from 10% to 60% as shown in Table 1. The threshold value, T, in the proposed method used in Table 1 and throughout this paper is T =20. The other threshold value α is estimated by Eq. (7). Outstanding results are clearly shown in this table for all tested images.The visual appearance of the proposed method is also examined for the six images and for different noise densities. Figure 3 shows Lena, Girl, and Lake images corrupted with 20% and after being restored using the proposed method. Similarly, figure 4 shows Plane, Peppers, and Baboon corrupted by 40% and after being restored using the proposed method. The visual appearance is very satisfactory in both figures.The superiority of the results obtained using the proposed method can also be verified by comparing it with other methods as shown in Tables 2 and 3. These tables show a comparison of the proposed method with other five methods using Lena and Girl images. The PSNR measurements are shown in each table for a noise density variation from 10% to 60% with an increment of 10%. The results of the SMF are obtained with W=3 for D=10%, 20%, W=5 for D=30%, 40%, , and W=7 for D=50%, 60%. As clearly indicated in these two tables, the proposed method performs significantly better than all listed methods in terms of PSNR. For the Girl image, the performance of the proposed method is relatively close to MAV method for the lowest and the highest density ratios (10% and 60%, respectively) as depicted in Table 3. However, the proposed method performs much better than MAV method for all other noise levels.For further demonstration, the MSE is measured for the proposed restoration technique and other four methods (selected for their best performance) as shown in figure 5 and figure 6 using Lena and Girl images, respectively. The lowest MSE indicates the best performance and is considerably achieved by the proposed technique.
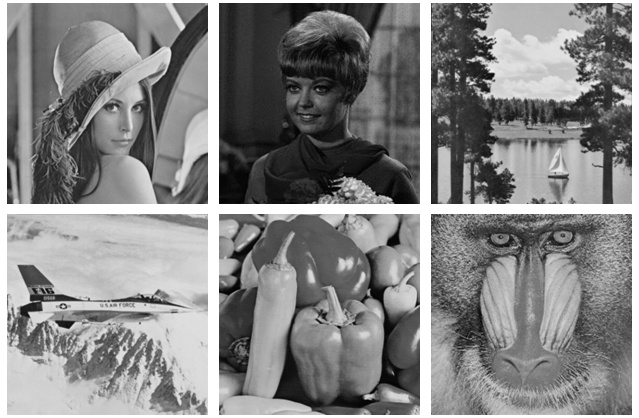 | Figure 2. Noise-free tested images used in this paper. First row (from left to right): Lena, Girl,Lake. Second row (from left to right): Plane, Peppers, Baboon |
|
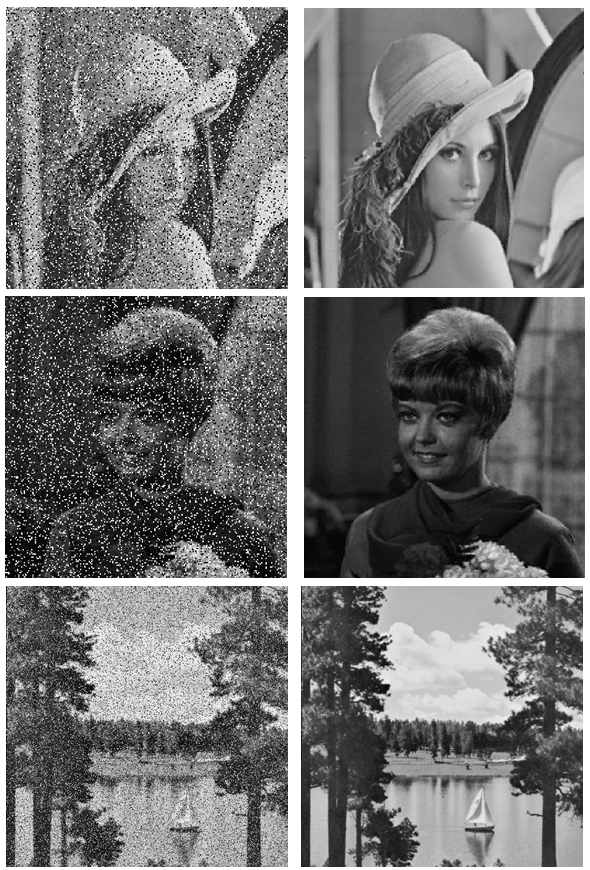 | Figure 3. First column: Lena, Girl, and lake images corrupted by 20% noise. Second column: corresponding images after being restored by the proposed method |
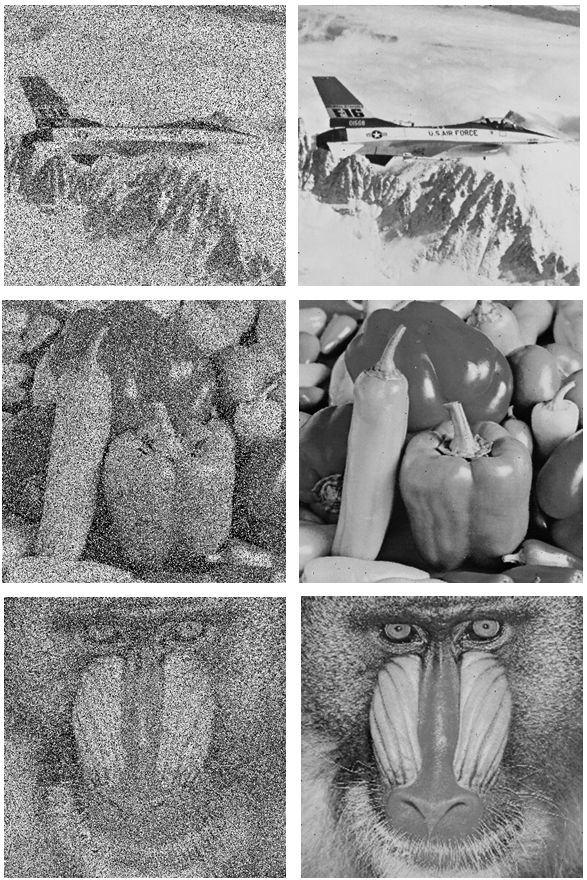 | Figure 4. First column: Plane, Peppers, and Baboon images corrupted by 40% noise. Second column: corresponding images after being restored by the proposed method |
|
|

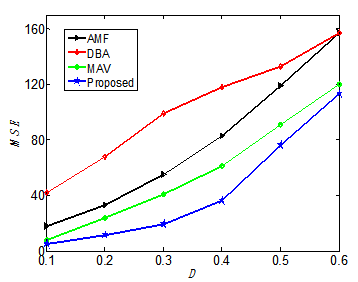 | Figure 5. MSE vs. D for several methods (Lena image) |
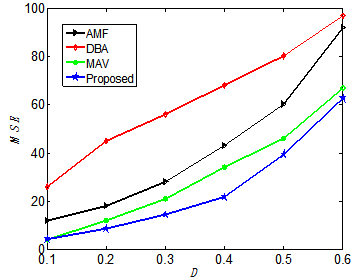 | Figure 6. MSE vs. D for several methods (Girl image) |
4. Conclusions
- In this paper, a new method is proposed for suppressing salt-and-pepper noise while preserving thin lines, edges and fine details. Two threshold values are used in the detection stage of the proposed technique to determine whether the pixel under consideration is noisy or not. An adaptive small size of the sliding window has been used to provide less blurring and more edge details. The method is examined using a large number of images, some of which are shown in this paper, and a wide range of noise density. Extensive computer simulations of the introduced restoration scheme indicate superior results in terms of both quantitative evaluation measuring indices and visual appearance. In addition, significant improvements in the image quality are achieved by the proposed method compared to many other existing techniques.