Jae Sok Son, Edward Banatoski, Yul Chu
Department of Electrical Engineering, The University of Texas-Pan American, Edinburg, 78541, Texas
Correspondence to: Jae Sok Son, Department of Electrical Engineering, The University of Texas-Pan American, Edinburg, 78541, Texas.
| Email: |  |
Copyright © 2012 Scientific & Academic Publishing. All Rights Reserved.
Abstract
Bandwidth and aperture limited range-Doppler radar imagery shows the interferences and artifacts due to sidelobes after two dimensional discrete Fourier transform (DFT) process. The artifacts formed by DFT processing reduce the resolution and distort the image. DFT of multiple weighted data with apodization suppresses sidelobes while maintaining mainlobe accuracy and preserving mainlobe and speckle noise pattern. The additional use of an alpha value α = 0.75 in the cosine on pedestal weighting function for generating the third weighted data set along with a new categorized tri-apodization technique for further image enhancement is proposed. The unique alpha value is based on minimization of pixel energy and results in smoother transitions and preservation of pixel shapes in the data. The new apodization method is based on categorization and results in better multiple target and target with noise discrimination, and improved sidelobe suppression. Examples using the α = 0.75 cosine on pedestal weighted third data set and categorized tri-apodization method demonstrate the improved sidelobe suppression without loss of resolution while preserving the clutter details and speckle textures in two dimensional range-Doppler radar images.
Keywords:
Apodization, Synthetic aperture radar, Resolution, Mainlobe, Sidelobe, Spatially variant apodization
Cite this paper: Jae Sok Son, Edward Banatoski, Yul Chu, Categorized Tri-Apodization for Sidelobe Suppression in Range-Doppler Radar Imagery, American Journal of Signal Processing, Vol. 3 No. 4, 2013, pp. 113-120. doi: 10.5923/j.ajsp.20130304.04.
1. Introduction
The range-Doppler radar forms its image by applying a two-dimensional discrete Fourier transform (DFT) that may produce significant high intensity sidelobes due to the bandwidth and aperture limitation. A sidelobe not only obscures low intensity scatterers near a prominent scatterer but also spreads the visible artifacts. Traditionally, sidelobes are suppressed by the non-uniform weighting window, which invariably widens the mainlobe width after DFT process resulting in degraded radar image resolution. Sidelobe suppression based on spatially variant apodization (SVA) methods have shown considerable radar image enhancement[1, 2] while maintaining the mainlobe width and target resolution without degradation. A common SVA technique uses a cosine-on-pedestal window whose sidelobes that correspond to rectangular and Hanning window applied impulse responses (IPR). These sidelobes are approximately 180 degrees out of phase reducing the summed sidelobe to a small value. For integer Nyquist rate sampled data, the sidelobes are exactly 180 degree out of phase with each other, and result in complete sidelobe suppression for a single impulse response image or a multiple disjoint impulse response image. For adjacent pixel IPR images integer with Nyquist SVA preserves image resolution while suppressing sidelobes. For non-integer Nyquist SVA, the zero-crossing rates of the IPRs are different resulting in higher sidelobe amplitudes than in the integer Nyquist sampling case. For an image that consists of multiple scattering centers, both integer and non-integer SVAs tend to eliminate the image of those scattering centers that have relatively weak amplitudes and does not preserve the clutter speckle pattern[3]. The two dimensional SVA processed multiple scattering point image while maintaining the mainlobe width generates a mainlobe where some pixels are completely altered resulting in poor mainlobe image quality. This phenomenon is more noticeable for a natural object whose shape changes smoothly than for artificial impulse response (IPR) objects.Another method for image enhancement uses complex dual apodization (CDA)[4]. In this method only in phase data is used for the apodization decision. This method generates an unnatural background image by specifically setting some weak signals to zeros. It does however preserve mainlobe width.Extending the dual apodization concept to the multiple apodization is experimented with limited successes. Multiple apodization uses different parametric windows for sidelobe apodization purpose. Particularly, multiple sidelobe apodization using the Kaiser window yielded better sidelobe suppressed radar image than SVA applied image. However, the application of multiple windows and their subsequent DFT processes was computationally intensive. Despite its superior image quality, the multiple apodization has limited success since the method is applicable when the data size is considerable small due to its computational cost[5].This paper addresses an effective radar image enhancement method for both integer and non-integer Nyquist sampled SAR/ISAR image by tri-apodization via comparison of intensity generated after DFT of three different cosine-on –pedestal weighted data. Like previous works such as multiple apodization, proposed technique maintains the original resolution and suppresses the sidelobes but does so more effectively and preserves clutter detail and texture for non-point-like areas such as a background, thus it retains the smooth and natural clutter image of the background and maintains high image quality without altered intensity pixels. The combination of maximum resolution of original image and sidelobe suppression without clutter distortion enhances overall radar image quality.
2. Analysis of Spatially Variant Apodization Technique
In this paper a tri-apodization based algorithm is developed so that a SAR/ISAR image can be resolved near at the theoretical best resolution possible assuming that the rectangular window processed image has the best resolution obtainable. Two of the data sets needed for the method are developed as in conventional SVA. The third is obtained from the cosine on pedestal with the unique shape weighting factor of α = 0.75 value.The different properties of rectangular, Hanning and cosine-on-pedestal windows are exploited to reduce the mainlobe width and suppress sidelobes simultaneously. Since a window imposes an effective bandwidth on the spectral line, the resolution is the minimum separation between two equal strength lines such that for arbitrary spectral locations where their respective mainlobes can be resolved[6]. The classic criterion for the window resolution is the width of the mainlobe at the half power points. To combine sidelobe suppression with mainlobe reduction, the properties of rectangular, Hanning and cosine-on-pedestal windows are considered. The spectral rectangular window applied to the DFT with N number of data sequence is | (1) |
where θ is a frequency periodic in 2π.The cosine-on-pedestal window function with amplitude parameter α | (2) |
applied to the DFT is | (3) |
where .α is a weighting parameter in the cosine-on-pedestal and constrained to 1≥α≥0.5. Two extreme cases of α in the cosine-on-pedestal window such as α=1 and α=0.5 correspond to the rectangular and Hanning window respectively. By reviewing rectangular and Hanning window properties, it is found that the translated kernels at Eq. (3) are located on the first zeros of the center kernel and have opposite phases[6]. The difference between normalized rectangular and Hanning window kernels is the two translated kernels in Hanning windowed DFT. By subtracting this difference from the rectangular window kernel, most of the sidelobes in rectangular windowed kernel are cancelled out while the mainlobe is widened. The three different α valued IPRs have to be compared with normalized values in respect of peak values for tri-apodization. Equation (3) has its peak magnitude at the first term, so it is divided by α value, yielding the normalized equation:
 | (4) |
For the multiple scatterers with different amplitudes, Eq. (4) is shifted and summed up as | (5) |
where Ak is a true signal value at normalized frequency θ in the continuum limit. Assuming Nyquist sampling rate, Eq. (5) can be simplified given that 2π/N occupy a bin and the normalized frequency θ is converted to the nth bin in the radar image as: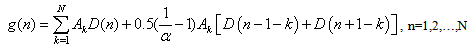 | (6) |
Note that D(n) is N periodic signal such that D(n)=D(n modulo N). Whenever an index number becomes negative, it is added with N. Expanding Eq. (6) to two dimensions, it is written as: | (7) |
where αm and αn are the weighting factors in the m and n directions. Ai,j is the true intensity at the (i,j) bin and the image size is M x N.Applying apodization or SVA to mth row of the radar image, the modified image has the form of | (8) |
where α changes with respect to n, so that the best window to be used. The parameter α(n) is defined as  | (9) |
Since the cosine-on-pedestal constrained to 1≥α(n)≥0.5, rectangular window is used for α(n)≥1 and Hanning window is used for  cases respectively. The output value is the lowest magnitude at the given point from the Hanning and rectangular weighted image or the image bin is set to zero when two windowed data have opposite signs[4]. If the scene consists of a single point target, the sidelobe can be completely eliminated without affecting the original resolution using SVA method. For a multiple point target, radar reflectivity is summed up coherently to form an image regardless the type of windows used as observed in Eq. (7). Taking the minimum value of two differently windowed signals or setting a bin intensity to zero via SVA process eliminates the signal with relatively weak amplitude in a scene with more than two point scatterers. The bins that are set to zero does not preserve the clutter speckle patterns and weak mainlobe intensity of the original signal, thus the SVA processed image resembles somewhat a binary image. Equation (7) shows that a signal bin is affected by its surrounding bin’s mainlobes and sidelobes generated by all image bins. Signal elimination phenomenon is severe for a target with complex multiple scatterers since multiple sidelobes of sinc functions interact with each other and those associate with other mainlobes. The interference of the mainlobe and sidelobes of adjacent scatterers decreases as the distance between scatterers increases. To mitigate the tradeoffs between rectangular and Hanning windowed DFT data, a third data set using α value of 0.75 in cosine-on-pedestal window is added to the SVA method. The choice of α value is based on maximizing the pixel energy. The energy measurement for one dimensional image feature is given as
 | (10) |
where p(j) is the normalized jth bin intensity. Equation (4) indicates the best image quality when its inverse value is the minimum. Applying the inverse energy measurement to Eq. (3) for the center lobe of the IPR case, the measured value becomes the minimum where α value is at 0.75 as shown in Fig. 1. The three different α valued IPRs have to be compared with normalized peak values.Fig. 2(a) shows the weighting functions of a rectangular, α=0.75 cosine-on-pedestal and Hanning windows and their respective IPRs are shown at Fig. 2(b) and 2(c). From the 0.5 normalized magnitude width the Rectangular IPR is the narrowest and the Hanning window IPR is the widest. This emphasizes that the image resolution can not be improved beyond the IPR resolution using a rectangular window. In the case where scatterers are located close to each other, the DFT of the rectangular windowed data can resolve scatterers better than either the Hanning windowed data or α=0.75 cosine-on-pedestal windowed data. 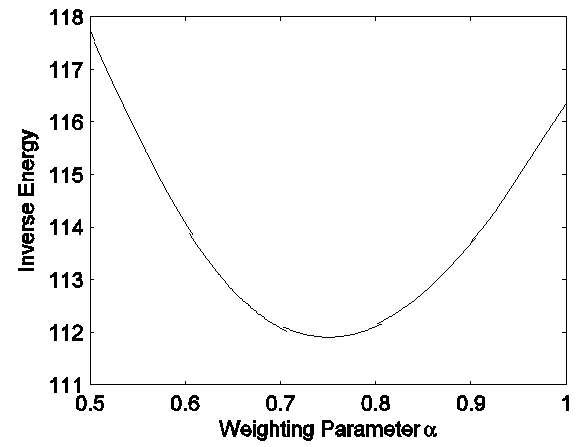 | Figure 1. Inverse entropy measure for the frequency response of cosine-on-pedestal window with varying weighting parameter |
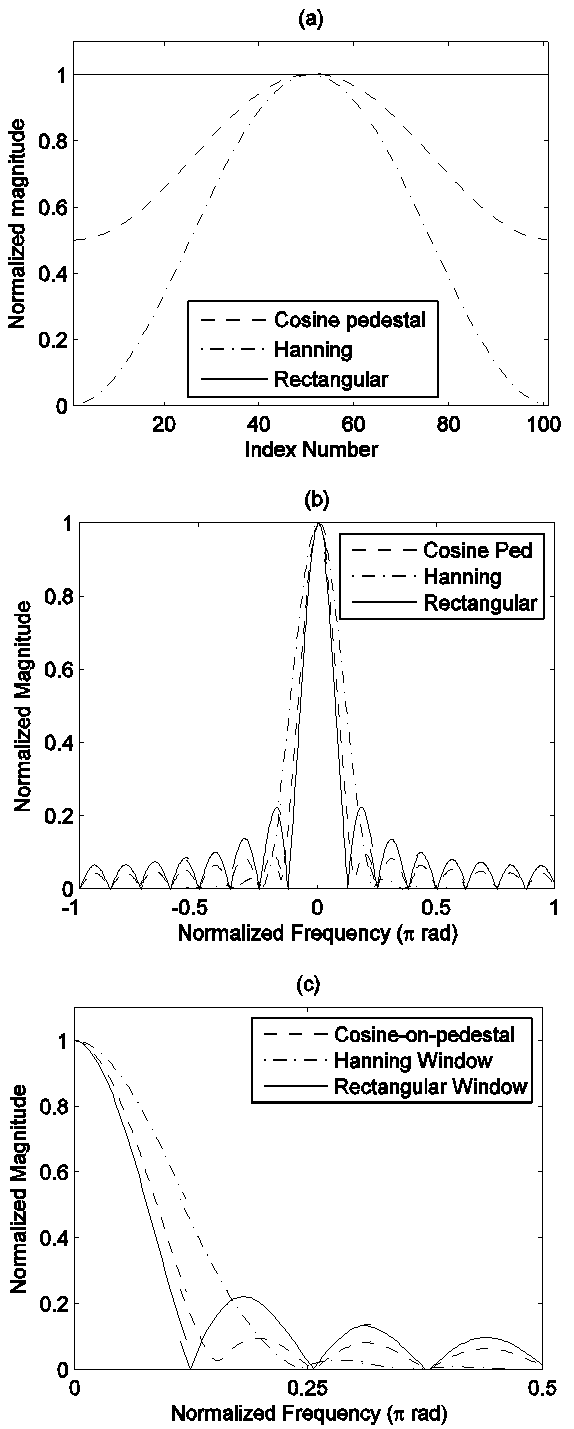 | Figure 2. (a) Rectangular, cosine-on-pedestal for α =0.75 and Hanning window weighting functions, (b) Frequency responses corresponding to windows in (a), (c) Zoomed image between 0 and 0.5π (b) |
3. Sidelobe Suppression by Categorized Apodization
3.1. Simple Impulse Response Categorization
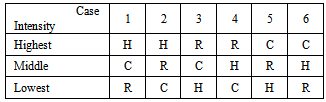
Abbreviating the rectangular, Hanning, and α=0.75 Cosine-on-Pedestal windowed IPR data sets for an impulse image shown in Fig. 2(b) and 2(c) as R, H, C respectively, the six possible combinations of intensity from greatest at the top to lowest at the bottom are shown at Table 1.Table 1. Possible combinations of intensity
 |
| |
|
Examining Fig. 2(c), the IPR case 1, it can be identified with the main lobe on the left of the diagram and the HCR ranking remains until near the first zero value of the rectangular minimum. Beyond that point the zero's of R and C coincide and R > C always, thus cases 5 and 6 do not occur for an ideal point impulse response. Scanning Fig. 2(c) from left to right the ranking with highest magnitude letter first and lowest magnitude letter last in order of occurrence are HCR(mainlobe), HRC, RHC, RCH, RHC, HRC, HRC, RHC, RCH. Thereafter the sequence RCH, HRC, HRC, RHC, RCH repeats for the sidelobes. It can be seen that the Case 1(HCR) in the Table 1 occurs for the mainlobe of IPR only. It can be seen the many occurrences of HRC and RHC indicating significant sidelobe magnitude reduction by using the categorized tri-apodization compared to the dual-apodization.
3.2. Impulse Response in the Presence of Adjacent Signal, Clutter, and Noise
The intensity in an image bin for a complicated scene can not be classified as either a mainlobe or a sidelobe after DFT processing because of the interferences caused by coherent summation in the DFT processing, then a bin is roughly classified into three categories, predominantly mainlobe, predominantly sidelobe, and transition or mixed intensity bins.Predominantly mainlobe bin ranked as HCR is found where the IPR magnitude has the minimum value using the rectangular window (α=1) and it is inversely related with α value. Thus, the mainlobe IPR height is smaller with the rectangular window than that of using α=0.75 cosine-on-pedestal window or Hanning window as shown in Fig. 2(b) and Fig. 2(c). Predominantly sidelobe region is found where the IPR magnitude of using the Hanning window (α=0.5) is minimum and increases with increasing α value. Thus, the sidelobe IPR height is lower with the Hanning window than that of using α=0.75 cosine-on-pedestal window or rectangular window, consequently the intensity order is ranked as RCH. The transition region is defined where the IPR changes from mainlobe to sidelobe or vice versa and is confined to the first sidelobe region of the rectangular windowed IPR. In comparing IPRs of the rectangular and Hanning windows, the phase and amplitude at the edges of the mainlobe where the transition happen are not identical, thus amplitude cancellation using these two windows are not perfect. Cosine-on-pedestal with α=0.75 windowed IPR is used to suppress this transition region for either HRC or RHC ranking.Consider now the effects of adjacent signal, clutter, and noise on the mainlobe category. It can be seen from Fig. 2(b) and Fig. 2(c) that in the mainlobe region intensity using cosine-on-pedestal window is much closer in value to the rectangular window processed intensity than the Hanning window processed intensity. The most likely effect is then to have HRC occur rather than HCR. In this case the corresponding category would be transition. The intensity error due to erroneous categorization however is small when R and C are close in value and increases with increasing difference in R and C value where the HRC error is less likely to occur.Consider now the effects of adjacent signal, clutter, and noise on the side lobe category. The sidelobe category is RCH. In some parts of the sidelobe, H is much smaller than R and C but the additional signal effects may reverse C and R. This is bin 5 which does not occur for the impulse response. Assuming the effect is due to clutter or adjacent signal, the C value should be selected same as the transition region and the three cases HRC, RHC, and CRH are lumped in a single category called mixed bin. System noise presence in the sidelobe error region where all intensities are low has minimal tri-apodization error. Near the zeros intensity, it is possible to have any of the six cases including the other case that did not occur in the impulse response CHR ranking. Near the zeros all values are small so any case could be selected so CHR ranking is also placed in the mixed bin and C is selected. If the mainlobe sequence occurs, R is selected but since all values are small the R value will also be small and the incorrect categorization has little effect.Finally, consider the effects of adjacent signal, clutter, and noise in the transition region where HRC and RHC rankings occur. In the HRC ranking to RHC ranking transition, the effect of noise would make HRC to RHC or RHC to HRC which does not affect the result as it is transition or what is now mixed bin. For the transition RHC region near the RCH region, the most likely error is RCH. The selected value changes from C to H but in the first sidelobe values of C and H are both small and about equal so the error is small. After the transition where the value is no RCH, the error will most likely be RHC, that is transition rather than sidelobe and C is selected rather than H. Again both are small values compared with R and both about equal value so the overall error is small.
4. Categorized Tri-Apodization Implementation
A basic SAR/ISAR one-dimensional image improvement has the nine possible weighting combinations are (αm, αn) = (1, 1), (1, 0.75), (1, 0.5), (0.75, 1), (0.75, 0.75), (0.75, 0.5), (0.5, 1), (0.5, 0.75) and (0.5, 0.5). In practical applications, categorized tri-apodization method is applied on one dimension only such as αm = 1, 0.75 and 0.5. For the computed αm for each pixel, the method is applied on the other direction such as (αm, αn) = (αm, 1), (αm, 0.75) and (αm, 0.5). For the two dimensional M x N matrix, the steps would be as follows.1. Considering at each n, an m indexed one dimensional array using the three weighted FFT's rectangular, Hanning, and α=0.75 cosine on pedestal are generated and the FFT data is selected based on categorization as in the first three steps discussed for the one dimensional image.2. Using the M x N matrix of FFT data array generated from step one for each m, three n indexed windowed IFFT are generated again using rectangular, Hanning, and α=0.75 cosine on pedestal. Again using the same categorization scheme one of the three IFFT values at each n and m is selected.3. Display the M x N magnitude matrix as an image.
5. Simulation Results
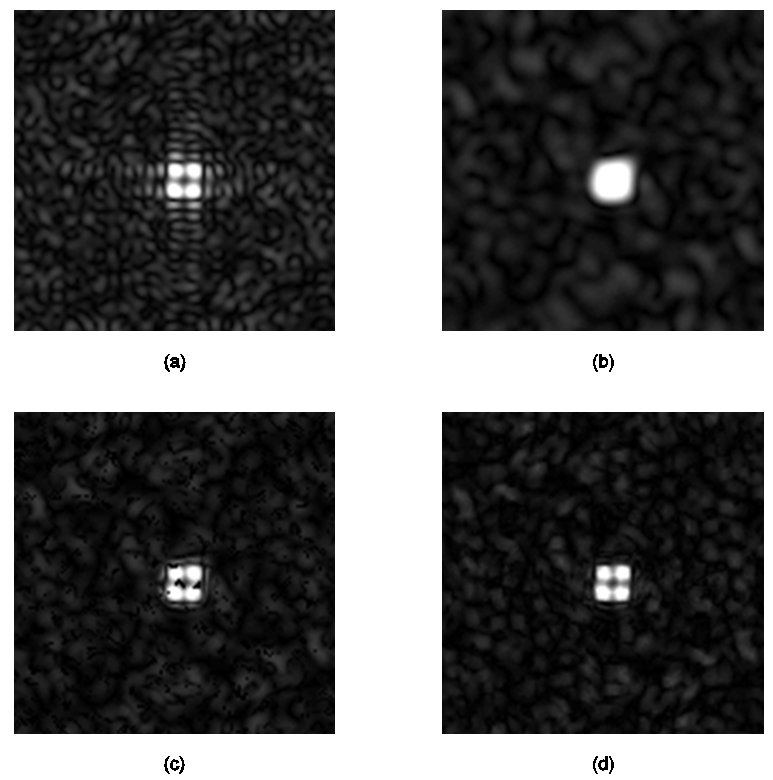
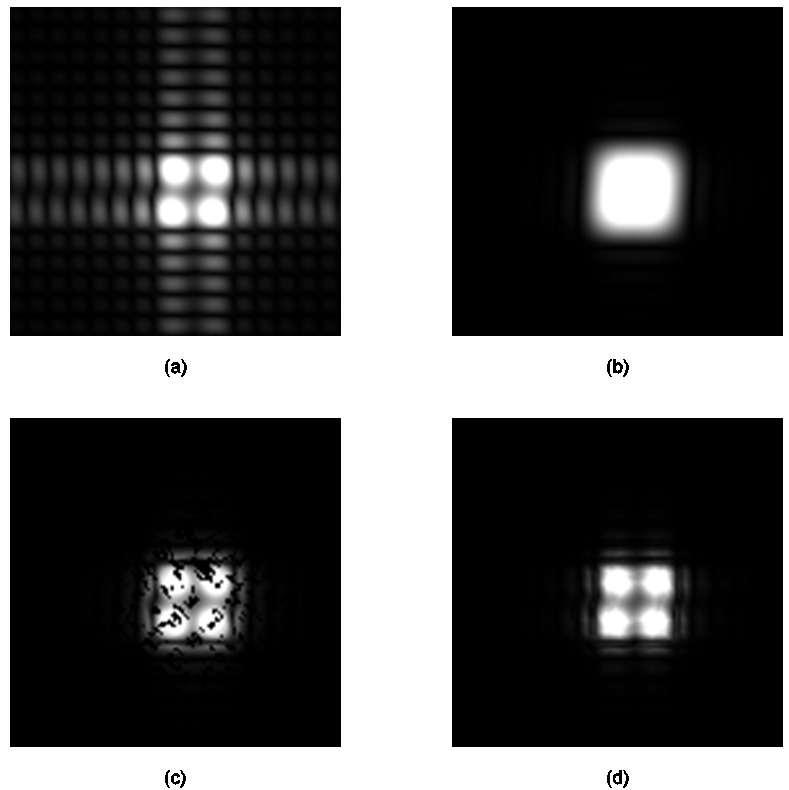
The simulation results of categorized tri-apodization method are compared with results of the spectral estimation using SVA in Fig. 4. The SVA processed image shown in Fig. 3(a) suppresses sidelobes almost perfectly while categorized tri-apodization method applied image shown in Fig. 3(b) has some visible sidelobes for an ideal point target in high SNR one dimensional data. However, the proposed method compares favorably in terms of mainlobe shapes and sidelobe level for a complex scene as shown in Fig. 4. Figure 4(a) shows the SVA processed image of two point scatterers separated by 0.25 and the first scatter amplitude is twice higher than the second scatter amplitude. Unlike a single ideal point scatterer case, the several peaks appear at the edges of the two scatterers. Split peaks impede the correct signal detection as they can be interpreted as several scatterers. In contrast, Fig. 4(b) shows that the two-points target with the highest magnitude are clearly resolved after proposed technique is applied. The sidelobe level is maintained at the same level as one point scatterer case and its shape is smooth. It can be induced that the proposed method is adequate for the image formation of a complex target while SVA can be applied to a simple scene.Simulations for two-dimensional data were performed to test and compare the proposed algorithm to both classical windowing and SVA methods. The stepped-frequency waveform radar was used and its parameters were: initial frequency=3.0 GHz, bandwidth=276.5 MHz, frequency step=8.92 MHz, pulse repetition frequency=5.4 KHz, number of pulses per burst=32, number of bursts=32 and SNR of 0 dB. Four ideal point targets are located 0.54 m apart from each other with equal intensities. Both range and cross-range resolutions are 0.54 m respectively for the radar parameters given, making the total range and cross-range distance to be 17.28 m. The data was zero-padded to fit in 128x128 pixel points. Figure 5(a) has high sidelobes due to the use of the rectangular window. Figure 5(b) shows that four point scatterers are merged as one scatterer since four point scatterers are not separable after the Hanning windowed DFT process. The sidelobe apodization helps to suppress the sidelobes and to resolve four scatterers as shown in Fig. 5(c). There is however significant distortion of the four peaks due to blanked pixels. Figure 5(d) shows that four point scatterers are clearly resolved and sidelobes are suppressed better after using the proposed method. In addition the proposed method preserves the smooth and natural background noise shape. Figure 6 shows results of target focused analysis by using only 16 bursts and 16 pulses, thus total range and cross-range are 8.64m. The SNR is set to 100dB. Better resolution is obtained by using both SVA in Fig. 6(c) and categorized tri-apodization in Fig. 6(d) compared to the classical Hanning windowed IRR image in Fig. 6(b), but the latter shows no split mainlobe pixels and better first side lobe suppression. Finally Fig. 7(a) shows a synthetic image of Boeing 727 airplane with prominent sidelobes. Figure 7(b) shows sidelobe suppressed image with loss of the resolution due to the use of Hanning window. The categorized tri-apodization processed image in Fig. 7(d) shows a clearly defined wing edge image with better preserved resolution and sidelobe suppression compared to the SVA processed image in Fig. 7(c). 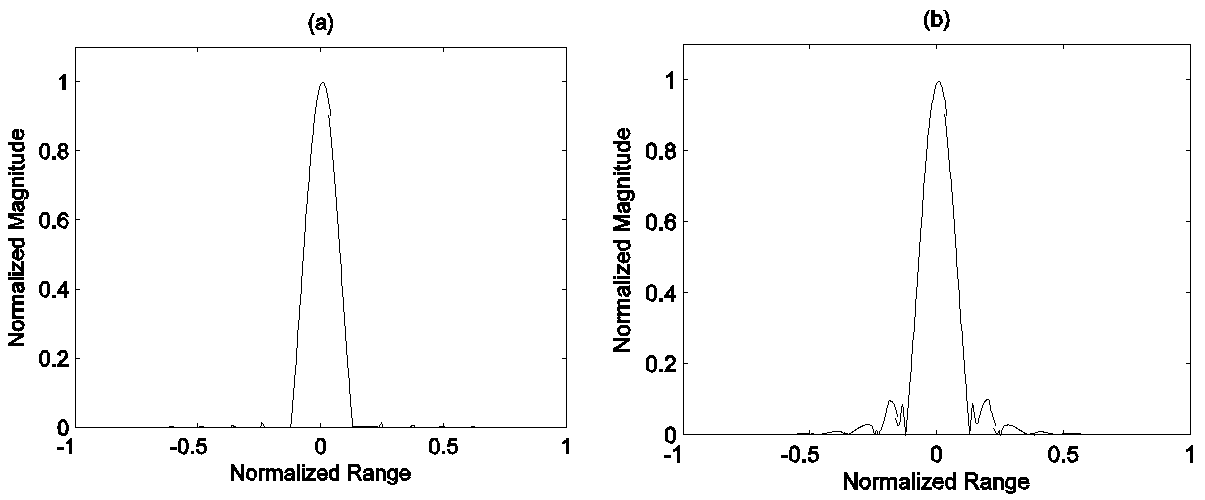 | Figure 3. (a) SVA impulse response, (b) Categorized tri-apodization based impulse response |
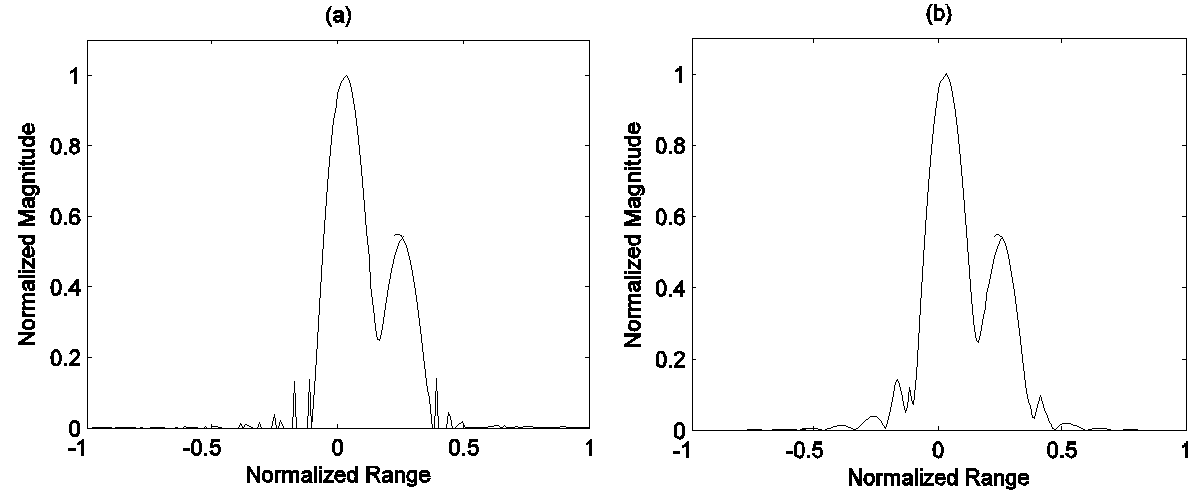 | Figure 4. (a) Spectral analysis for a signal consisting of two point scatterers located at the normalized frequencies of 0 and 0.25π with amplitudes of 1 and 0.5 respectively (a) using SVA, (b) using categorized tri-apodization method |
 | Figure 5. Comparison of two dimensional spectral estimations of four point synthetic scatterers with noise using (a) rectangular window, (b) Hanning window, (c) SVA, (d) categorized tri-apodization method |
 | Figure 6. Comparison of two dimensional spectral estimations of four point synthetic scatterers without noise using (a) rectangular window, (b) Hanning window, (c) SVA, and (d) categorized tri-apodization method |
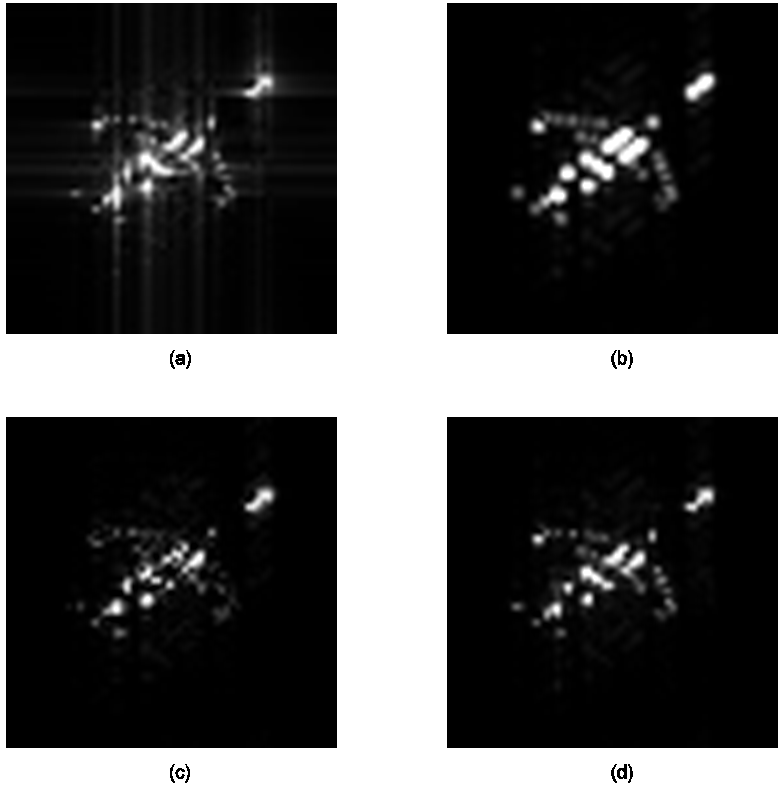 | Figure 7. Comparison of two dimensional spectral estimation of Boeing 727 synthetic images using (a) rectangular window, (b) Hanning window, (c) SVA, (d) categorized tri-apodization method |
6. Conclusions
A SAR/ISAR image enhancement method based on the combination of mainlobe width reduction and sidelobe suppression by associating Hanning, rectangular and cosine-on pedestal window was presented. Several simulated results demonstrate that the SAR/ISAR images can be improved without introducing significant amounts of artifacts, thus low intensity scatterers near high intensity scatterers can be detected. Thus the method can be applied to a complex shaped target imaging. The categorized tri-apodization method has a potential for precision range-Doppler radar image analysis due to its sidelobe suppression ability without loss of original resolution while preserving image clutter detail and texture. This non-parametric technique can be extended to 3-dimensional radar imaging and optical imaging.
ACKNOWLEDGEMENTS
This work was supported by contract(NMA501-03-1-2032) from the National Geospatial- Intelligence Agency.
References
| [1] | H. C. Stankwitz, M. R. Kosek, “Super-Resolution for SAR/ISAR RCS Measurement Using Spatially Variant Apodization,” Proceedings of Antenna Measurement Techniques Association (AMTA) 17th Annual Meeting and Symposium, Williamsburg, VA, Nov. 1995, 251-256. |
| [2] | J. S. Son, G. Thomas and B. C. Flores, Range-Doppler Radar Imaging and Motion Compensation, Artech House, MA, 2001. |
| [3] | S.R. DeGraaf, “SAR Imaging via Modern 2-D Spectral Estimation Methods, IEEE Transactions on Image Processing,” Vol. 7, No. 5, May 1998. |
| [4] | H. C. Stankwitz, R. J. Dallaire and J. R. Fineup, “Nonlinear Apodization for Sidelobe Control in SAR Imagery,” IEEE Trans. On Aerospace and Electronic Systems, Vol. 31, No. 1, January 1995, 267-279. |
| [5] | G. Thomas, J. S. Son, B. C. Flores, “Sidelobe Apodization Using Parametric Windows,” SPIE Proc: Algorithms for Synthetic Aperture Radar Imagery VI, Orlando, FL, Vol. 3721, Apr. 1999. |
| [6] | F. J. Harris, “On the Use of Windows for Harmonic Analysis with the Discrete Fourier Transform,” Proceedings of the IEEE, Vol. 66, No. 1, January 1978, 51-83. |
 Abstract
 Reference
 Full-Text PDF
 Full-text HTML